


Services on Demand
Article
 English (pdf)
 Article in xml format
 Article references
Indicators

Related links
-
 Cited by Google
 -
 Similars in Google
Share

 Permalink
Water SA
On-line version ISSN 1816-7950
Print version ISSN 0378-4738
Water SA vol.46 n.4 Pretoria Oct. 2020
http://dx.doi.org/10.17159/wsa/2020.v46.i4.9070
RESEARCH PAPER
Irrigation scheduling for green beans grown in clay loam soil under a drip irrigation system
Mohamed E AbuarabI; Salma M HafezI; Mohamed M ShaheinII; Ahmed M HassanI; Mohamed BI El-SawyIII; Mohamed M El-MogyII; Emad A AbdeldaymII
IAgriculture Engineering Dept., Faculty of Agriculture, Cairo University, El-Gama St. 9,12613 Giza, Egypt
IIVegetable Crops Dept., Faculty of Agriculture, Cairo University, El-Gama St. 9,12613 Giza, Egypt
IIIDepartment of Horticulture, Faculty of Agriculture, Kafrelsheikh University, Kafrelsheikh, Egypt
ABSTRACT
An experimental field trial was conducted at El-Ayat, El-Giza Governorate, Egypt (latitude 30°11"I3"N, longitude 31°41'38"E, and mean altitude 74 m above sea level) during the growing season of 2017 and 2018. The study aimed to assess the suitable irrigation interval and applied water volume for drip-irrigated green beans, based on water production functions and water use-yield relationships. The field trial was arranged in a split-plot design with 3 irrigation intervals (F1, F2 and F3 irrigation events, once every 1, 2 and 3 days, respectively) and 3 irrigation regimes (I1: 1.00, I2: 0.80, and I3: 0.60 of the crop evapotranspiration, ETc). The results showed that the yield and water use efficiency (WUE) increased with increasing irrigation interval. Maximum and minimum yield of 12 030 and 4 879 kg-ha-1 were obtained in F1I2 and F3I3 treatment, respectively, in the winter season of 2017, and were 12 364 and 4 678 kg-ha-1 for the corresponding treatments in the winter season of 2018. WUE ranged from 56.55 kg-ha-1-mm-1 in F1I2 to 23.80 kg-ha-1-mm-1 in F3I3. Plant growth parameters were significantly affected by the irrigation schedule. The highest plant growth parameters were obtained under F1 and F2. The seasonal yield response factors (ky) were 0.845 and 0.856 in 2017 and 2018, respectively. The relationship between yield and seasonal crop ET was best explained by a power function for all irrigation schedules for both growing seasons. It is recommended that the F1I2 irrigation treatment is the suitable one for green beans grown under field conditions, in order to achieve the highest yield and WUE.
Keywords: irrigation schedule, evapotranspiration, drip irrigation, green bean yield, irrigation water use efficiency
INTRODUCTION
By the year 2050, it is forecast that there will be a universal yearly water deficit of 640 billion m3 (Spears, 2003). Given that water shortages currently plague every country in North Africa and the Middle East, insufficient water supply for irrigation in these regions, even for short periods, will almost certainly become the norm rather than the exception. Thus, water scarcity has gained increasing importance on both scientific and political agendas. Because irrigation is the largest consumer of water, accounting for 71% of freshwater use worldwide, it is necessary for irrigation water management practices to shift from a focus on production per unit area to maximizing production per unit of water consumed (Fereres and Soriano, 2007).
Significant progress has been made in dissemination of drip irrigation systems, but coping with the looming water crisis requires further improvement in drip irrigation management. Many authors have shown that water use efficiency and crop productivity using a drip irrigation system might be improved by reducing the volume of water applied, to prevent water seeping away from the root zone (Hergert et al., 2016; Çolak et al., 2017; Coyago-Cruzrt et al., 2019; Vwioko et al., 2019). Thus, it is important to determine the actual water volume required for crop growth. Moreover, it is necessary to develop appropriate irrigation schedules to maximize crop production (El-Hendawy et al., 2008; Abuarab et al., 2019). Both evapotranspiration (ET) and crop coefficient (Kc) are influenced by the climate, crop type and physiological growth stage of the crop (Testa et al., 2011). Deficit evapotranspiration is a technique to increase the water use efficiency. Deficit evapotranspiration could be manipulated through adopting new agricultural management practices. The target of deficit irrigation is to increase the water use efficiency for crops by reducing the irrigation water volume via reducing the number of irrigation events (Coyago-Cruz et al., 2019). The application of deficit irrigation interacts with the appropriate irrigation scheduling, which is verified in the field, since crop sensitivity to water stress throughout the growing season changes with the phenological stage (Istanbulluoglu, 2009). Furthermore, water deficit at particular stages of the growing season enhances fruit quality, despite the lack of productivity caused by water restrictions (Patanè and Cosentino, 2010). Drip irrigation has improved water use efficiency significantly by reducing the runoff and evaporation losses (Çolak et al. 2017). Recently, deficit irrigation has been proposed as a potential method to achieve high water use efficiency by different crops.
The combination of deficit irrigation and irrigation frequency is important to achieve the highest yield and water use efficiency. Ertek et al. (2004) reported that irrigation at 0.85 Kcp and a 5-day irrigation interval are recommended for summer squash grown under loamy soil, in order to produce higher summer squash yield. Uçan et al. (2007) reported that the effects of irrigation water amount and plant water consumption are important to produce high yields and water use efficiency of sesame under clay loam soil. El-Hendawy and Schmidhalter (2010) reported that the relationship between WUE and grain yield is often used for determining the optimal irrigation strategy for arid and semi-arid regions. High values of WUE are obtained for large yield values. Irrigation once every 2 days with 1.00 ETc is recommended with adequate irrigation water. When the irrigation water is limited, irrigation once a day with 0.6 ETc is recommended as the best irrigation schedule for drip-irrigated maize in sandy soils.
Sezen et al. (2005) demonstrated that irrigation water amount and irrigation frequency had a significant effect on yields of field-grown green beans under the Mediterranean climatic conditions in Turkey. Irrigation intervals and plant-pan coefficients had a significant effect on yield and quality of green bean. The maximum yield was obtained with a 2-3 day irrigation interval and plant-pan coefficient of 1.00, which had the highest water use. The results also indicated that WUE and IWUE values decreased with increasing irrigation interval.
The plant is very responsive to environmental conditions and abiotic factors such as temperature, humidity, precipitation and soil moisture, all of which can affect its yield and quality. Understanding the relationship between the plant and water consumption, as well as developing different management systems based on this knowledge, may help maximize the yield. Since water requirements of green beans have not been investigated sufficiently so far under arid conditions, irrigation water planning and management need to be studied.
The current study aims to assess the suitable irrigation interval and applied water volume (irrigation schedule) for drip-irrigated green beans, specified by water productivity functions and water use-yield relationships.
MATERIALS AND METHODS
Open-field experiment
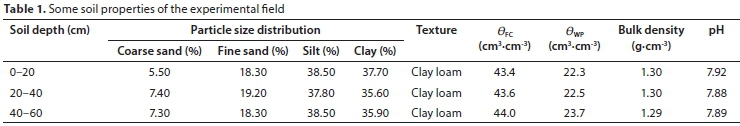
A field experiment was conducted during the winter growing season of 2017 and 2018 at El-Ayat, El-Giza Governorate, Egypt (latitude 30°11'13"N, longitude 31°41'38"E, and mean altitude 74 m amsl). The soil of the experimental site is classified as clay loam. Physical and chemical properties of the experimental soil are given in Table 1. Irrigation water was obtained from a deep well located in the experimental area, with pH 7.43 and an average electrical conductivity of 0.59 dS-m-1.
Weather conditions
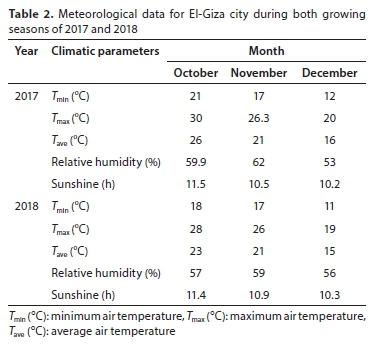
The field experiment was conducted in an area of arid climate with cool winters and humid summers with almost nil rainfall (< 20 mm). The following climatic variables were recorded daily during both growing seasons: maximum, minimum and average air temperature, air relative humidity and sunshine hours. During the growing season (October-December), the maximum air temperature ranged from 20-30°C in 2017 and 19-28°C in 2018, while the minimum ranged from 12 to 21°C and from 11 to 18°C in the 1st and 2nd growing seasons, respectively (Table 2).
Crop administration
Three seeds of green bean (Phaseolus vulgaris L.) were sown around each dripper on 12 October 2017 and 2018 (90 000 plants-ha-1).
Nitrogen (50 kg-ha-1), phosphate (20 kg-ha-1) and potassium (41.5 kg-ha-1) fertilizers were added in the form of ammonium sulphate (20.5%), calcium superphosphate (15.5%) and potassium sulphate (48%). The fertilizers doses were added 2 weeks after planting at 6 equal weekly doses for nitrogen, while phosphate was added entirely before planting, and potassium was applied 5 weeks after planting in 2 equal biweekly doses. Hand harvesting was performed at approximately 70 days after planting.
System installation and experimental treatments
A split-plot design with 3 replicates was applied in both growing seasons. The irrigation interval treatments (F1: once every day, F2: once every 2 days and F3: once every 3 days) were assigned to the main plot. The irrigation regime treatments 1.00 ETc, I2:
0.80 ETc and I3: 0.60 ETc) were allocated in the subplot (Fig. 1).
Each plot had a gate valve and flow metre to control water application and to measure the discharge.
The equilibrium of soil water and crop evapotranspiration
Soil-water equilibrium and crop evapotranspiration (ETc) were calculated daily with computer software (Microsoft Excel-Based) by following the procedures set out in Food and Agriculture Organization Paper 56 (Allen et al., 1998). The inputs were daily weather data, including rainfall depth, irrigation dates and quantities, initial soil moisture content at crop emergence, crop and experimental site characterization (such as the date of planting, maturity, soil parameters such as field capacity, wilting point, available water and allowable depletion during and after initial stage, maximum root depth). The calculation steps, formulas and the coefficients used in the software are:

where Kcbis the basal crop coefficient, Ke is the soil evaporation coefficient and ETo is the daily reference evapotranspiration (mm-day-1). Reference evapotranspiration was determined using the Penman-Monteith equation (Testa et al., 2011) by applying daily climatic parameters measured at a weather station within 500 m of the experimental area (Fig. 2):
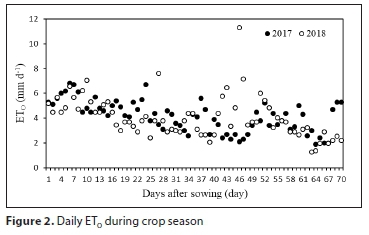
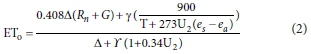
where ETo is the reference evapotranspiration (mm-day-1), Rnis the net radiation at the crop surface (MJ-m-2-day-1), G is the soil heat flux density (MJ-m-2day-1), T is the mean daily air temperature at 2 m height (°C), U2is the wind speed at 2 m height (m-s1), esis the saturation vapour pressure (kPa), eais the actual vapour pressure (kPa), e-eais the saturation vapour pressure deficit (kPa), A is the slope of the saturation vapour pressure curve (kPa-°C-1), and y is the psychometric constant (kPa-°C-1).
The applied values of Kcb for the initial, mid- and late-season stages of green bean are 0.15, 1.05 and 0.97, respectively, which represent the recommended values for a sub-humid climate (RHmin of approximately 45%) with a moderate wind speed (U2 approximately 2 m-s-1). The average evaporation coefficient (Ke) values for both growing seasons are 0.31, 1.02 and 0.35 for the initial, middle and late stages, respectively. The average KCvalues were 0.30, 1.30 and 0.35 for both growing seasons for the initial, mid- and late-season stages, respectively (Testa et al., 2011).
To guarantee full germination, 95.4 mm of irrigation water was added to all treatments at planting, with the addition of a supplementary volume of water applied 20 days after sowing to ensure full seedling growth. Subsequently, the application of irrigation treatments began in 30 days, according to the irrigation schedule treatments.
Actual crop evapotranspiration under the different irrigation treatments was estimated using the formula for soil-water equilibrium (Heermann, 1985):

where ET is the seasonal crop evapotranspiration (mm), I is the irrigation water amount (mm), P is the precipitation (mm), Cr is the capillary rise (mm), R is the runoff (mm), D is the drainage water (mm), and AS is the change in soil water storage in a given time period within the plant rooting zone (mm).
To calculate AS, gravimetric measurements were used to determine moisture content in the soil profile. The soil moisture content was monitored biweekly before irrigation for all treatments, for each 10 cm soil layer, down to 40 cm. Soil samples were taken directly beneath emitters. Both P and Cr were set at zero because there was no rainfall throughout the growing season and there was no capillary rise from the groundwater. The surface runoff value was modest because the added irrigation water was controlled by drip irrigation. When the soil moisture content in the root zone (0-40 cm) was above field capacity, the surplus water would likely percolate to the deeper soil layers as deep percolation (D). The amount of D water equals total available water at 0-40 cm soil depth before irrigation in mm + applied irrigation water in mm -soil water held in field capacity in mm (Kanber et al., 1993; Zhang et al., 2019).
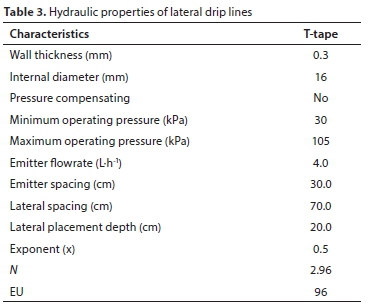
Evaluation of lateral lines
Each subplot (42 m2) consisted of 3 polyethylene lateral drip lines (16 mm in diameter and 0.3 m emitter spacing, Euro drip, Greece) with a length of 20 m. The lateral line was laid out along each green bean row at 0.7 m. The hydraulic characteristics of lateral drip lines were tested at the National Irrigation Laboratory of Agricultural Engineering Research Institute (AERI), Dokki, Giza. The water application uniformity was calculated from the coefficient of variation (v) and emission uniformity (EU) by adopting Eqs 4 and 5 (Keller and Karmeli, 1975) as follows:
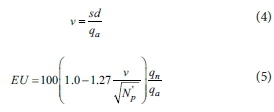
where sd is the standard deviation of emitter discharge (L-h-1); qais the average discharge of tested emitters (L-h-1), N'P is the number of emitters per plant, qnis the minimum discharge (L-h-1), and qa is the average discharge of all emitters (L-h1) (Table 3). The micro-irrigation system was rated in accordance with the standard classification of the American Society of Agricultural Engineering, which ranges from excellent to unacceptable (Smajstrla et al., 1990).
Water use efficiencies
Water use efficiency (WUE) and irrigation water use efficiency (IWUE) values were calculated according to the equations of Howell et al. (1990) as follows:
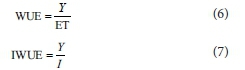
where WUE is the water use efficiency (kg-ha-1-mm-1), Y is the economic yield (t-ha-1), ET is the plant water consumption (mm), and I is the irrigation water applied (mm). Relationships between evapotranspiration data and seasonal crop productivity were extracted from field trials. The percentage of the irrigation water applied for crop evapotranspiration (Irc) was estimated for each irrigation treatment using the following equation (Ertek et al. 2004):

Water use-yield relationships and the yield response factor for green bean
Regression analysis was used to evaluate the water use-yield relationships derived from seasonal crop evapotranspiration and productivity data acquired from the field trials. The yield response factor (ky) for each irrigation interval for both growing seasons represents the relationship between relative yield reduction (1-Ya/Ym) of green bean and the relative deficit in the evapotranspiration (1-ETa/ETm), specified by using the equation of Doorenbos and Kassam (1986):

where ETa and ETm are the actual and maximum seasonal crop evapotranspiration (mm), respectively, and Yaand Ymare the corresponding actual and maximum yields (kg-ha-1).
Assessment criteria
Forty-five days after sowing, 5 plants at the harvest stage were randomly selected from each treatment for measuring vegetative criteria (plant height, leaves number per plant, fresh weight and leaves chlorophyll percentage). Mature green bean pods were harvested from the centre of 3 rows in each plot. Harvesting was performed for an area equal to 12.6 m2 (3 rows, each row a length of 6 m). The selected plants that were randomly selected from each irrigation treatment were separated individually to determine the plant dry weight.
Statistical analysis
All measurements in this study were analysed using an analysis of variance (ANOVA) appropriate for a randomized complete block split-plot design with irrigation interval as the main plot, irrigation regime as the subplots, and replicates as blocks. The mean square of the product between the irrigation interval and irrigation regime was used as the error term to test the interaction between both factors. The least significant difference (LSD) of Duncan's test was used to define statistically significant differences between average groups in the ANOVA. Probability levels lower than 0.05 were significant. All analyses were performed using the MSTAT program (MSTAT is written in the C programming language and runs on DOS compatible machines) (Freed et al., 1989). Power and linear regression analyses were performed to investigate the relationship between yield and evapotranspiration and the best relationship between yield and WUE. Regression analyses were performed using Microsoft Excel 2010.
RESULTS AND DISCUSSION
Seasonal crop evapotranspiration
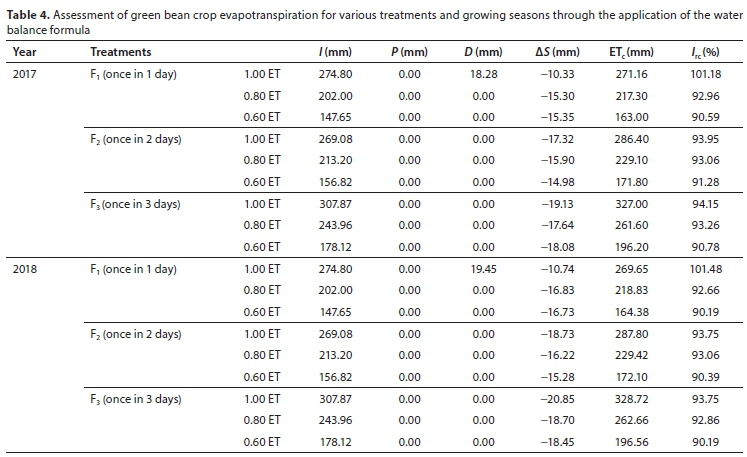
Daily evapotranspiration (ETc) of green bean ranged from 1.908.57 mm-d-1 in 2017 and 1.51-15.39 mm-d-1 in 2018 (Fig. 3). Seasonal crop ETc of green bean varied from 163 mm in F1I3 to 327 mm in F3I1 treatments in 2017 and from 164 mm in F1I3 to 328.72 mm in F3I1 treatments in 2018. During both seasons, the crop ETc values increased with both decreasing irrigation regime and decreasing interval (Table 4). Borosic et al. (2000) found that the seasonal crop evapotranspiration (ETc) of green bean was 400 mm in Zagreb. The variation in ETc values could have resulted from the varying irrigation schedules utilized and diverse climate conditions. Sezen et al. (2008) demonstrated that ETc values of green bean ranged from 253 mm to 338 mm, and they found that the seasonal crop evapotranspiration values increased with both decreasing irrigation regime and decreasing interval.

During both growing season of green beans, the ETc values were less than the amount of irrigation water applied (I) for FJ1 treatment. In addition, the D values for this treatment were lower
than for other treatments (Table 4). There are two explanations for this observation. First, the irrigation treatments, which included the addition of a large volume of water, limited the irrigation period when combined with higher irrigation frequency treatments (i.e., F1I1). The water extracted through the roots did not correspond with the volume of irrigation water applied, resulting in further deep percolation losses downward through the root zone. Secondly, we found that when green beans are cultivated in a clay loam soil, the plants extract most of the necessary water from a depth of zero to 20 cm, which is where nearly 85% of the total length of the roots of green beans is concentrated. Therefore, the moisture content of the soil in the treatment F1I1 was higher before the harvest when compared with the other treatments, and thus the deep percolation loss values were lower for other treatments (with the opposite being true for Irc).
Yield and water use efficiencies
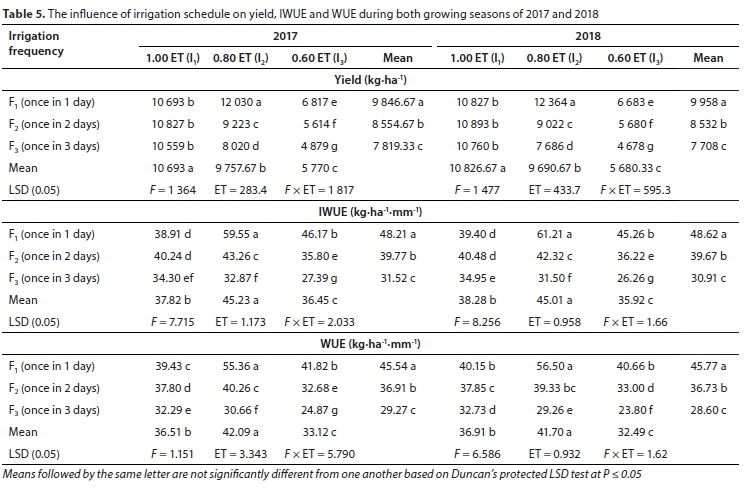
In the growth season of 2017, the maximum yield of 12 030 kg-ha-1 was obtained under the F1I2 treatment, followed by the F2I1, F1I1 and F3I1 treatments, with 10 827, 10 693, and 10 559 kg-ha-1, respectively, while the minimum yield of 4 879 kg-ha-1 was obtained under the F3I3 treatment. In the growth season of 2018, the maximum yield of 12 364 kg-ha-1 was obtained in the treatment, followed by F2I1, F1I1 and F3I1 treatments with yields of 10 893, 10 827 and 10 760 kg-ha-1, respectively, while the lowest yield of 4 678 kg-ha-1 was obtained from the F3I3 treatment (Table 5).
In both growing seasons, green bean yield decreased significantly as the irrigation interval increased (I3) for a given ETc. The F1I2 treatment realized the highest yield in both growing seasons. Thus, it is recommended that green beans be irrigated once a day using the irrigation regime at 0.80 ETc. The seasonal irrigation water requirement values for green beans in the F1I2 treatment were 217.3 and 218.83 mm for the growing seasons of 2017 and 2018, respectively. The results indicate that the yield of drip-irrigated green beans might be improved by applying a suitable irrigation schedule. Therefore, the maximum yield of F1I2 treatment can be attributed to the maintenance of enough available soil water content in the root zone without deep percolation and/or poor aeration conditions.
Irrigation water use efficiency (IWUE) values varied from a minimum of 27.39 kg-ha-1-mm-1 for the F3I3 treatment to a maximum of 59.55 kg-ha-1-mm-1 for the F1I2 treatment in the growing season of 2017. In the growing season of 2018, IWUE values ranged from a minimum of 26.26 kg-ha-1-mm-1 for the F3I3 treatment to a maximum of 61.21 kg-ha-1-mm-1 for the F1I2 treatment. The maximum and minimum of water use efficiency (WUE) in the growing season of 2017 was 55.36 kg-ha-1-mm-1 and 24.87 kg-ha-1-mm-1 for the F1I2 and F3I3 treatments, respectively. The corresponding values were 56.50 kg-ha-1-mm-1 and 23.80 kg-ha-1-mm-1 in the F1I2 and F3I3 treatments, respectively, in the 2nd season. The obtained results showed that the WUE and IWUE values increased with increased irrigation interval. In general, several factors affect the WUE, such as irrigation interval, nutritive elements, soil salinity and soil-borne diseases (Abdelaziz et al., 2019; Abuarab et al., 2019; Atia et al., 2019; El-Mogy et al., 2019; Mahmoud et al., 2019).
These results indicated that although irrigation rate is vitally important for enhancing WUEs, irrigation regime is instead often crucial for maximizing yield per unit water. This finding might be attributed to the drip irrigation interval determining the soil moisture content and its distribution with depth in the water accumulation zone that develops around the emitter and, consequently, the amount of water percolating under the root zone as well as the amount of water uptake by the roots (Assouline, 2002; Wan and Kang, 2006). Therefore, frequent low rates of irrigation (F1I2) were more effective for increasing irrigation efficiencies than were infrequent high irrigation rates (F3I1) (Table 5).
This finding is due to the F3I1 treatment realizing remarkable fluctuations in soil water in the root zone, bringing about cyclic water stress for green bean root growth before the next irrigation event, and excessive water percolation owing to the amount of water applied at each event being much higher than the soil-water storage capacity. By contrast, the F1I2 treatment appears to provide the suitable available soil water content in the root zone without water percolation.
Vegetative growth and pod parameters
All vegetative growth and pod parameters were significantly affected by the irrigation schedule (Tables 6 and 7). The highest vegetative growth parameters and yield, averaged across all irrigation treatments, were obtained when the irrigation interval is small (F1 and F2). As averaged for both seasons, the irrigation interval for treatment F3 resulted in reductions in all the vegetative growth parameters compared to the F1 treatment. These reductions were 15.82% and 25.44% of pod number per plant, 20.55% and 22.88% of pod weight per plant (Table 7), 18.60% and 29.89% of plant height, 40.57% and 44.67% of fresh weight, and 30.67% and 40.22% of dry weight, in the 1st and 2nd seasons, respectively (Table 6). In both growing seasons, 0.80 ET (I2) and 0.60 ET (I3) consistently resulted in lower yields than 1.00 ET treatments, except for F1I2, which had the highest vegetative growth parameter values for most parameters (Table 6). Boutraa and Sanders (2001) stated that water stress through the vegetative growth stage and prior to pod establishment has the largest effect on limiting green bean yield.
Yield response factor
Yield response factor specifies the decline in yield resulting from the reduction in water supply. The maximum yield (Ya) was achieved by F1I2 treatment (Table 5). The maximum ET values (ETm) were 327.0 mm and 328.72 mm for the growing season of 2017 and 2018, respectively. The correlation between the relative decrease in yield (1-Ya/Ym) and the corresponding relative deficit of evapotranspiration (1-ETa/ETm) was linear (Fig. 4) with slopes (yield response factor) of 0.8453 and 0.856 for the growing season of 2017 and 2018, respectively. Nevertheless, the diverse irrigation interval treatments had a significant impact on the yield response factor, since this was 0.50, 0.90 and 1.58 in the growing season of 2017 and 0.54, 1.00 and 1.71 in the growing season of 2018 for F1, F2 and F3 treatments, respectively.
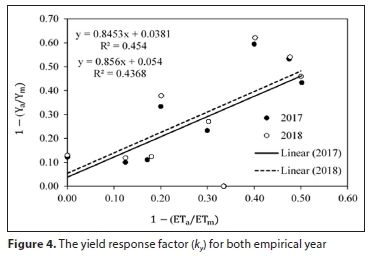
For green beans, the reduction in yield is usually proportionally greater with the increment in water deficit. The obtained yield response factor, ky, values were 0.8453 in 2017 and 0.856 in 2018 (Fig. 4), which are considered lower than those reported by Sezen et al. (2005), who found that the kyvalues were 1.15 and 1.23 in the growing season of 2017 and 2018, respectively. The kyvalues can vary greatly due to climatic changes, crop varieties, crop water management, soil characteristics and irrigation methods, and may be strongly influenced by periods of water stress occurring at critical growth stages of the crop.
Yield-seasonal crop evapotranspiration relationship
The best fitting relationship between yield and seasonal ETc was a positive power equation for the two experimental years: 2017, Y = 49.975 ETc09492 (R2 = 0.4944); 2018, Y = 38.944 ETc09859 (R2 = 0.4786) (Fig. 5). The power regression coefficients, which illustrate the increment in yield per unit increase in seasonal ETc, were 37.24 kg-mm-1 in 2017 and 37.03 kg-mm-1 in 2018. The intercepts were also very similar for both regression lines. According to the power equations, the basal seasonal ETc was necessary for initiating yield production and it was 271.16 and 269.65 mm in 2017 and 2018, respectively (270.405 mm on average). Initially, the short irrigation interval with low irrigation regime (F1I1) might indicate that the water volume absorbed by plant roots was less than the volume of water applied, resulting in increasing deep percolation. Subsequently, increasing irrigation interval with low irrigation regime (F3I1) realized a higher amount of water applied than the soil water storage capacity, leading to an increased quantity of deep percolation. In both cases, the roots did not exhaust the volume of water applied, which became deep percolation water.

The relationship between yield and water use efficiency
The data characterizing the relationship between yield and WUE were fitted to 6 distinct mathematical models: (i) linear, (ii) quadratic, (iii) cubic, (iv) logarithmic, (v) exponential, and (vi) power. However, based on the values of R2, the power equation was determined to be the best-fit model for the relationship between yield and WUE (Fig. 6). According to the power equation, the change in y in relation to x could be defined as the percentage of variation in y for each percentage of variation in x. Consequently, when yield was increased by 10%, WUE was increased by 4.7% and 5.05% for 2017 and 2018, respectively (Eqs. in Fig. 6).

For the power relationship between yield and water use efficiency (WUE), each point indicates an area, because the volume of water uptake through roots was lower when the irrigation duration was short. The maximum yield and vegetative growth parameters for F1I2 and F2I1 could result from the preservation of the ideal moisture content and soil aeration in the root zone and no deep percolation.
When the soil moisture in the root zone is saturated, the oxygen diffusion in soil pores decreases, which affects crop enzyme activity and consequently decreases crop photosynthesis (Abdelaziz and Abdeldaym, 2018). Wan and Kang (2006) reported that this phenomenon would also prohibit leaf surface area expansion. Ultimately, yield-WUE relationships are utilized for determining the ideal irrigation water management method (Chen et al., 2003). The power equation was the best fit for the obtained data with R2values of 0.4528 and 0.5077 in 2017 and 2018, respectively (Fig. 6).
Overall, the outcomes of this research indicate that the yield and WUE of green beans under drip irrigation could be improved through the ideal irrigation schedule. Furthermore, these outcomes indicate that irrigation intervals are useful for determining if the maximum yield can be acquired under adequate and restricted water applications. For example, the minimum yield and vegetative growth parameters were observed in F1I1 treatment compared to F1I2 and F2I1 treatments, where the highest yield and vegetative growth parameters were obtained, despite the higher total water volume applied for this treatment. This result might be due to the F1I1 treatment resulting in the highest soil moisture content in the effective root depth and thus more deep percolation passing the effective root zone (Fig. 5).
CONCLUSIONS
The obtained results confirmed that the irrigation schedule had a considerable effect on the yield and vegetative growth parameters of drip-irrigated green beans in Egypt. Maximum yields of 12 030 kg-ha-1 and 12 364 kg-ha-1 were obtained for the F1I2 treatment in 2017 and 2018, respectively. The results indicated that the WUE and IWUE values decreased with the decreasing irrigation interval. Further, the high-volume irrigation regime produced low total yield and low yield components. Therefore, it is recommended that a large irrigation interval with a medium irrigation regime (irrigation interval once every day at 0.80 ETc irrigation regime, F1I2 treatment) should be used for drip-irrigated green bean under El-Ayat, El-Giza Governorate conditions. Also, the power model was the best in explaining the relationship between yield and seasonal ETc for both growing seasons.
ORCID
Emad A Abdeldaym: https://orcid.org/0000-0001-6352-1784
REFERENCES
ABDELAZIZ ME, ABDELSATTAR M, ABDELDAYM EA, ATIA MA, MAHMOUD AWM, SAAD MM and HIRT H (2019) Piriformospora indica alters Na+/K+ homeostasis, antioxidant enzymes and LeNHX1 expression of greenhouse tomato grown under salt stress. Sci. Hortic. 256 (1) 108532. https://doi.org/10.1016/j.scienta.2019.05.059 [ Links ]
ABDELAZIZ ME and ABDELDAYM EA (2018) Cucumber growth, yield and quality of plants grown in peatmoss sand as affected by rate of foliar applied postassium. Bioscience. 15 (3) 2871-2879. [ Links ]
ABUARAB ME, EL-MOGY MM, HASSAN AM, ABDELDAYM EA, ABDELKADER NH and EL-SAWY M (2019) The effects of root aeration and different soil conditioners on the nutritional values, yield, and water productivity of potato in clay loam soil. Agronomy. 9 (1) 418. https://doi.org/10.3390/agronomy9080418 [ Links ]
ALLEN RG, PEREIRA LS, RAES D and SMITH M) 1998 (Crop evapotranspiration - guidelines for computing crop water requirements. FAO Irrigation and Drainage Paper 56. United Nations Food and Agriculture Organization, Rome. http://www.fao.org/docrep/x0490e/x0490e00.htm [ Links ]
ASSOULINE S (2002) The effects of microdrip and conventional drip irrigation on water distribution and uptake. Soil Sci. Soc. Am. J. 66 (5) 1630-1636. https://doi.org/10.2136/sssaj2002.1630 [ Links ]
ATIA MA, ABDELDAYM EA, ABDELSATTAR M, IBRAHIM DS, SALEH I, ELWAHAB MA, OSMAN GH, ARIF IA and ABDELAZIZ ME (2019) Piriformospora indica promotes cucumber tolerance against root-knot nematode by modulating photosynthesis and innate responsive genes. Saudi J. Biol. Sci. 27 (1) 279-287. https://doi.org/10.1016/j.sjbs.2019.09.007 [ Links ]
BOROSIC J, ROMIC D and DOLANJSKI D (2000) Growth and yield components of dwarf french bean grown under irrigation conditions. Acta Hortic. 533 (1) 451-460. https://doi.org/10.17660/ActaHortic.2000.533.56 [ Links ]
BOUTRAA T and SANDERS FE (2001) Influence of water stress on grain yield and vegetative growth of two cultivars of bean (Phaseolus vulgaris L.). J. Agron. Crop. Sci. 187 (4) 251-257. https://doi.org/10.1046/j.1439-037X.2001.00525.x [ Links ]
CHEN C, PAYNE WA, SMILEY RW and STOLTZ MA (2003) Yield and water-use efficiency of eight wheat cultivars planted on seven dates in Northeastern Oregon. J. Agron. 95 (1) 836-843. https://doi.org/10.2134/agronj2003.8360 [ Links ]
ÇOLAK YB, YAZAR A, GÖNEN E and EROGLU EÇ (2018) Yield and quality response of surface and subsurface drip-irrigated eggplant and comparison of net returns. Agric. Water Manage. 206 (1) 165175. https://doi.org/10.1016/j.agwat.2018.05.010 [ Links ]
COYAGO-CRUZ E, MELÉNDEZ-MARTÍNEZ AJ, MORIANA A, GIRÓN IF, MARTÍN-PALOMO MJ, GALINDO A, LÓPEZ-PÉRE D, TORRECILLAS A, BELTRÁN-SINCHIGUANO E and CORELL M (2019) Yield response to regulated deficit irrigation of greenhouse cherry tomatoes. Agric. Water Manage. 213 (1) 212-221. https://doi.org/10.1016/j.agwat.2018.10.020 [ Links ]
DOORENBOS J and-KASSAM AH (1986) Yield response to water. Irrigation and Drainage Paper 33. http://www.fao.org/3/i2800e/i2800e.pdf (Accessed 18 March 2019). [ Links ]
EL-HENDAWY SE, EL-LATTIEF EAA, AHMED MS and SCHMIDHALTER U (2008) Irrigation rate and plant density effects on yield and water use efficiency of drip-irrigated corn. Agric. Water Manage. 95 (7) 836-844. https://doi.org/10.1016/j.agwat.2008.02.008 [ Links ]
EL-MOGY MM, SALAMA AM, MOHAMED HFY, ABDELGAWAD KF and ABDELDAYM EA (2019) Responding of long green pepper plants to different sources of foliar potassium fertiliser. Agriculture (Polnohospodárstvo). 65 (2) 59-76. https://doi.org/10.2478/agri-2019-0007 [ Links ]
EL-HENDAWY SE and SCHMIDHALTER U (2010) Optimal coupling combinations between irrigation frequency and rate for drip-irrigated maize grown on sandy soil. Agric. Water Manage. 97 (3) 439-448. https://doi.org/10.1016/j.agwat.2009.11.002 [ Links ]
ERTEK A, ÇENSOY S, KÜÇÜKYUMUK C and GEDIK I (2004) Irrigation frequency and amount affect yield components of summer squash (Cucurbita pepo L.). Agric. Water Manage. 67 (1) 63-76. https://doi.org/10.1016/j.agwat.2003.12.004 [ Links ]
FERERES E and SORIANO MA (2007) Deficit irrigation for reducing agricultural water use. J. Exp. Bot. 58 (4) 147-159. https://doi.org/10.1093/jxb/erl165 [ Links ]
FREED R, EISENSMITH SP, GOETZ S, REICOSKI K, SMAIL VW and WOLBERG P (1989) A microcomputer programme for the design, management and analysis of agronomic research experiments. In: MSTAT-C Users Guide. Michigan State University, East Lansing, MI., USA. [ Links ]
HEERMANN DF (1985) ET in irrigation management. In: National Conference on Advances in Evapotranspiration, 16-17 Dec 1985, Chicago. American Society of Agricultural Engineers. 323-334. [ Links ]
HERGERT GW, MARGHEIM JF, PAVLISTA AD, MARTIN DL, SUPALLA RJ and ISBELL TA (2016) Yield, irrigation response, and water productivity of deficit to fully irrigated spring canola. Agric. Water Manage. 168 (1) 96-103. https://doi.org/10.1016/j.agwat.2016.02.003 [ Links ]
HOWELL TA, CUENCA RH and SOLOMON KH (1990) Crop yield response. In: Management of Farm Irrigation Systems. American Society of Agricultural Engineers, St. Joseph, MI. 93-122. [ Links ]
ISTANBULLUOGLU A (2009) Effects of irrigation regimes on yield and water productivity of safflower (Carthamus tinctorius L.) under Mediterranean climatic conditions. Agric. Water Manage. 96 (12) 1792-1798. https://doi.org/10.1016/j.agwat.2009.07.017 [ Links ]
KANBER R, YAZAR A, ÖNDER S and KÖKSAL H (1993) Irrigation response of Pistachio (Pistacea vera L). Irrig. Sci. 14 7-14. https://doi.org/10.1007/BF00195000 [ Links ]
KELLER J and KARMEL ID (1975) Trickle irrigation design parameters. Trans. Am. Soc. Agric. Eng. 17 (4) 678-684. https://doi.org/10.13031/2013.36936 [ Links ]
MAHMOUD AWM, ABDELAZIZ SM, EL-MOGY MM and ABDELDAYM EA (2019) Effect of foliar ZnO and FeO nanoparticles application on growth and nutritional quality of red radish and assessment of their accumulation on human health. Agriculture (Polnohospodárstvo) 65 (1) 16-29. https://doi.org/10.2478/agri-2019-0002 [ Links ]
PATANÈ C and COSENTINO SL (2010) Effects of soil water deficit on yield and quality of processing tomato under a Mediterranean climate. Agric. Water Manage. 97 (1) 131-138. https://doi.org/10.1016/j.agwat.2009.08.021 [ Links ]
SEZEN SM, YAZAR A, CANBOLAT M, EKER S and CÇLIKEL G (2005) Effect of drip irrigation management on yield and quality of field grown green beans. Agric. Water Manage. 71 (3) 243-255. https://doi.org/10.1016/j.agwat.2004.09.004 [ Links ]
SEZENS M, YAZAR A, AKYILDIZ A, DASGAN HY and GENCEL B (2008) Yield and quality response of drip irrigated green beans under full and deficit irrigation. Sci. Hortic. 117 (2) 95-102. https://doi.org/10.1016/j.scienta.2008.03.032 [ Links ]
SMAJSTRLA AG, BOMAN BJ, HAMAN DZ, PITTS DJ and ZAZUETA FS (1990) Field evaluation of micro irrigation water application uniformity. Florida Cooperative Extension Service, Institute of Food and Agricultural. https://edis.ifas.ufl.edu/pdffiles/AE/AE09400.pdf (Accessed 24 August 2020). [ Links ]
SPEARS TD (2003) Irrigating efficiently to feed the world in 2050. In: Proceedings of the 2003 Irrigation Association International Exposition And Technical Conference, USA. The Irrigation Association, Falls Church, VA. 411-422. [ Links ]
TESTA G, GRESTA F and COSENTINO SL (2011) Dry matter and qualitative characteristics of alfalfa as affected by harvest times and soil water content. Eur. J. Agron. 34 (3) 144-152. https://doi.org/10.1016/j.eja.2010.12.001 [ Links ]
UÇAN K, KILLI F, GENÇOGLAN C and MERDUN H (2007) Effect of irrigation frequency and amount on water use efficiency and yield of sesame (Sesamum indicum L.) under field conditions. Field Crops Res. 101 (3) 249-258. https://doi.org/10.1016/j.fcr.2006.11.011 [ Links ]
VWIOKO ED, EL-ESAWI MA, IMONI ME, AL-GHAMDI AA, ALI HM, EL-SHEEKH MM, ABDELDAYM EA and AL-DOSARY MA (2019) Sodium azide priming enhances waterlogging stress tolerance in okra (Abelmoschus esculentus L.). Agronomy. 9 (11) 679. https://doi.org/10.3390/agronomy9110679 [ Links ]
WAN S and KANG Y (2006) Effect of drip irrigation frequency on radish (Raphanus sativus L.) growth and water use. Irrig. Sci. 24 161-174. https://doi.org/10.1007/s00271-005-0005-9 [ Links ]
ZHANG G, SHEN D, MING B, XIE R, JIN X, LIU C, HOU P, XUE J, CHEN J, ZHANG W, LUI W, WANG K and LI S (2019) Using irrigation intervals to optimize water-use efficiency and maize yield in Xinjiang, northwest China. Crop J. 7 (3) 322-334. https://doi.org/10.1016/j.cj.2018.10.008 [ Links ]
 Correspondence:
Emad A Abdeldaym
Email: emad.abdeldaym@agr.cu.edu.eg
Received: 17 November 2019
Accepted: 17 August 2020

