


Services on Demand
Article
 English (pdf)
 Article in xml format
 Article references
Indicators

Related links
-
 Cited by Google
 -
 Similars in Google
Share

 Permalink
Water SA
On-line version ISSN 1816-7950
Print version ISSN 0378-4738
Water SA vol.46 n.4 Pretoria Oct. 2020
http://dx.doi.org/10.17159/wsa/2020.v46.i4.9068
RESEARCH PAPER
Assessment of satellite-derived rainfall and its use in the ACRU agro-hydrological model
S SulemanI, II; KT ChettyI; DJ ClarkI; E KapangaziwiriII
ICentre for Water Resources Research, Hydrology Discipline, School of Agricultural, Earth and Environmental Sciences, University of KwaZulu-Natal, Pietermaritzburg, South Africa
IIHydrosciences Research Group, Natural Resources and the Environment, Council for Scientific and Industrial Research, South Africa
ABSTRACT
Unfortunately, for various reasons, in-situ rain gauge networks are diminishing, especially in southern Africa, resulting in sparse networks whose records give a poor representation of rainfall occurrence, patterns and magnitudes. Hydrological models are used to inform decision making; however, model performance is directly linked to the quality of input data, such as rainfall. Therefore, the use of satellite-derived rainfall is being increasingly advocated as a viable alternative or supplement. The aim of this study was to evaluate the representativeness of satellite-derived rainfall and its utility in the ACRU agro-hydrological model to simulate streamflow magnitudes, distributions and patterns. The satellite-derived rainfall products selected for use in this study were TRMM3B42, FEWSARC2.0, FEWSRFE2.0, TAMSAT 3.0 and GPM-IMERG4. The satellite rainfall products were validated against available historical observed records and then were used to drive simulations using the ACRU agro-hydrological model in the upper uMngeni, upper uThukela and upper and central Breede catchments in South Africa. At the daily timescale, satellite-derived and observed rainfall were poorly correlated and variable among locations. However, monthly, seasonal and yearly rainfall totals and simulated streamflow volumes were in closer agreement with historical observations than the daily correlations; more so in the upper uMngeni and uThukela than in the upper and central Breede (e.g. FEWSARC2.0 and FEWSRFE2.0, producing relative volume errors of 3.18%, 4.63%, -5.07% and 2.54%, 9.54%, -1.67%, respectively, at Gauges V2E002, 0268883 and 02396985). Therefore, the satellite-derived rainfall shows promise for use in applications operating at coarser temporal scales than at finer daily ones. Complex topographical rainfall generation and varying weather systems, e.g. frontal rainfall, affected the accuracy of satellite-derived product estimates. This study focused on utilising the wealth of available raw satellite data; however, it is clear that the raw satellite data need to be corrected for bias and/or downscaled to provide more accurate results.
Keywords: ACRU, satellite-derived rainfall, hydrological modelling
INTRODUCTION
Many parts of southern Africa are water-scarce. Sustainable management and decision making based on factual information are important to achieve optimum benefit from this precious resource. Therefore, understanding the spatial and temporal variations of rainfall is important. Rainfall is traditionally measured through the use of in-situ rain gauges. Unfortunately, for various reasons rain gauge networks are diminishing, especially in southern Africa. This has resulted in sparse networks whose observed records give a poor representation of rainfall occurrence, patterns and magnitudes. For many decades now, environmental models have been used as practical tools that can generate information used for management decision making and development scenarios. However, hydrological models are driven by rainfall and other inputs and their performance is thus directly linked to the quality of these input data. Consequently, the use of other sources of rainfall data beyond those from the traditional in-situ observation stations, such as satellite-derived products, is being increasingly advocated as a viable alternative (Sawunyama and Hughes, 2008). Many remotely sensed satellite-derived rainfall products are available which produce rainfall estimates at various spatial and temporal scales. The advantage of such observations is that they offer a larger geographical coverage with substantially greater amounts of data than those that are accessible through the use of in-situ methods (Jarmain et al., 2009; Xu et al., 2014; Amekudzi et al., 2016). Satellite-derived data are also updated more frequently and consistently, are usually freely available and relatively easier to access, which could enhance their use (Van Dijk and Renzullo, 2011; Xu et al., 2014). Most satellite-derived rainfall products use rain-gauge measurements in their algorithms to reduce errors such as bias. They are merged using quantitative rainfall information from rain gauges and the spatially continuous information obtained from the satellite observations.
However, in spite of the availability and accessibility of satellite-derived data, there is little evidence of the wide and consistent uptake of this valuable source of information in water resource management (Van Dijk and Renzullo, 2011). There are a number of challenges in the use of satellite-derived data in water resource management, chief among which include technological barriers required to process the satellite data and the lack of knowledge on integrating these data into available applications (Van Dijk and Renzullo, 2011; Xu et al., 2014; Ciabatta et al., 2015). Furthermore, the main focus of utilising satellite-derived rainfall within the scientific community has been for validation studies to eventually obtain guidelines for the use of specific products in specific regions, due to product performance varying in different locations (Ciabatta et al., 2015). The majority of rainfall product validation has not occurred in Africa and, specifically, southern Africa. Utilisation of satellite-derived data in hydrological models shows promise. However, only a minority of literature focuses on the use of satellite-derived rainfall incorporation into hydrological models in Africa and, more specifically, South Africa (e.g. Grimes and Diop, 2003; Hughes, 2006; Sawunyama and Hughes, 2008; Cohen Liechti, 2012; Li et al, 2012; Tirivarombo, 2012; Vilanculos, 2015). The prediction uncertainty in models related to input data needs to be reduced in order to improve results of model simulations and represent reality. The use of satellite-derived rainfall estimates in the Agricultural Catchments Research Unit (ACRU) agro-hydrological model (Schulze, 1975; 1983; Schulze and Smithers, 2004) has not been extensively studied and Clark (2015, 2017a,b) offers the only reported work on the incorporation of such estimates in the model. Thus, the overall aim of this study was to evaluate satellite rainfall estimates against in-situ historical rain gauge measurements and to use them to drive the ACRU model to simulate streamflow. The study focused on utilising raw satellite data produced by the products with no further data corrections being undertaken to test their applicability, utility and resilience in hydrology and water resources management.
METHODOLOGY
Selected study catchments
The upper uMngeni, upper uThukela catchments (located in eastern South Africa in the KwaZulu-Natal Province) and the upper and central Breede catchment (in south-western South Africa in the Western Cape Province) were selected as study sites (Fig. 1). These study sites were chosen because the uMgeni and uThukela catchments are located in a summer rainfall region and the Breede catchment is located in a winter rainfall region, thus experiencing contrasting climates and rainfall-generating mechanisms.

Upper uMngeni catchment
The uMngeni River rises in the Midlands region ofthe KwaZulu-Natal Province and has its mouth at Durban where it empties into the Indian Ocean, draining an area of about 4 400 km2. The Msunduzi River, which passes through the KwaZulu-Natal capital, Pietermaritzburg, is one prominent tributary of the uMngeni, with their confluence occurring between the large dams of Nagle and Inanda. The altitude of the upper uMngeni catchment ranges from 2 000 m in the western to 500 m in the eastern parts. The upper uMngeni catchment is located in a summer rainfall region with a sub-humid climate, with the majority of rainfall occurring from October to March. The mean annual precipitation (MAP) varies from 700 mm-yr-1 in the middle reaches of the catchment to 1 550 mm-yr-1 in the west, and is apparently influenced by the relief variation (Warburton et al., 2010). Temperature is influenced by both distance from the ocean and the relief, and mean annual temperatures range from 20°C nearer the ocean to 12°C in the escarpment areas. The mean annual potential evaporation of the catchment ranges from 1 567 mm to 1 737 mm (Warburton et al., 2010).
Upper uThukela catchment
The uThukela (Tugela) River is the largest river in the KwaZulu-Natal Province. The uThukela catchment has its source in the Mont-aux-Sources of the Drakensberg Mountains (same source region of the two other major South African rivers, the Orange and the Vaal) and drains an area of about 29 000 km2 before it flows into the Indian Ocean. The uThukela has a number of tributaries arising in the Drakensberg mountain range, the largest being the Mzinyathi River, and including the Little Tugela, Klip, Mooi, Blood, Sundays, Ingagani and Bushman Rivers. Altitude in the upper catchment ranges from 3 451 m in the west to 474 m in the east. The uThukela catchment is located in a summer rainfall region with a sub-humid climate, with the majority of rainfall occurring from October to March. The MAP ranges from
2 000 mm-yr-1 in the west to 500 mm-yr-1 in the central parts of the catchment, with mean annual temperatures ranging between 24°C and 12°C and mean potential evapotranspiration between 1 600 mm and 2 000 mm (Andersson et al., 2011).
Upper and central Breede catchment
The Breede River, formed by the joining of the Titus and Dwars Rivers, is located in the Western Cape Province of South Africa. The upper part of the catchment is in the Skurweberg mountain range close to the town of Ceres. The headwaters then flow through the Mitchells Pass before plaining out on its middle course in the neighbourhood of the town ofWorcester. The Breede River mouth is in an estuary at Port Beaufort on the Indian Ocean. The most prominent tributaries of the Breede River include the Holsloot, Smalblaar, Hex, Slang, Buffeljags and the Riviersonderend Rivers. In the upper and central Breede catchment altitude varies considerably, from 2 300 m to 200 m, with abrupt steep mountains and flat plains. The Breede River catchment experiences a Mediterranean climate with winter rainfall between April and August. The mountainous regions located in the south-west of the catchment experience an MAP of 2 000 mm-yr-1, while the central and north-eastern areas experience an MAP of 250 mm-yr-1. Mean annual temperatures range from 20°C to 8°C.
Satellite-derived rainfall products
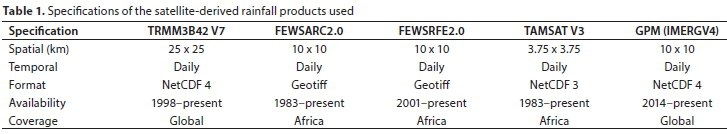
Satellite-derived rainfall products were chosen based on temporal (daily preferred) and spatial (the finest preferred) resolution, product latency, coverage of study areas and cost of acquisition (free products preferred). The Tropical Rainfall Measuring Mission 3B42 (TRMM3B42), Global Precipitation Mission (GPM-IMERG4), Tropical Applications of Meteorology Using Satellite Data and Ground-Based Observations (TAMSAT version 3), Famine Early Warning Systems Rainfall Estimator (FEWSRFE2.0) and the Famine Early Warning Systems African Rainfall Climatology (FEWSARC2.0) were evaluated in this study (Table 1). As a result of the GPM data only being released from March 2014 onward, the analyses of the products in relation to GPM were done from this date to either 30 April 2017 or 30 September 2016, for the product validation and hydrological simulations, respectively. The end date of the hydrological simulations was determined by the availability of historical observed evaporation records. TRMM3B42 (Kummerow et al., 1998; Huffman et al., 2010), FEWSARC2.0 (Novella and Thiaw, 2013), FEWSRFE2.0 (Xie and Arkin, 1996), TAMSAT3 (Tarnavsky et al., 2014) and GPM (Huffman et al., 2014) utilise rain gauge measurements for corrections, such as bias, to satellite data. Therefore, no further corrections were made to the satellite data.
Historical observations of rainfall and streamflow
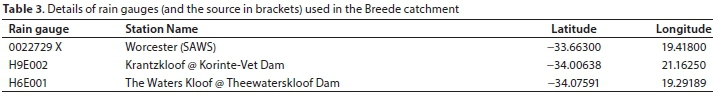
Daily rain gauge observations were essential for use in the satellite-derived products validation part of the study, as well as to drive the ACRU model. These data were obtained from the Department of Water and Sanitation (DWS) of South Africa and the South African Weather Service (SAWS).
The data for the period 1 January 2010 to 30 April 2017 were used in the satellite-derived rainfall validation part of the study. The dates selected for the validation component study were based on the existence of a common period with the best quality (i.e. fewer missing data in the observed records) of data across all available rain gauges (Table 2 and 3; Fig. 2) in operation throughout the study period.
Configuration of the ACRU model
The ACRU agro-hydrological model version 4 (Schulze, 1995; Schulze and Smithers, 2004) was used in this study. The ACRU model is a daily time-step, multilevel, physical-conceptual and multi-purpose model that was developed by the School of Bio-resources Engineering and Environmental Hydrology (BEEH) at the University of KwaZulu-Natal, South Africa (Warburton et al., 2010). A list of studies where the ACRU model has been extensively utilised in southern Africa is provided by Warburton et al. (2010). The ACRU model configuration used for the upper uMngeni catchment was obtained from Clark (2015), while those for the upper uThukela and upper and central Breede catchments were, respectively, from Clark (2017a; 2017b).
In this study the ACRU model was driven by both the satellite-derived rainfall estimates as well as in-situ observed historical rain gauge measurements, as in the traditional approach, and the results were compared for the two input data types and with available observed historical streamflow records obtained from DWS (Table 4, Fig. 2). The modelling time period was also influenced by the availability of reference evaporation data (a model input), which were supplied by the Satellite Applications Hydrology Group (SAHG) at the University of KwaZulu-Natal (http://sahg.ukzn.ac.za/soil_moisture/et). The data are available for the period 2007 to 2017. Catchment rainfall estimates were derived from the remotely sensed rainfall data in raster format by calculating an area-weighted average of the rainfall pixels that completely or partly overlapped each individual catchment. The model simulation period was 1 October 2007 to 30 September 2016. Performance statistics were calculated to evaluate the simulated streamflows based on the different rainfall products and rain gauges. However, the performance statistics presented in this paper only include bias, relative volume error percentage (RVE%), coefficient of determination (R2) and the Nash-Sutcliffe efficiency (NSE). The equations are presented below:
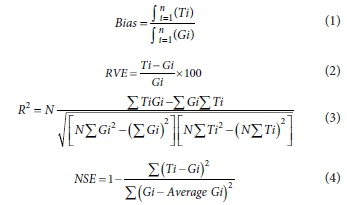
where Gi = gauge measurements, Ti = satellite-derived estimates, N = number of observations
RESULTS AND DISCUSSION
Validation of satellite-derived rainfall products
The upper uMngeni and upper uThukela catchments are analysed together because the catchments border one another, are both located in a summer rainfall region and therefore have similar rainfall regimes.
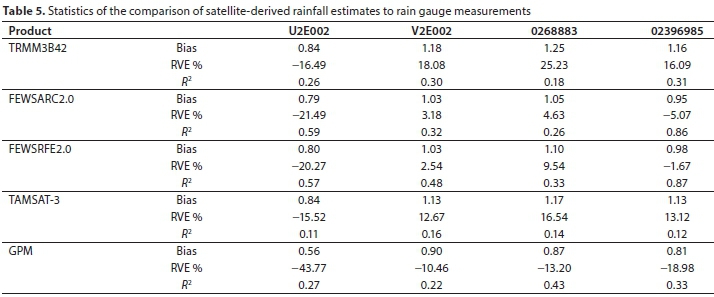
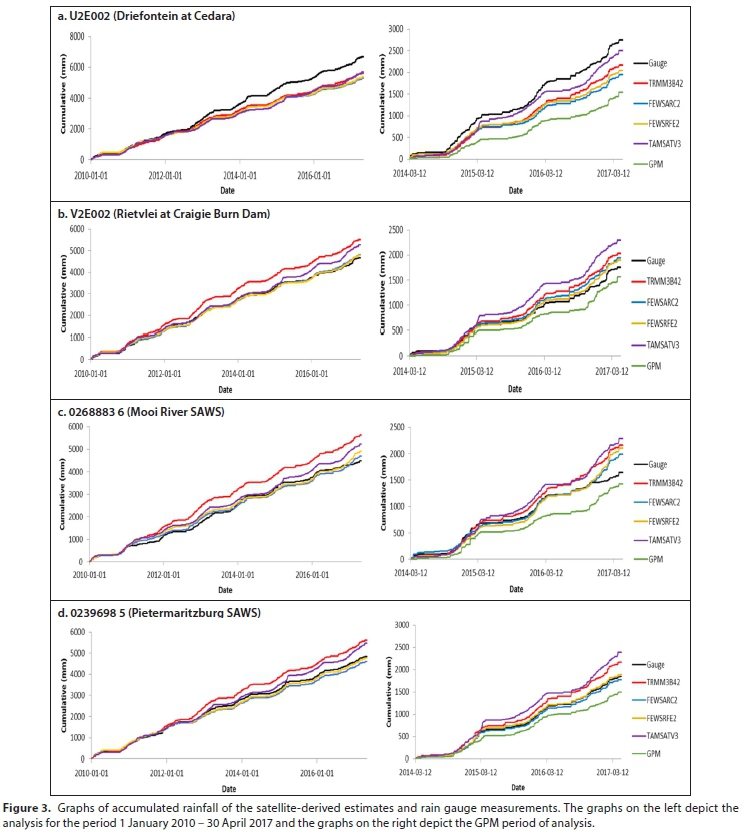
Satellite-derived rainfall estimates were variable at each location. No definite trends seem to exist among the products when compared to rain gauge measurements at the daily scale, where products indicated some sort of bias through either overestimating or underestimating daily rainfall magnitudes (Table 5). Apart from both FEWS products at Gauge 02396985, the daily correlations between gauge measurements and satellite estimates were poor, with R2 values below 0.60. TAMSAT3 produced the poorest daily correlation with R2 values below 0.20. Both FEWS products produced the closest daily correlations with the gauges, with R2values higher than that achieved by the other satellite-derived products (Table 5). Cumulative rainfall plots (Fig. 3a-d) show that the products are in closer agreement with rain gauge measurements only at a monthly, seasonal and yearly scale. This was because products would either overestimate or underestimate at a daily level and these effects would be masked over longer time periods. Total volume correlations between the satellite-derived rainfall estimates and observed gauge measurements were in closer agreement. The FEWS products produced the closest agreement with rain gauge totals with RVE% of 3.18 and 2.54% at V2E002, 4.63 and 9.54% at 0268883 and -5.07 and -1.67% at 02396985 for FEWSARC2.0 and FEWSRFE2.0, respectively.
All satellite-derived products underestimated rainfall at Gauge U2E002 with GPM underestimating the most (-43.77 %) and TAMSAT3 the least, with an RVE% of 15.52%.
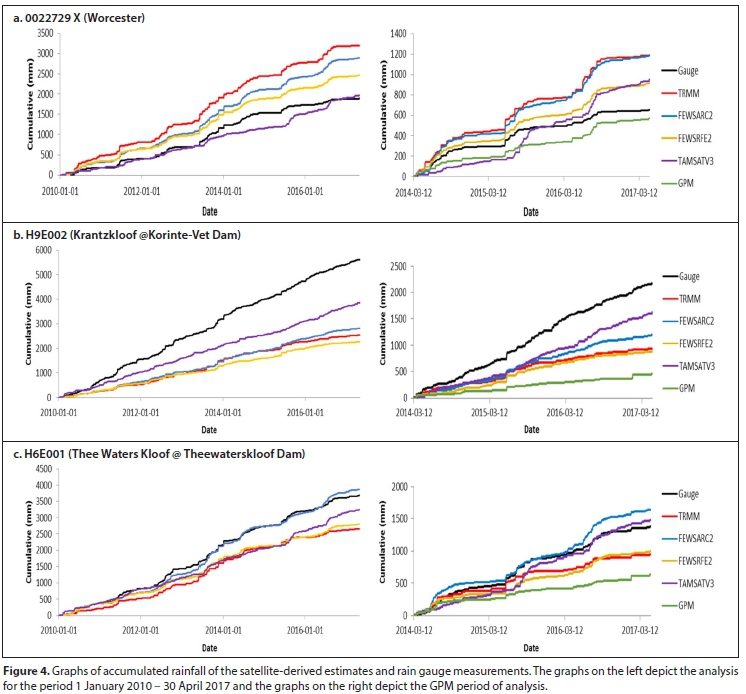
Satellite-derived rainfall estimates were variable at each location in the Breede. No definite trends seem to exist among the products when compared to rain gauge measurements at the daily scale, where products indicated some sort of bias through either overestimating or underestimating daily rainfall magnitudes (Table 6). FEWSARC2.0 and FEWSRFE2.0 produced the closest daily correlation with gauge measurements, with R2values of 0.70 and 0.69, respectively, at Gauge 022729X. However, daily correlations were poor and achieved R2 values below 0.55 at Gauges H2E003 and H6E001. TAMSAT3 produced poor correlations with gauges measurements, with R2values below 0.04. Cumulative rainfall plots shown in Fig. 4a-c show that the products are in closer agreement with rain gauge measurements only at a monthly, seasonal and yearly scale, but less so when compared to the upper uMngeni and upper uThukela. All of the satellite-derived products underestimated rainfall at Gauge H2E003 with RVE% of -33.85, -53.12, -55.49, -43.18 and -62.56% for TRMM3B42, FEWSARC2.0, FEWSRFE2.0, TAMSAT3 and GPM, respectively.

Apart from GPM, all products overestimated rainfall at Gauge 0022729X, with TRMM3B42 overestimating the most (69.28%). TAMSAT-3 produced the closest volume correlation with RVE% of 4.52 and -11.66% at Gauges 0022729X and H6E001, respectively, even though the daily correlations were the poorest. This is attributed to the product inaccurately estimating rainfall at the daily scale, but with masking of these effects at longer time intervals.
The satellite-derived rainfall estimates produced inconsistent results when compared to rain gauges across all three study sites. The phase difference between rain gauge data and the various remotely sensed datasets is one source of error, not for volumes but for poor daily correlation, where gauge rainfall and satellite-derived rainfall datasets represent 24-h periods starting at different times. The satellite-derived rainfall estimates were in better statistical agreement to rain gauge measurements in the upper uMngeni and upper uThukela than in the Breede region. This could be attributed to the satellite products' ability to estimate rainfall from convective mechanisms which are the dominant rainfall mechanisms of the upper uMngeni and upper uThukela region (Thorne et al., 2001). Cold Cloud Temperatures (CTT) and Cold Cloud Duration (CDD) are utilised as inputs in all of the satellite rainfall products' algorithms utilised in this study (e.g. the FEWS products obtain CTT and CDD from EUMETSAT's Meteosat). The CTT inputs are more effective in estimating rainfall from convective systems and less so for frontal or orographic regimes (Thorne et al., 2001). The upper Breede catchment rainfall is highly influenced by the warm Indian Ocean and cold Atlantic Ocean air masses (Bangira et al., 2015), which often meet along the Western Cape coast resulting in convergence and frontal rainfall. Thus, this mechanism of rainfall development seems to influence the accuracy of the satellite rainfall estimates (Thorne et al., 2001; Maidment et al., 2017). Orographic rainfall regimes caused by topographical gradients, especially in the upper Breede catchment, are not well captured by the satellite's retrieval algorithms. Warm clouds produced by orographic mechanisms are associated with high rainfall totals. However, these are not captured by CDD and CTT, which may explain the poor fit of results in this region (Thorne et al., 2001; Maidment et al., 2017). Rain gauge measurements do not account for the spatial variations of topography, whereas satellite-derived rainfall does not account for the estimation errors caused by different rainfall regimes (Hughes, 2006; Kimani et al., 2017). Polar orbits, field-view of sensors, uncertainty of retrieval algorithms and sampling frequency are factors that affect the accuracy of satellite-derived rainfall estimation (Amekudzi et al., 2016). The satellite-derived rainfall products utilise rain gauge inputs to calibrate the satellite-derived data. Absence of rain gauges and quality of measurements affect the accuracy of rainfall estimates produced.
Streamflow simulations with the ACRU model
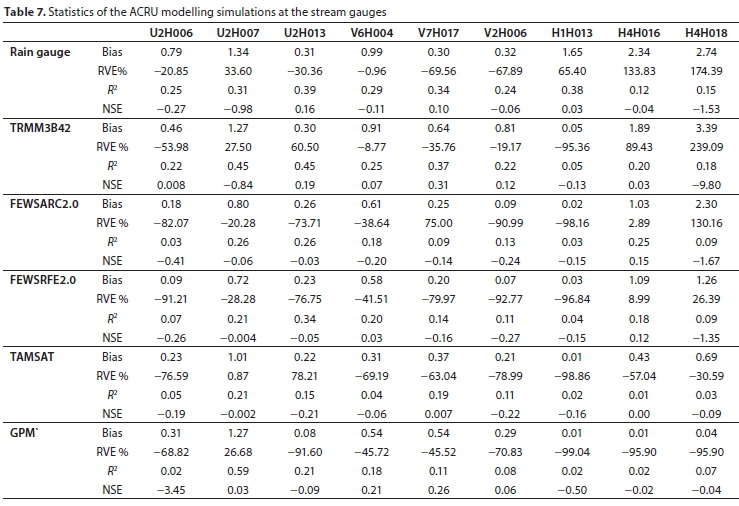
Simulations of streamflow were poor and variable across all three study sites. Daily correlations between observed streamflow and simulated streamflow were poor, with the coefficient of determination, R2, values all below 0.50. Apart from Gauge H4H016, rain gauge and TRMM3B42 driven simulations produced the closest daily correlations with streamflow gauge observations. Total streamflow volumes simulated in the upper uMngeni were variable amongst simulations with RVE% ranging from -91.60% (GPM at U2H013) to 78.21% (TAMSAT-3 at U2H013). TRMM3B42 driven simulations outperformed the other simulations in the upper uThukela catchments, achieving RVE%'s of -8.77%, -35.76% and -19.17% at Gauges V6H006, V7H017 and V2H006, respectively. Streamflow simulations driven by rain gauges, TRMM3B42 and both FEWS satellite products overestimated streamflow at Gauges H4H016 and H4H018 in the upper and central Breede catchments with RVE% values of 133.83, 174.39, 89.43, 239.09, 2.89, 130.16, 8.99, 26.39%, respectively (Table 7, Fig. 5a-i). Simulations driven by both FEWS products outperformed those by the other products in terms oftotal streamflow volumes in the upper and central Breede catchments, while the TRMM3B42 driven simulations outperformed the others in the uThukela catchment. The satellite rainfall products considerably underestimated streamflow at Gauge H1H013, with bias values ranging from 0.01 (TAMSAT-3 and GPM) to 0.05 (TRMM3B42); R2values ranging from 0.02 (TAMSAT-3 and GPM) to 0.05 (TRMM3B42); and RVE% from -99.04% (GPM) to 95.36% (TRMM3B42) (Table 7). The rain gauge driven simulation outperformed the product driven simulations at this gauge.
The relationship between simulated streamflow and weir gauge data was generally poor and variable, with TRMM3B42 producing the lowest NSE value of -9.80 at Gauge H4H018. TRMM3B42 produced the highest NSE value of 0.31 at Gauge V7H017. The upper Breede catchment involves complex topography and the products poorly estimate rainfall generated in this area, as they may be unable to accurately estimate rainfall from the rainfall-generating mechanisms in this area, as mentioned previously. Rain gauges neglect the spatial variations of rainfall in terms of topography (Hughes et al., 2006) which may also explain the poor rain gauge driven streamflow results, especially in the Breede region which involves complex topography. There may be phase errors in the simulated runoff due to not routing flows down the main river reaches in ACRU, which could also affect the daily correlations. However, the poor estimation of rainfall volumes far outweighs the phasing errors.
The sparse network of rain gauges in the catchments meant that the rain gauges used to represent the sub-catchments were not necessarily in or close to the sub-catchments. Therefore, a precipitation correction factor had to be calculated and applied to the rain gauge data to represent the rainfall in those sub-catchments with similar elevation and MAP. Uncertainty arises as sub-catchments are driven with rain gauge measurements that are not entirely representative of the area; however, it is the reality that practitioners are faced with diminishing in-situ networks. Streamflow gauge data also contain inaccuracies, especially in operational catchments where the catchments are far from 'natural, with many upstream anthropogenic influences (e.g. abstractions) which are rarely documented accurately, as found in Sawunyama and Hughes (2008). The use of the raw satellite-derived rainfall with larger spatial coverage over the catchments produced some considerable under- or over-estimations of streamflows. Consequently, bias for in-situ rain gauges is expected to be smaller than that in satellite-derived estimates (Nicholson et al., 2003). Satellite rainfall products spatially average rainfall over the whole pixel to produce a pixel estimate. Rainfall variations are therefore neglected within the pixel area and, in particular, the effects of topography on rainfall, which can have a great influence on the rainfall, are also often ignored. There is therefore a substantial amount of uncertainty.
CONCLUSIONS
Understanding the spatial and temporal variations of the rainfall input are important to achieve effective water resource management. Rainfall is traditionally measured through the use of in situ rain gauges. However, for various reasons, that include availability of the requisite financial resources, rain gauge networks are sparse in almost all developing countries, which implies poor spatial and temporal representation by available rainfall records. Hydrological models, driven by rainfall, are used to generate information for management and policy decision making and the quality of their outputs are reliant on the quality of rainfall inputs to the model. The ease of access, availability, cost-effectiveness and larger geographical coverage have made remotely sensed satellite-derived rainfall a viable option for use in water resource management. Thus, this study aimed at validating a selected group of satellite-derived rainfall estimates against in-situ observed historical measurements and then to use such estimates as inputs to drive the ACRU hydrological model to simulate streamflow.
The satellite-derived products evaluated in this study included the Tropical Rainfall Measuring Mission 3B42 (TRMM3B42), Global Precipitation Mission (GPM), Tropical Applications of Meteorology Using Satellite Data and Ground-Based Observations (TAMSAT version 3), Famine Early Warning Systems Rainfall Estimator (FEWSRFE2.0) and the Famine Early Warning Systems African Rainfall Climatology (FEWSARC2.0). The products' performances were evaluated in the upper uMngeni, upper uThukela and upper and central Breede catchments, which were chosen to represent different climatic conditions.
The performance of the satellite-derived products was highly variable at each location. The study discovered that these products tended to poorly represent rainfall magnitudes at the daily time scale, producing poor correlations with observed rain gauge data, and more so in the Breede catchment than in the uMngeni and uThukela catchments. The FEWS products provided the closest daily correlations with observed rainfall when compared to the other products evaluated. Of interest, however, is the observation that, in spite of the results at the daily time scale, total estimated rainfall volumes over the period of analysis were in better statistical agreement with total observed rainfall.
The simulations of streamflow driven by both the satellite-derived products and in-situ rain gauge measurements also produced variable and generally poor results. Comparisons of simulated daily and observed stream flows were poor (i.e. R2of less than 0.5) across all the study sites, while the simulations driven by in-situ rain gauge and TRMM3B42 often produced the closest agreement with observed data (e.g. R2 values of 0.39 for rain gauge and 0.45 for TRMM3B42 driven simulations at gauge U2H013).
Total estimated volumes of simulated streamflow were, however, in better agreement with total observed streamflow than the daily correlations (e.g. RVE% for TRMM3B42 of -8.77% at V6H004, -19.17% at V2H006; for FEWSARC2.0 and FEWSRFE2.0 of-20.28 and -28.28% at U2H007; for FEWSARC2.0 and FEWSRFE2.0 of 2.89% and 8.99% at H4H016; for TAMSAT3 of -0.87% at U2H007). TRMM3B42 produced the best representation of observed streamflow in the upper uThukela catchment, while FEWS products produced the best representation of observed streamflow in the upper and central Breede catchment (i.e. TRMM3B42 RVE% of -8.77%, -35.76% and -19.17% at V6H004, V7H017, V2H006, respectively; FEWSARC2.0 RVE% of 2.89 at H4H016 and FEWSARC2.0 and FEWSRFE2.0 RVE% of 8.99% and 26.39% at H4H018). The traditional method of utilising rain gauge measurements to drive simulations did not necessarily outperform the product driven simulations due to the sparse network of quality gauges in the study sites.
Satellite-derived rainfall should not be seen as a replacement for in-situ measurements, but conjunctive use of both data sources is advocated to create measurements that are more spatially representative and accurate. This study has shown closer agreement for total volume estimation than for daily correlations with observed data at the three study sites. Therefore, applications operating at a finer temporal resolution, like the daily scale, need more work for better representation; however, the satellite-derived rainfall may be of great value to applications at coarser temporal resolutions, such as water account/budgets, as diurnal variations seem to be obliterated at such scales. This study focused on assessing the utility of raw uncorrected satellite-derived rainfall in water resource management studies. However, the clear message from the analysis is that it will always be necessary to correct for bias and downscaling of the raw satellite-derived data to get better results. Also given the spatial variability of the performance of satellite-derived estimates, it would be important to validate these products with available observations before using them in any applications, as such estimates tend to invariably be affected by the topography and rainfall regimes of any given region.
ACKNOWLEDGEMENTS
Financial support from the Water Research Commission (WRC) and the National Research Foundation (NRF) and technical support from various members of the Centre for Water Resources Research (CWRR) are acknowledged and highly appreciated. The Hydrosciences Research Group of the Natural Resources and the Environment (NRE) Unit of the Council for Scientific and Industrial Research (CSIR) are also acknowledged for the technical support and guidance in the completion of this manuscript. Dr Kapangaziwiri's time was funded through the Hydrosciences Research Group's overheads funds.
REFERENCES
ANDERSSON JC, ZEHNDER AJ, ROCKSTROM J and YANG H (2011) Potential impacts of water harvesting and ecological sanitation on crop yield, evaporation and river flow regimes in the Thukela River basin, South Africa. Agric. Water Manage. 98 (7) 1113-1124. https://doi.org/10.1016/j.agwat.2011.02.004 [ Links ]
AMEKUDZI LK, OSEI MA, ATIAH WA, ARYEE JNA, AHIATAKU MA, QUANSAH E, PREKO K, DANUOR SK and FINK AH (2016) Validation of TRMM and FEWS satellite rainfall estimates with rain gauge measurement over Ashanti Region, Ghana. Atmos. Clim. Sci. 6 500-518. https://doi.org/10.4236/acs.2016.64040 [ Links ]
BANGIRA T, MAATHUIS BHP, DUBE T and GARA TW (2015) Investigating flash floods potential areas using ASCAT and TRMM satellites in the Western Cape Province, South Africa. Geocartogr. Int. 30 (7) 737-754. https://doi.org/10.1080/10106049.2014.997302 [ Links ]
CIABATTA L, BROCCA L, MASSARI C, MORAMARCO T, GABELLANI S, PUCA S and WAGNER W (2015) Rainfall-runoff modelling by using SM2RAIN-derived and state-of-the-art satellite rainfall products over Italy. Int. J. Appl. Earth Obs. Geoinform. 48 163-173. https://doi.org/10.1016/j.jag.2015.10.004 [ Links ]
COHEN LIECHTI T, MATOS JP, BOILLAT JL, and SCHLEISS AJ (2012) Comparison and evaluation of satellite derived precipitation products for hydrological modelling of the Zambezi River Basin. Hydrol. Earth Syst. Sci. 16 (2) 489-500. https://doi.org/10.5194/hess-16-489-2012 [ Links ]
CLARK DJ (2015) Development of a methodology for water use quantification and accounting. In: CLARK DJ (Ed) (2015) Development and assessment of an integrated water resources accounting methodology for South Africa. WRC Report No. 2205/1/15. Water Research Commission, Pretoria. [ Links ]
CLARK DJ (2017a) Further development and assessment of an integrated water resources accounting methodology for South Africa. Deliverable 4 for Project No. K5/2512. Water Research Commission, Pretoria. [ Links ]
CLARK DJ (2017b) Further development and assessment of an integrated water resources accounting methodology for South Africa. Deliverable 5 for Project No. K5/2512. Water Research Commission, Pretoria. [ Links ]
GRIMES D and DIOP M (2003) Satellite-based rainfall estimation for river flow forecasting in Africa. I: Rainfall estimates and hydrological forecasts. Hydrol. Sci. J. 48 (4) 567-584. https://doi.org/10.1623/hysj.48.4.567.51410 [ Links ]
HUFFMAN GJ, ADELR RF, BOLVIN DT and NELKIN EJ (2010) The TRMM Multi-satellite Precipitation Analysis (TMPA). In: Hossain F and Gebremichael M (eds) Satellite Rainfall Applications for Surface Hydrology. Springer Verlag, New York. 3-22. ISBN: 978-90481-2914-0. [ Links ]
HUFFMAN GJ, BOLVIN D, BRAITHWAITE D, HSU K, JOYCE R and XIE P (2014) Integrated Multi-satellite Retrievals for GPM (IMERG), version 4.0. NASA's Precipitation Processing Centre, Greenbelt. https://gpm1.gesdisc.eosdis.nasa.gov (Accessed 1 May 2017). [ Links ]
HUGHES DA (2006) Comparison of satellite rainfall data with observations from gauging station networks. J. Hydrol. 327 (3) 399-410. https://doi.org/10.1016/j.jhydrol.2005.11.041 [ Links ]
JARMAIN C, BASTIAANSEN W, MENGISTU MG and KONGO V (2009) A methodology for near-real time spatial estimation for evaporation. WRC Report No. 1751/1/09. Water Research Commission, Pretoria. ISBN 978-1-77005-725-8. [ Links ]
KIMANI MW, HOEDJES JCB and SU Z (2017) An assessment of satellite-derived rainfall products relative to ground observations over East Africa. Remote Sens. 9 (5) 430-451. https://doi.org/10.3390/rs9050430 [ Links ]
KUMMEROW C, BARNES W, KOZU T, SHIUE J and SIMPSON J (1998) The Tropical Rainfall Measuring Mission (TRMM) sensor package. Atmos. Ocean Technol. 15 809-817. https://doi.org/10.1175/1520-0426(1998)015<0809:TTRMMT>2.0.CO;2 [ Links ]
LI L, NGONGONDO CS, XU C and GONG L (2012) Comparison of the global TRMM and WFD precipitation datasets in driving a large-scale hydrological model in southern Africa. Hydrol. Res. 44 (5) 770-788. https://doi.org/10.2166/nh.2012.175 [ Links ]
MAIDMENT RI, GRIMES D, BLACK E, TARNAVSKY E, YOUNG M, GREATREX H, ALLAN RP, STEIN T, NKONDE E, SENKUNDA S and co-authors (2017) A new, long-term daily satellite-based rainfall dataset for operational monitoring in Africa. Nat. Sci. Data. 4 (63) 170063-170082. https://doi.org/10.1038/sdata.2017.82 [ Links ]
NICHOLSON S, SOME B, MCCOLLUM J, NELKIN E, KLOTTER D, BERTE Y, DIALLO B, GAYE I, KAPABEBA G, NDIAYE O and co-authors (2003) Validation of TRMM and other rainfall estimates with a high-density gauge dataset for west africa. Part I: Validation of GPCC rainfall product and pre-TRMM satellite and blended products. J. Appl. Meteorol. 42 (10) 1337-1354. https://doi.org/10.1175/1520-0450(2003)042<1337:VOTAOR>2.0.CO;2 [ Links ]
NOVELLA NS and THIAW WM (2013) African rainfall climatology version 2 for famine early warning systems. J. Appl. Meteorol. Climatol. 52 (3) 588-606. https://doi.org/10.1175/JAMC-D-11-0238.1 [ Links ]
SAWUNYAMA T and HUGHES DA (2008) Application of satellite-derived rainfall estimates to extend water resource simulation modelling in South Africa. Water SA. 34 (1) 1-9. https://doi.org/10.4314/wsa.v34i1.180739 [ Links ]
SCHULZE RE (1995) Hydrology and agrohydrology: a text to accompany the ACRU 3.00 Agrohydrological Modelling System. WRC Report No. TT69/95 Water Research Commission, Pretoria. [ Links ]
SMITHERS JC and SCHULZE RE (2004) ACRU Agrohydrological Modelling System: User Manual Version 4.00. School of Bioresources Engineering and Environmental Hydrology, University of KwaZulu-Natal, South Africa. [ Links ]
TARNAVSKY E, GRIMES D, MAIDMENT R, BLACK E, ALLAN R, STRINGER M, CHADWICK R and KAYITAKIRE F (2014) Extension of the TAMSAT satellite-based rainfall monitoring over Africa and from 1983 to present. J. Appl. Meteorol. Clim. 53 (1 2) 2805-2822. https://doi.org/10.1175/JAMC-D-14-0016.1 [ Links ]
THORNE V, COAKELEY P, GRIMES D and DUGDALE G (2001) Comparison of TAMSAT and CPC rainfall estimates with rain gauges, for southern Africa. Int. J. Remote Sens. 22 (10) 1951-1974. https://doi.org/10.1080/01431160118816 [ Links ]
TIRIVAROMBO S (2012) Climate variability and climate change in water resources management of the Zambezi River basin. Unpublished PhD thesis, Institute for Water Research, Rhodes University, South Africa. [ Links ]
WARBURTON ML, CHULZE RE and JEWITT GPW (2010) Confirmation of ACRU model results for applications in land use and climate change studies. Hydrol. Earth Syst. Sci. 14 (12) 2399-2414. https://doi.org/10.5194/hess-14-2399-2010 [ Links ]
VAN DIJK AI and RENZULLO LJ (2011) Water resource monitoring systems and the role of satellite observations. Hydrol. Earth Syst. Sci. 13 (7) 1337-1347. https://doi.org/10.5194/hess-15-39-2011 [ Links ]
VILANCULOS ACF (2015) The use of hydrological information to improve flood management- integrated hydrological modelling of the Zambezi River Basin. Unpublished PhD thesis, Institute for Water Research, Rhodes University, South Africa. [ Links ]
XIE P and ARKIN PA (1996) Analyses of global monthly precipitation using gauge observations, satellite estimates, and numerical model predictions. J. Clim. 9 840-858. https://doi.org/10.1175/1520-0442(1996)009<0840:AOGMPU>2.0.CO;2 [ Links ]
XU X, LI J and TOLSON BA (2014) Progress in integrating remote sensing data and hydrologic modelling. Prog. Phys. Geogr. 38 (4) 464-498. https://doi.org/10.1177/0309133314536583 [ Links ]
 Correspondence:
S Suleman
Email: shuaibsuleman7@gmail.com
Received: 28 August 2018
Accepted: 14 August 2020

