


Services on Demand
Article
 English (pdf)
 Article in xml format
 Article references
Indicators

Related links
-
 Cited by Google
 -
 Similars in Google
Share

 Permalink
Water SA
On-line version ISSN 1816-7950
Print version ISSN 0378-4738
Water SA vol.46 n.3 Pretoria Jul. 2020
http://dx.doi.org/10.17159/wsa/2020.v46.i3.8664
RESEARCH PAPERS
Comparison of the physicochemical and microbiological quality of different brands of bottled water with well water in Lesotho using principal component analysis
Khothalang E MolefeI; Lineo WilliamsI; Mosotho J GeorgeII; Sissay B MekbibI
IDepartment of Biology, National University of Lesotho, PO Roma 180, Lesotho
IIDepartment of Chemistry and Chemical Technology, National University of Lesotho, PO Roma 180, Lesotho
ABSTRACT
Water, though vital for life, is also the route for transmission of water-borne diseases. Bottled water is consumed worldwide for its accessibility and the public perception of purity. However, this perception is usually not based on experimental results to confirm or invalidate it, especially where the sample commodity is not adequately tested for quality. In this study, different bottled water brands in Lesotho were compared to tap and well water samples sourced locally. The standard water testing methods were used to assess the physicochemical and microbiological quality of these samples. The physicochemical parameters such as hardness, alkalinity, pH, chloride, conductivity and nitrate content were below WHO acceptable limits for all water samples tested. Upon the employment of multivariate statistics, one of the bottled water samples (C) was completely indistinguishable from the two well water samples collected in the local village. On the other hand, microbiological analysis indicated that the water samples designated as C (bottle water brand), F (tap water), G (Ha-Mafefooane) and H (Roma community water) had a high microbial load and were contaminated with Escherichia coli, while A, B, D and E samples contained Staphylococcus spp. The presence of such indicator organisms suggests possible poor hygiene during processing. It is therefore recommended that stricter policy measures be taken to regularly monitor bottled water quality, before and after production and storage, to fulfil the basic water quality standards of WHO. Public awareness should also be created that bottled water may still be impure, despite appearing attractive and convenient.
Keywords: physicochemical, microbiological, quality assessment, bottled water, Lesotho
INTRODUCTION
Water is one of the most vital requirements for the continued existence of all living organisms. Though 70% of the earth is covered by water, freshwater accounts for about 3% of the total water (The World's Water, 2004-2005), with the majority locked in glaciers and polar ice, making it inaccessible for human use. As freshwater resources are further stretched to meet the demands of industry, agriculture and an ever-expanding population, the shortage of safe and accessible drinking water is projected to become the major challenge in many parts of the world (Uitto and Duda, 2002). Surface waters such as rivers, reservoirs and groundwater are the major basic sources of drinking water. However, all water contains contaminants that may arise from the geological strata and, to a varying extent, anthropogenic pollution due to microorganisms, untreated domestic and industrial wastewater, leaching from agricultural land and livestock operations (United Nations, 2003a).
As the human population grows, it exerts a high demand on freshwater resources for domestic and other economic activities, thus threatening this valued natural resource (Bitton, 2005). Globally, 1.1 billion people rely on unsafe drinking water sources from lakes, rivers and open wells (WHO, 2003). Fresh water from springs is still widely used for domestic supply in many urban and rural areas without prior treatment or disinfection (European Parliament and Council of the European Union, 2009). This poses a high potential public health risk. An estimated 80% of illness and death in the developing world is caused by water-related diseases (United Nations, 2003b). Studies have revealed that more than 56% of people in the USA are worried about the quality of municipally treated tap water and thus, with the rising concern for public health, many people choose bottled water over tap water (Water Quality Association, 2019).
Contaminated drinking water sources are significant routes for transmission of a number of infectious diseases. Since water quality is dynamic in time and space, raw water quality assessment is fundamental to preserve the quality of water resources for sustainable development and improvement of the quality of drinking water before reaching the public (Di Bernardo and Paz, 2008). According to WHO (2003), water quality must meet the microbial, chemical and physical characteristic guidelines of international standards. Water quality parameters like alkalinity, hardness, dissolved oxygen (DO), chloride, total dissolved solids (TDS), etc., add to the aesthetic value of water. Pollutants like ammonia, lead, arsenic, and nitrate may cause adverse health effects (WHO, 2003). Water with a high or low pH, high turbidity, etc., is objectionable for drinking. An appropriate chloride content and hardness are desirable but in excess detrimentally affect the aesthetic qualities of water. Similarly, a high content of phosphate, nitrate, ammonia and iron, are also undesirable. Some other chemical constituents such as heavy metals are toxic and consequently their presence in potable water is regulated accordingly (WHO, 2003).
In addition to chemical pollutants are microbiological aspects. Drinking water has to be free from any pathogens as well as opportunistic microflora. Microbes such as Salmonella, Shigella, Mycobacterium spp. and faecal coliforms are potential pathogens capable of causing various diseases: typhoid (Salmonella enterica serovar Typhi), cholera (Vibrio cholerae), diarrhoea (E. coli O157:H7), dysentery (Shigella dysenteriae) and hepatitis viruses A, B, C, D and E (Da Silva et al., 2008). According to WHO (2003) faecal contamination of water sources and in treatment of water is a persistent problem worldwide. Coliforms (E. coli) have long been recognised as a suitable microbial indicator of drinking water quality; their presence in water samples indicates the presence of faecal matter and the possible presence of pathogenic microorganisms (European Union, 1998).
Bottled water is seen as a good choice for hydration and refreshment because of the favourable public perceptions of bottled water quality and convenience (Beverage Marketing Corporation, 2003; Rowles III et al., 2018). In Lesotho, there is a perception that bottled water has a high quality and is free of chemical and microbial agents. This is perhaps driven by the poor quality of the municipal water piped through the urban areas. Or it could well be driven by advertisements and the labels of such products, as well as the general belief that whatever is sold in the mainstream trade must have gone through some testing for safety and quality.
The high quality and abundance of freshwater resources in Lesotho has provided an opportunity for many Basotho bottled water entrepreneurs, due to the high unemployment rate. This is enabled by Lesotho not having appropriate infrastructure to regulate and test these commodities before they are placed in the market. This situation necessitated this study, which was aimed at carrying out rapid screening of some of the locally bottled water brands for chemical and microbiological quality in comparison with tap and well water sources. The results obtained will, therefore, provide some basis for consumer confidence in the products, if quality is acceptable, as well as confirming (or negating the belief) that bottled water indeed presents a safer and higher quality option to the normal municipal tap water or open well water.
MATERIALS AND METHODS
Water sample collection
Different water samples were collected in replicate as follows: 5 different brands of bottled water procured from local shops, treated public water supply by the local water treatment authority, National University Lesotho (NUL) Roma Campus tap water, and well water (2 samples) from Ha-Mafefooane, Roma community water supply, about 2 km to the south-east of the NUL, Roma campus, were used. These samples were respectively assigned labels from A-H and refrigerated at 4°C until processed.
Microbiological analyses of the water samples
The Multiple Tube Fermentation test was used to detect and quantify coliforms from tap and well water samples using standard methods (1998), while membrane filtration technique with contact media was used to determine the quality of bottled water samples, as used by Slanetz and Bartley (1954). In the filtration technique, a volume of 500 mL from each sample was filtered through hydrophilic mixed cellulose ester membranes of pore size 0.45 µL. A semisolid nutrient agar was used as a contact culture media to allow growth of the microorganisms from the filtrate on the filter membrane. The Petri dishes were then incubated at 37°C for 24-48 h and plates were evaluated for presence of growth. Representative colonies were then grown on different selective media for identification: Bacillus Cereus, Brilliant Green, Violet Red Bile Glucose, Eosine Methylene Blue, MacConkey, Mannitol Salt and Salmonella Shigella agar. The IMViC, catalase, and Gram-staining tests were performed to identify coliforms and other heterotrophic bacteria in the water samples.
Physicochemical analysis of the water samples
Different physicochemical parameters amenable to water quality assessment, namely, pH, dissolved salts measured as electrical conductivity, hardness, free carbon dioxide, and essential elements and their corresponding compounds (nitrates, phosphates, chloride), were analysed following standard methods (APHA, 1998; WHO, 2011), unless otherwise stated. Total nitrogen was determined according to the USEPA Method 1688 (USEPA, 2001).
Data analysis using multivariate statistics
The semi-qualitative data obtained from microbial analysis were compared with the standard set by WHO (2011). The data from the physicochemical analyses were exported into the SIMCA-P SIMCA 13.0 Software (Umetrics, Umea Sweden) for principal component analysis to assess any similarities or differences between the different samples, specifically in relation to tap and well water. To this effect, different plots (scores, hierarchical and component contributions) were used for the analysis.
RESULTS AND DISCUSSION
Tap and well water microbial analysis
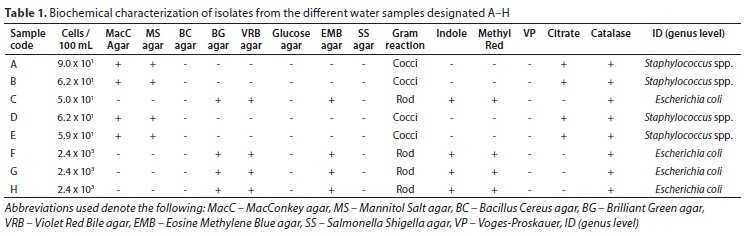
The microbial load of the tap and well water samples determined using the most probable number (MPN) approach indicates that the bioburden in Samples F, G and H was found to be 2.4 x 10³ cells/ 100 mL which is above the WHO recommendation level, unlike the other samples (A-E), which were found to be within the recommended limit of WHO for the total count (Table 1). The quantity of bacteria in bottled water is generally dependent on the treatment and quality of water sources under natural conditions before processing. Raw waters are known to contain natural microbiota composed of species mainly of genera Achromobacter, Flavobacterium, Alcaligenes, Acinetobacter, Cytophaga, Moraxella and Pseudomonas (Da Silva et al., 2008). If these microorganisms are not adequately removed during processing and bottling of the drinking water, bacterial multiplication may occur for 1-3 weeks after bottling, and the bacterial count can reach 103-104 cells/L at 37°C (Da Silva et al., 2008). So, the high total counts in this study reflect the potential contamination of the water system with coliform bacteria.
Biochemical characterisation of the microbial composition of the water samples
Characterisation of the microorganisms present in the different water samples was achieved using different media as indicated in Table 1. The microorganisms present in Samples A, B, D and E showed growth only on MacConkey and Mannitol Salt agar. No growth was observed on Bacillus Cereus, Brilliant Green, Violet Red Bile Glucose, Eosine Methylene Blue and Salmonella Shigella agar, while microorganisms from Sample C showed growth on Eosine Methylene Blue and MacConkey Agar (Table 1). The microbial contaminants isolated from A, B, D and E water samples were identified as Staphylococcus spp., while those from C, F, G and H were identified as Escherichia coli (Table 1).
In the tested bottled water brands, variations in the type and counts of bacteria indicate changes in the quality of drinkable water, and such alterations may reflect the source of contamination and changes in available nutrient content of the water (Falcone-Dias and Filho, 2013). This could imply that the characteristics of the water source and its management in the packaging and handling process have influenced the nature of bioburden in the branded water (Manaia et al., 1990; Rosenberg, 2003). As reported by Warburton (2000), microbial surveys of bottled water showed high heterotrophic plate counts (HPC). In some studies, the presence of Vibrio cholera infections has also been detected among people drinking bottled water (Blake et al., 1977; Kramer et al., 1996). In addition, fungal spoilage (Carbal and Fernandez-Pinto, 2002); the presence of antibiotic-resistant strains such as Pseudomonas spp. (Guillot and Leclerc, 1993; Legnani et al., 1999; Sacchetti et al., 2013), Staphylococcus aureus (Leclerc et al., 1985; Sacchetti et al., 2013), Aeromonas hydrophila (Manaia, et al., 1990), and the pathogens responsible for typhoid fever and traveller's diarrhoea (Warburton, 1993) has also been reported.
Therefore, the bottled water industry needs to follow strict quality standards in terms of microbiological analysis in water processing for production, bottling, transportation and storage (Cowman and Kelsey, 1992; Hunter, 1993). In this study, E. coli and Staphylococcus spp. were commonly encountered species. The presence of E. coli is strictly unacceptable (WHO, 2011). Though there is no recommended limit set for the presence of Staphylococcus spp. and other non-pathogenic microbial species in drinkable water, it is strongly commended that all drinking water sources be tested for any contaminant to control heterotrophic growth in the bottled water, assuming the permissible WHO limit, which is <500 CFU/mL during storage (Morais and Da Costa, 1990; Falcone-Dias and Filho, 2013).
Assessment of physicochemical parameters
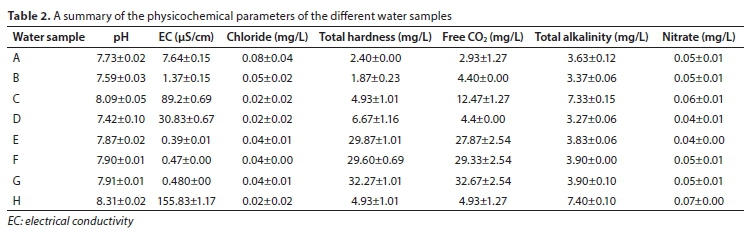
Many different physicochemical properties of water are usually measured. These properties and their limits depend mostly on the source and purpose of that water. Table 2 summarises the values obtained for different physicochemical properties analysed in this study.
Although all samples show high variability in electrical conductivity, chloride content, total hardness, free CO2, and total alkalinity (Table 2), the variability is insignificant relative to the permissible limits set by WHO (2003). This indicates that the contents have no noticeable adverse effect as reported by WHO. However, there could be adverse effects on human health from long-term usage, which could be associated with microbial indicators (Agrawal and Jagetia, 1997).
Comparison of water samples using multivariate statistics
Multivariate statistics have been used to demonstrate some of the variation in different samples. While multivariate statistics are known for simplifying a large volume of data, it has been employed recently in studies with a relatively small volume of data, e.g., the physicochemical characterisation of river water (Tanor et al., 2014), wastewater sludge (Tanor et al., 2016) and different animal manures (Nwahara et al., 2017).
Figure 1 shows the loadings plot of the eight sample groups with a variance of 76% on Component 1 and 24% on Component 2.

Samples E, F and G clustered together to the extent that E is hidden behind the symbols representing F and G (see Gen 1-1 in Fig. 1). The other group in the first generation (Gen 1-2) separated into 3 groups boxed Gen 2. A better visual representation of the generations is shown in Fig. 2, demonstrating the hierarchical clustering of the eight samples. The significance of clustering is that it shows which samples are closely related, in this case which ones have the same quality with respect to the analysed parameters.

Importantly, the replicates of the individual samples showed satisfactory clustering indicating considerable precision of the results.
Samples F, G and E have once again clustered together between the compound entries 14-21, forming one branch of the 1st Generation (Gen 1-1), and they remained individually indistinguishable. The remaining samples formed the second branch of the first generation (Gen 1-2) from which H breaks off as a second generation (Gen 2-1) leaving the other four samples in Gen 2-2. The cascade goes on until the fifth generation where individual samples (A and B) are eventually separated. However, the samples in Gen 1-1 could not form distinguishable inter-sample identities, indicating close resemblance in composition as shown by the intersecting lines showing individual replicates of each of the three samples (E, F and G). For example, entries 13, 14 and 15 were replicates of the same sample, although 13 seems to be more closely related to 16 and 20, while 15 is more closely related to the 17 and 21 replicates.
The comparison of the two multivariate statistics representations, the loadings plot and the hierarchical clustering, shows sufficient agreement in the major clustering of the samples. Interestingly, the latter also shows the samples with a higher precision, such as Sample B. Of note, there is also a high inter-sample precision observed with the Gen 1-1 cluster (E, F and G samples represented by individual replicates denoted as 14-21). The other samples showed slightly lower precision, although they were still distinguishable from the other samples, albeit at the higher generation level (Gen 5).
Close inspection of the principal components that led to major clustering, as seen in Figs 1 and 2, showed that electrical conductivity (EC) was responsible for Principal Component 1 while total hardness and total alkalinity are responsible for Principal Component 2 (Fig. 3).

It is noteworthy that electrical conductivity is dependent on many phenomena that include the concentration of dissolved salts and the mobility of those ions (Tanor et al., 2014). Therefore, without exhaustive determination of different salts that could be in the sample, it is not possible to discuss the different conductivities in the samples, except to say that Sample H has the highest conductivity of all the samples in agreement with Table 3, which is not attributed to pH. The pH is usually one of the most important phenomena in determining the electrical conductivity of the aqueous solutions, due to the high mobility of H+ ions (George and Ramollo, 2014).
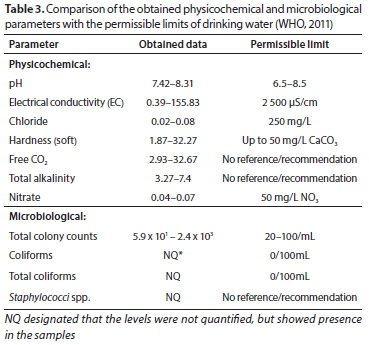
Comparison of results with prescribed permissible limits
Although the physiochemical characteristics of the water samples were within the permissible limit of WHO (Table 3), the microbiological quality was highly compromised due to the presence of E. coli, which is one of the indicator organisms of coliforms (WHO, 2003). The presence of both E. coli and Staphylococci demonstrated contaminations attributable to poor hygiene either at the source or during the bottling process. In drinking water from municipal supplies, the coliform test can be used as an indicator of treatment efficiency and of the integrity of the distribution system (Kokkinakis et al., 2008; Setty et al., 2017). A heavy bioburden (2.4 x 10³ cells/100mL) observed in the well and municipal tap water sources (F, G and H), confirmed by the presence of E. coli, indicated the poor quality of the water delivered to the community. The report by Da Silva et al. (2008) indicated the potential risk associated with the presence of coliforms in any drinking water as it could also suggest the potential presence of other pathogenic enteric microorganisms such as Salmonella spp., Shigella spp. and Vibrio cholera.
CONCLUSIONS AND RECOMMENDATIONS
We have demonstrated through this quick screening of the quality of bottled water that some of the bottled water procurable in Lesotho is not as healthy as most believe it to be. At least of one of the bottled water samples could not be differentiated from the groundwater collected from the village next to the university. Given that bottled water is believed to be healthier than open source water, this could either mean that this bottled water sample was not as pure as it was purported to be, or that the open source water was at a purer level than anticipated. Although all the physicochemical and microbial load parameters assessed were within WHO acceptable limits, all the bottled water samples showed high levels of microbial load in all samples, except one (C). This positive testing of microbial presence implies contamination of the spring water could be from the source and/or poor hygienic practices during the bottling processes. For this reason, the safety of bottled water cannot be assumed.
Given that the brands are all local, and Lesotho does not have accredited laboratories for analytical testing of these local products, it is recommended that Government acts speedily and urgently to establish relevant infrastructure to ensure the safety of consumers. Environmental laws must be strictly enforced to protect vulnerable water sources such as the public wells. The other concern is that most of the brands did not display sufficient information about the quality aspects assessed in this study, with the exception of pH and electrical conductivity. There was no mention of the microbial content. The proprietors of the brands were not consulted about the study, and it is not advisable for the researchers to approach them about the results as the researchers are not a legal authority entrusted with the responsibility of quality assessment. In conclusion, it is recommended that awareness should also be created among the general public about the use of bottled water and that there is no foundation for the popular belief that bottled water is synonymous with purity.
REFERENCES
AGRAWAL V and JAGETIA M (1997) Hydrogeochemical assessment of groundwater quality in Udaipur city, Rajasthan, India. In: Proceedings of National Conference on Dimension of Environmental Stress in India. Department of Geology, MS University, Baroda, India. 151-154. [ Links ]
APHA (1998) Standard Methods for the Examination of Water and Wastewater (20th edn). American Public Health Association, Washington DC. 1-47. [ Links ]
BLAKE PA, ROSENBERG ML, FLORENCIA J, COSTA JB and GANGAROSA EJ (1977) Cholera in Portugal, 1974. II. Transmission by bottled mineral water. Am. J. Epidemiol. 105 344-348. https://doi.org/10.1093/oxfordjournals.aje.a112392 [ Links ]
BITTON G (2005) Wastewater Microbiology (3rd edn). John Wiley and Sons, New Jersey. [ Links ]
CARBAL D and PINTO VEF (2002) Fungal spoilage of bottled water. Int. J. Food Microbiol. 72 73-76. https://doi.org/10.1016/S0168-1605(01)00628-6 [ Links ]
COWMAN S and KESLEY R (1992) Bottled water. In: Vanderzant C and Splittstoesser DF (eds) Compendium of Methods for the Microbiological Examination of Foods (3rd edn). American Public Health Association, Washington, DC. 1031-1036. [ Links ]
DA SILVA MEZ, SANTANA RG, GUILHERMETTI M, FILHO IC, ENDO EH, UEDA-NAKAMURA T, NAKAMURA CV and FILHO BPD (2008) Comparison of the bacteriological quality of tap water and bottled mineral water. Int. J. Hyg. Environ. Health. 211 504-509. https://doi.org/10.1016/j.ijheh.2007.09.004 [ Links ]
EUROPEAN UNION (1998) Directive 98/83/CE of Council of 3 November 1998 on the quality of water intended for human consumption. Off. J. Eur. Commun. L330 32-54. [ Links ]
EUROPEAN PARLIAMENT AND COUNCIL OF THE EUROPEAN UNION (2009) Directive 2009/54/ EC of the European Parliament and of the Council of 18 June 2009 on the exploitation and marketing of natural mineral waters. Off. J. Eur. Union L164 45-58. [ Links ]
FALCONE-DIAS MF and FILHO AF (2013) Quantitative variations in heterotrophic plate count and in the presence of indicator microorganisms in bottled mineral water. Food Cont. 31 90-96. https://doi.org/10.1016/j.foodcont.2012.09.038 [ Links ]
GEORGE MJ and RAMOLLO N (2014) A study of the dynamics of copper (II) ions uptake from aqueous solutions by human hair using conductivity and pH measurements. Eur. Chem. Bull. 3 (9) 883-887.http://dx.doi.org/10.17628/ecb.2014.3.883-887 [ Links ]
GUILLOT E and LECLERC (1993) Biological specificity of bottled natural mineral waters: Characterization by ribosomal ribonucleic acid gene restriction patterns. J. Appl. Bacteriol. 75 292-298. https://doi.org/10.1111/j.1365-2672.1993.tb02779.x [ Links ]
HUNTER PR (1993) The microbiology of bottled mineral waters. J. Appl. Bacteriol. 74 345-352. https://doi.org/10.1111/j.1365-2672.1993.tb05137.x [ Links ]
KOKKINAKIS EN, FRAGKIADAKIS GA and KOKKINAKI AN (2008) Monitoring microbiological quality of bottled water as suggested by HACCP methodology. Food Cont. 19 957-961. https://doi.org/10.1016/j.foodcont.2007.10.001 [ Links ]
KRAMER MH, HERWALDT BL, CRAUN GF, CALDERON RL and JURANEK DD (1996) Surveillance for waterborne-disease outbreaks - United States, 1993-1994. Surveillance Summaries: Morbidity and Mortality Weekly Report 45 1-31. https://stacks.cdc.gov/view/cdc/26708 [ Links ]
LECLERC H, MOSSEL DAA and SAVAGE C (1985) Monitoring noncarbonated ('still') mineral waters for aerobic colonisation. Int. J. Food Microbiol. 2 341-347. https://doi.org/10.1016/0168-1605(85)90024-8 [ Links ]
LEGNANI P, LEONI E, RAPUANO S, TURIN D and VALENTI C (1999) Survival and growth of Pseudomonas aeruginosa in natural mineral water: A 5-year study. Int. J. Food Microbiol. 53 153-158. https://doi.org/10.1111/j.1365-2672.1990.tb01586.x [ Links ]
MANAIA CM, NUNES OC, MORAIS P and DA COSTA MS (1990) Heterotrophic plate counts and the isolation of bacteria from mineral waters on selective and enrichment media. J. Appl. Bacteriol. 69 871- 876. https://doi.org/10.1111/j.1365-2672.1990.tb01586.x [ Links ]
MORAIS PV and DA COSTA MS (1990) Alterations in the major heterotrophic bacterial populations isolated from a still bottled mineral water. J. Appl. Bacteriol. 69 (5) 750-757. https://doi.org/10.1111/j.1365-2672.1990.tb01572.x [ Links ]
NWAHARA NU, MOTHOAKO KP, SAMOSAMO TJ, TAASI RS, POSHOLI MA, SHALE L, MEKBIB SB and GEORGE MJ (2017) A chemometric comparison of organic manure from different animal sources using a principal component analysis. Asian J. Agric. Sci. 9 (1) 1-7. https://doi.org/10.19026/ajas.9.4192 [ Links ]
ROSENBERG FA (2003) The microbiology of bottled water. Clin. Microbiol. Newslett. 25 (6) 41-44. https://doi.org/10.1016/S0196-4399(03)80019-3 [ Links ]
ROWLES (III) LS, ALCALDE R, BOGOLASKY F, KUM S, DIAZ-ARRIAGA FA, AYRES C. MIKELONIS AM, TOLEDO-FLORES LJ, ALONSO-GUTIÉRREZ MG, PÉREZ-FLORES ME, LAWLER DM, PETER M, WARD PM, LOPEZ-CRUZ JY and SALEH NB (2018) Perceived versus actual water quality: Community studies in rural Oaxaca, Mexico. Sci. Total Environ. 622-623 626-634. https://doi.org/10.1016/j.scitotenv.2017.11.309 [ Links ]
SACCHETTI R, DE LUCA G, DORMI A, GUBERTI E and ZANETTI F (2014) Microbial quality of drinking water from microfiltered water dispensers. Int. J. Hyg. Environ. Health 217 255-259. https://doi.org/10.1016/j.ijheh.2013.06.002 [ Links ]
SETTY KE, KAYSER GL, BOWLING M, ENAULT J, LORET JF, SERRA CP, ALONSO JM, MATEU AP and BARTRAM J (2017) Water quality, compliance, and health outcomes among utilities implementing Water Safety Plans in France and Spain. Int. J. Hyg. Environ. Health 220 513-530. https://doi.org/10.1016/j.ijheh.2017.02.004 [ Links ]
SLANETZ LW and BARTLEY CH (1954) Evaluation of membrane filters for the determination of numbers of coliform bacteria in water. Department of Bacteriology, University of New Hampshire, Durham, New Hampshire. URL: https://aem.asm.org/content/aem/3/1/46.full.pdf (Accessed 16 August 2018). [ Links ]
TANOR EB, TS'ENOLI S and GEORGE MJ (2014) Physicochemical assessment of pollution in the Caledon River around Maseru City, Lesotho. Eur. Chem. Bull. 3 (8) 776-782. http://dx.doi.org/10.17628/ecb.2014.3.776-782 [ Links ]
TANOR EB, GEORGE MJ, MOHASE PJ, KHESA ME and KHESA LA (2016) Characterization of the physicochemical properties of the maseru municipal wastewater sludge for potential application in agricultural soils as an organic-mineral and soil modifier. Eur. Chem. Bull. 5 (6) 252-258. http://dx.doi.org/10.17628/ecb.2016.5.252-258 [ Links ]
UITTO JI and DUDA AM (2002) Management of transboundary water resources: lessons from international cooperation for conflict prevention. Geogr. J. 168 (4) 365-378. https://doi.org/10.1111/j.0016-7398.2002.00062.x [ Links ]
UNITED NATIONS (2003a) Water for People, Water for Life: A Joint Report by the 23 UN Agencies concerned with Fresh Water, The UN World Water Development Report. United Nations, Paris. [ Links ]
UNITED NATIONS (2003b) 'Water-related diseases responsible for 80 per cent of all illnesses, deaths in developing world', says Secretary-General in Environment Day message. https://www.un.org/press/en/2003/sgsm8707.doc.htm (Accessed 3 June 2020). [ Links ]
USEPA (United States Environmental Protection Agency) (2001) Method 1688 Total Kjeldahl nitrogen in water and biosolids by automated colorimetry with preliminary semi-automatic digestion. Office of Water, Science and Technology Engineering and Analysis Division, USEPA, Washington DC. [ Links ]
WARBURTON DW (1993) A review of the microbiological quality of bottled water sold in Canada, Part 2. The need for more stringent regulations. Can. J. Microbiol. 39 158-168. https://doi.org/10.1139/m93-022 [ Links ]
WARBURTON DW (2000) Methodology for screening bottled water for the presence of indicator and pathogenic bacteria. Food Microbiol. 17 3-12. https://doi.org/10.1006/fmic.1999.0283 [ Links ]
WATER QUALITY ASSOCIATION (2019) Consumer opinion study. Summary and highlights. National study of consumers' opinions and perceptions regarding water quality 2019 edition. https://www.wqa.org/Portals/0/Publications/ConsumerStudy2019_Public.pdf (Accessed 3 June 2020). [ Links ]
WHO (2003) Emerging issues in Water Quality Recommendations. World Health Organization, Geneva. [ Links ]
WHO (2011) Guidelines for Drinking Water Quality (4th edn) World Health Organization, Geneva. [ Links ]
 Correspondence:
Mosotho J George
Email: jm.george@nul.ls; maluti2005@gmail.com
Received: 14 October 2019
Accepted: 2 June 2020

