


Services on Demand
Article
 English (pdf)
 Article in xml format
 Article references
Indicators

Related links
-
 Cited by Google
 -
 Similars in Google
Share

 Permalink
Water SA
On-line version ISSN 1816-7950
Print version ISSN 0378-4738
Water SA vol.46 n.3 Pretoria Jul. 2020
http://dx.doi.org/10.17159/wsa/2020.v46.i3.8663
RESEARCH PAPERS
Modelling of chlorophyll-a and Microcystis aeruginosa decay under the effect of different oxidants in culture media
Ivan JuárezI, II, *; Jorge Oswaldo ArandaII, *; Sandro GoñiI; Melina Celeste Crettaz-MinagliaII; Daniela SedanII; Darío AndrinoloII; Tomás LombardoIII; Guillermo BlancoIII; Leda GiannuzziI, II
ICentro de Investigación y Desarrollo en Criotecnología de Alimentos, Consejo Nacional de Investigaciones Científicas y Tecnológicas, Universidad Nacional de La Plata, Argentina
IIÁrea de Toxicología General, Facultad de Ciencias Exactas, Universidad Nacional de La Plata, La Plata, Argentina
IIIInstituto de Estudios de la Inmunidad Humoral (IDEHU), Cátedra de Inmunología de la Facultad de Farmacia y Bioquímica, Universidad de Buenos Aires, Argentina
ABSTRACT
Blooms of the cyanobacterium Microcystis aeruginosa are common in many eutrophic freshwater bodies and pose a serious threat to water quality, potentially giving rise to high turbidity, food web alterations, increased production of toxic microcystin (MC-LR) and odorous compounds. The comparative effectiveness of oxidant treatment of M. aeruginosa cells in culture media was evaluated by applying a mathematical model of chlorophyll-a (Chl-a), cells and MC removal. The oxidants were chlorine (1-5 mg∙L-1), hydrogen peroxide (HP: 50-150 mg∙L-1), percitric acid (PCA: 10-50 mg∙L-1), and peracetic acid (PAA: 1.5-7.5 mg∙L-1). The Weibull distribution model was applied to assess the degree of inactivation of M. aeruginosa viability under different oxidant treatments. First-order kinetics was successfully applied to the experimental data for Chl-a decay. Using the Weibull model, it was possible to predict the required exposure time (Tr) for oxidants to achieve a 99.9% reduction in viable M. aeruginosa cells with respect to the initial value. 5 mg∙L-1 chlorine produced a 81% degradation of [D-Leu1] MC-LR after 72 h, with an exposure time (Tr) of 141 h. Among the peroxide treatments (HP, PCA and PAA), PCA (10-50 mg∙L-1) produced the highest level of [D-Leu1] MC-LR degradation (39-79%), with low exposure times (Tr = 119-125 h). Chl-a concentration and M. aeruginosa counts for each oxidant treatment were highly correlated and successfully linked by a cubic polynomial. This is the first modelling report of M. aeruginosa decay by oxidant treatments.
Keywords: Microcystis aeruginosa, microcystin, mathematical model, oxidants, chlorophyll-a decay, Weibull model
INTRODUCTION
The appearance of cyanobacterial blooms in freshwater bodies is a growing phenomenon throughout the world (Paerl and Huisman, 2008, 2009; Jöhnk et al., 2008; Kosten et al., 2012). Cyanobacterial blooms develop mainly during summer in eutrophic freshwater ecosystems with stagnant water (Harke et al., 2016). This is a fallout of the impact of human activities (such as nutrient downloads) on freshwater bodies as well as the effect of climate change on the ecosystem. Cyanobacteria can produce cyanotoxins and thus impact strongly on important ecosystem services such as recreation and fishing, aquaculture, irrigation and drinking water treatment. The control of cyanobacterial blooms is an important challenge that requires an early solution, considering the fact that the cyanobacterial phenomenon is likely to increase in climate change scenarios (Paerl and Huisman, 2008; Jöhnk et al., 2008; Matthijs et al., 2016). Additionally, a significant increase in the costs of treating water intended for human consumption should be considered (Aguilera and Echenique, 2017).
Paerl and Otten (2013) reported that about 50-75% of cyanobacterial blooms are toxic and have caused a serious threat to human and animal health because of the potent hepatotoxins, neurotoxins and dermatotoxins that they release into water bodies (WHO, 1999). Microcystin-LR (MC-LR) generated by M. aeruginosa is the most abundant and common hepatotoxin found in cyanobacterial blooms in fresh and brackish waters (Paerl and Otten, 2013; Westrick et al., 2010; Zamyadi et al., 2013). Chronic exposure to sub-lethal concentrations of microcystins is the most common form of intoxication in wild and domestic animals and humans. A correlation has been reported between high levels of primary liver cancer in the regions of Southeast Asia and China and the consumption of surface water where blooms of toxic cyanobacteria are very frequent (Ueno et al., 1996; Zhao et al., 2009).
MC-LR has been identified as one of the highest priority toxins to be studied based on four criteria (USEPA, 2015):
•Its effect on human health
•Its frequency of occurrence in bodies of water
•Its susceptibility to the treatments used in water treatment plants
•The stability of the toxin
The preferred method of preventing these blooms is to reduce the nutrient load of surface waters, although this is not always feasible. Various chemical methods have also been widely adopted, such as addition of algicide (copper sulfate), oxidants (chlorine, potassium permanganate) and flocculants (FeCl3, AlCl3, polyaluminum chloride) etc., all of which have proven to be efficient in removing cyanobacteria cells. However, the persistence of some chemical compounds can potentially induce secondary pollution, harming aquatic organisms and even humans. Some oxidants used as part of drinking water treatment or as pre-treatment of surface water destined for the production of drinking water, can cause the release of toxins, and the subsequent rapid oxidation of the toxins must therefore be assured (Zamyadi et al., 2013; Stanford et al., 2016; Rositano et al., 2001).
Hydrogen peroxide (HP), percitric acid (PCA) and peracetic acid (PAA) are alternative disinfectants, owing mainly to the fact that the formation of disinfection by-products (DBPs) and the overall toxicity during their use is much lower than with chlorine or ozone (Booth and Lester, 1995, Monarca et al., 2002; Crebelli et al., 2005). The principal PAA and PCA end-products are acetic acid, citric acid, HP, oxygen and water. PAA is a sustainable disinfectant in aquaculture and it completely degrades into harmless residues within several hours after application (Lefevre et al., 1992). However, its usage in drinking water treatment is still an evolving topic.
The main aim of this study was to evaluate the effectiveness of HP, PAA and PCA treatment on M. aeruginosa cells in culture media compared to chlorine, and to mathematically model the kinetic of Chl-a and cell removal.
MATERIAL AND METHODS
Strain preservation
A toxigenic non-axenic strain of M. aeruginosa (CAAT2005-3) previously reported as a [D-Leu1] MC-LR producer was used (Rosso et al., 2014). This strain was isolated from the environment and remained unicellular in culture under laboratory conditions. The strain is maintained by periodic passage (every 15 days) through modified BG11 culture medium at 25°C (±1) and light intensity 30 µmol∙photon∙s-1∙m-2 with constant aeration with humidified sterile air (Barroin and Feuillade, 1986).
Experimental design
For assays, the M. aeruginosa strain was grown in triplicate in modified BG11 medium (nitrogen phosphorus ratio 10) in 1 000 mL Erlenmeyer flasks under controlled temperature conditions (25°C ±1), constant aeration with humidified sterile air, a fluorescent light intensity of 30 µmol photons∙s-1∙m-2 and a light-dark cycle of 10:14 h. Prior to the experiments, the cultures were acclimated for 7 days at 104-105 cell∙mL-1 inoculum, periodically adding the culture medium.
Non-axenic M. aeruginosa cultures (105 and 106 cells·mL−1 and Chl-a 2 000-2 500 µg∙L−1) were used to simulate a heavy bloom concentration and treated with different concentrations of HP, PAA, PCA and chlorine. All treatments were carried out in batch mode, using Erlenmeyer flasks containing cyanobacterial culture. Stabilized HP (Fluka, 30%) was added to achieve 50, 100 and 150 mg∙L-1. The selected HP doses were within the ranges reported in the literature (Fan et al., 2013; Wang et al., 2012; Huo et al., 2015). PAA and PCA treatment tests were carried out employing the commercial product SABINUR, an equilibrium mixture containing peracetic acid or percitric acid (15% mass/volume, m/v), hydrogen peroxide (30% m/v) and stabilizing vehicle. PAA and PCA doses were 1.5, 3.0, and 7.5 mg∙L-1 and 10, 30 and 50 mg∙L-1, respectively. A control experiment without oxidants was performed.
Chlorine stock solution concentrations ranged from 4 000-5 000 mg∙L-1 as free chlorine. For chlorine experiments, cyanobacterial samples were dosed with chlorine to achieve the desired chlorine concentrations (1, 3 and 5 mg∙L-1).
To inactivate the residual of PAA, PCA and chlorine after the specified contact time, sodium thiosulfate (1%) was added in the proportion 0.1 mL for each 100 mL of sample. Catalase was applied to inactive HP residual. The control and treated cultures were placed in a controlled environment growth chamber (Ingelab I-292PF) at 25°C; the average irradiance in the incubator was 30 µmols-1∙photon∙m-2 with a light-dark cycle of 10:14 h.
At different times during the experiment (0, 24, 48 and 72 h), samples of the cultures were taken and pH, concentration residuals of chlorine, HP, PAA and PCA, Chl-a and M. aeruginosa viability determinations were performed. All experiments were conducted with three independent replicates.
pH determination
pH determination was performed with a pH metro electrode Sper Scientific Water Quality Meter Model 850081.
Residual concentration of chlorine, HP, PAA and PCA
Chlorine stock concentrations and free chlorine residuals were determined using the DPD-FAS titration method described in Standard Methods (APHA, 2005). Peroxide residuals were analysed by Quantofix test sticks (Machereye-Merck, Darmstadt, Germany). It was possible to refine the measurements by taking photographs of each test stick and then comparing these with our own calibration series according to the procedure described by Matthijs et al. (2012). PAA and PCA concentrations were determined by iodometric titration according to a two-step procedure developed for PAA determination (Pinkenell, 1994). First, hydrogen peroxide was consumed by the addition of catalase from bovine liver (2 000-5 000 unit∙mg-1, Sigma) and then PAA or PCA was titrated by thiosulfate addition (Falsanisi et al., 2006).
Determination of Chl-a
Chl-a was determined by the 100% methanol extraction method according to the technique of Marker et al. (1980). The spectrophotometric reading at 665 and 750 nm before and after acidification with 1 N HCl were performed. Chl-a concentrations were expressed as μg∙L-1.
Modelling Chl-a decay
Modelling Chl-a decay by first-order kinetics:
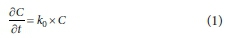
Integrating Eq. 1, the Eq. 2 was obtained:
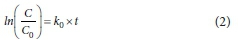
where k0 is the first-order decay constant (h-1), C is the Chl-a concentration at time t, C0 is the initial Chl-a concentration (µg∙L-1), and t is the time (h); k0 (the slope of the model) is obtained through the linear regression under each condition.
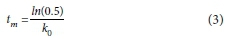
The time required for the concentration of Chl-a to decay to half the initial values (tm) was calculated using Eq. 3.
A linear relationship between k0 values and the oxidant concentration was proposed:

where a is the interception of y-axes, b is the slope and C is the concentration of the different oxidants used.
For each oxidant used in the experiments, the (EC50)Chl-a values (defined as the concentration of oxidants (mg∙L-1) at which 50% of Chl-a were degraded at 72 h) were obtained by the linear interpolation method.
Evaluation of M. aeruginosa cell viability by flow cytometry
Cell viability was assessed by flow cytometry using a Partec PAS III instrument equipped with a 488 nm argon laser as excitation source, and a volumetric injection system for the absolute count of analysed cells. Cells were labelled with SYTOX green, and non-viable cyanobacteria were identified by green fluorescence emission at 520 nm (FL1).
A 3 mL aliquot was centrifuged at 5 000 g for 10 min, and then the cells were incubated with Sytox Green (Thermo Fisher Scientific) at a final concentration of 1 nM for 30 min in the dark (Tashyreva et al., 2013). The dye binds to nucleic acids and cannot penetrate the membrane of living cells. However, when the membranes are compromised, it easily penetrates the cell producing a bright green fluorescence indicative of dead cells.
Analysis of flow cytometry data was conducted with Flomax 2.7 software. Using this approach, the absolute number of viable M. aeruginosa and the fraction of dead cells at each point in time after treatment were evaluated. Survival curves were then generated from the experimental data by plotting log(N/N0) (where N is the number of viable cells of M. aeruginosa at a given time, and N0 is the initial number of viable cells and was expressed as cells∙mL-1 versus treatment time.
Modelling M. aeruginosa survival curves
The Weibull distribution is a flexible and convenient model for describing microbial survival curves when the kinetic is not linear. It is a continuous probability distribution which has been extensively used to study survival curves and inactivation kinetics of different microorganisms (Chun et al., 2009; González et al., 2009; Mafart et al., 2002; Peleg and Cole, 1998).
M. aeruginosa survival curves were fitted using the Weibull model (Eq. 5):
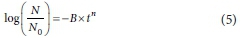
where N and N0 are the viable cells number (cells∙mL-1) present at time t and zero, respectively; t is time (h); B is the scale parameter, which could be considered as a kinetic rate parameter; and n is the shape parameter, which describes the shape of the curve. The experimental data were fitted to the proposed model using a non-linear regression technique.
If n = 1, a first-order kinetics is obtained; n < 1 signifies a strong right skew of the distribution and the semi-logarithmic survival curve has a noticeable upward concavity. When n > 1, i.e., the semi-logarithmic survival curve has a marked downward concavity, the underlying distribution can have a left skew, depending on the value of B (Peleg and Cole, 1998).
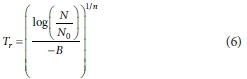
Predictions of the time for a given decrease in the microbial population (Tr) can be derived from Eq. 5 by Eq. 6:
Total mesophilic heterotrophic bacteria counts
Considering that M. aeruginosa is a non-axenic culture, heterotrophic bacteria in the M. aeruginosa culture were counted at the beginning and the end of the experiment. For that, 1 mL of serial dilution of culture was placed on plate count agar (PCA) using the plate pour procedure with incubation at 37°C for 24-48 h. This is the most used procedure for enumeration of total aerobic mesophilic heterotrophic microorganisms. Determinations were made in triplicate. An Ionomex colony counter was used to quantify the bacteria colony and the results were expressed as colony forming units for g (CFU∙mL-1).
[D-Leu1] MC-LR quantification
Aliquots of culture were submitted to ultrasonication for 30 min (Omni Ruptor 400) and then centrifuged for 15 min at 5 000 r∙min-1 to eliminate cell debris. The supernatant was passed through previously conditioned Sep-Pak C18 cartridges (Waters) (10 mL 100% methanol, 50 mL 100% distilled water); the MCs were then eluted with 80% methanol (Barco et al., 2005). Quantitative chromatographic analysis of MCs was performed by HPLC/MS Shimadzu LCMS-2020 to determine the principal component of [D-Leu1] MC-LR toxins (m/z 520) using C18 column (Hyperprep HS, 5-μm pore, 250 mm 10 mm) according to Giannuzzi et al. (2016). The column was equilibrated with a mixture that was composed of 65% A solution (water with 0.05% (v/v) trifluoroacetic acid) and 35% B solution (acetonitrile with 0.05% (v/v) formic acid). The mobile phase consisted of a discontinuous gradient of A and B solutions. Initial conditions were 100% B, followed by a linear gradient to 50% B in 1 min, isocratic elution min with 50% B for 5 min, then a linear gradient to 90% B for 15 min followed by isocratic elution with 90% B for 20 min and returning to initial conditions for 21 min followed by 9 min column equilibration with 0% B (total run time: 30 min). The flow rate was 1.0 mL∙min-1. Standard of MC-LR was purchased from Sigma (St Louis, MO, USA). [D-Leu]1 MC-LR was expressed as μg∙L-1.
Transmission electron microscopy (TEM)
The cells of the treated cultures and the control were centrifuged at 1 500 r∙min-1 for 10 min and fixed with 2% glutaraldehyde in phosphate buffer (pH 7.2-7.4) for 2 h at 4°C. A secondary fixation was performed with 1% osmium tetroxide (OsO4) for 1 h at 4°C. After graded alcohol dehydration, samples were embedded in epoxy resin. Sections were cut, stained with uranyl acetate and lead citrate and examined with a JEM 1200 EX II transmission electron microscope (JEOL Ltd., Tokyo, Japan) and photographed with an Erlangshen ES1000W camera, Model 785 (Gatan Inc., Pleasanton, California, USA) of the Central Service of Electronic Microscopy of the Faculty of Veterinary Sciences, UNLP.
Statistical analyses
The results of the experiments were presented as the mean (± standard deviation) of 3 independent determinations. Analysis of variance (ANOVA) and comparison tests according to the Fisher significant differences table (least significant difference) were applied with significance levels of 0.05. The statistical requirements for the ANOVA (normal distribution, homogeneity of variance and independence) were performed prior to executing ANOVA. The variables tested were k0 values for Chl-a assays and n and B parameters obtained by using the Weilbull model, and the factors were the different concentrations of each oxidant. The statistical software Systat (Systat version 5.0, Inc. Herndon, USA) was used. The different sets of data were obtained from the survival curves of M. aeruginosa after exposure to different oxidant concentrations. Non-linear regressions were carried out using Systat (Systat Inc., version 13.1, Washington, USA). The goodness-of-fit was evaluated by 2 parameters: coefficient of determination (R2) and the root-mean-square error (RMSE) defined in Eq. 7.
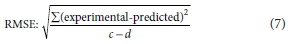
where 'experimental' is the experimental data, 'predicted' is the value predicted by the model, c is the number of experimental data, and d is the number of parameters of the assessed model. Lower RMSE values indicate a better fit of the model to describe the data (Snedecor and Cochran, 1969).
RESULTS
pH and residual oxidant concentration
The initial pH value of the system ranged between 8.0 and 9.0 and remained unchanged throughout the experiment. All concentrations of the oxidants added (HP, PAA and PCA) decreased to levels below the detection limit (0.1 mg∙L-1) after 72 h. This is in accordance with previous findings that the degradation of HP occurs in between 24 and 48 h (Bauzá et al., 2014).
No chlorine residual was detected in cultures at any doses used (1-5 mg∙L-1) after 72 h due to chlorine consumption within the first minute of contact. The rapid initial chlorine reactivity was attributed to the high concentration of cells and organic material in the culture.
Chlorophyll-a decay kinetics
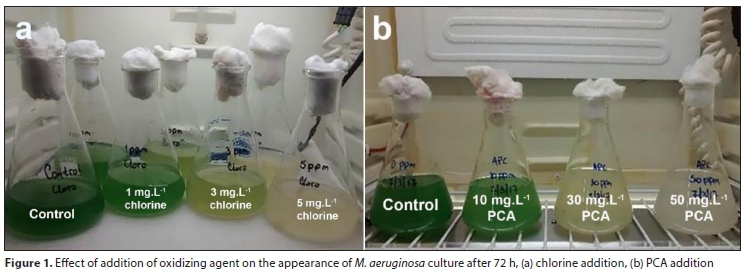
Chl-a is known to be an important indicator of algal biomass (Izydorczyk et al., 2009). Before the oxidant application, the initial Chl-a content in the culture was 2 514 µg∙L−1 (±545). There was a clear increase, of 2-fold, in the Chl-a content over time in the control samples at 72 h, reaching 4 750 µg∙L−1 (±550). When compared with the control, Chl-a values of M. aeruginosa culture were lower for all samples with oxidizing agent treatment at 72 h. Culture discoloration increased with an increase in the concentrations of the oxidizing agent. For example, Fig. 1 shows the culture appearance after 72 h of treatment with chlorine and PCA at all assayed concentrations.
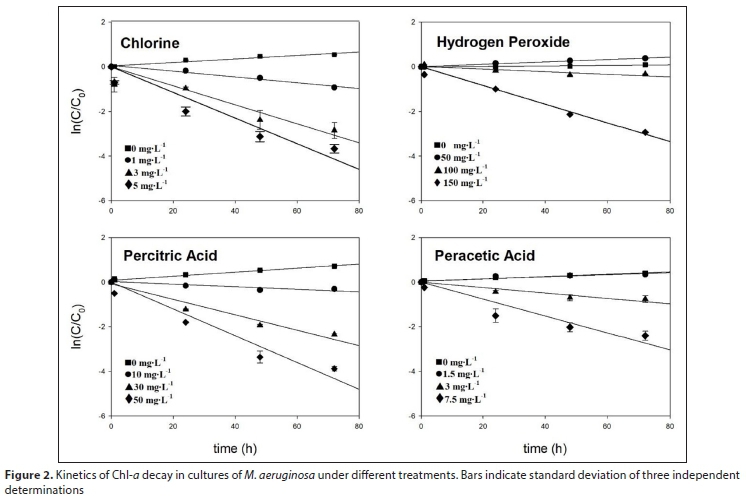
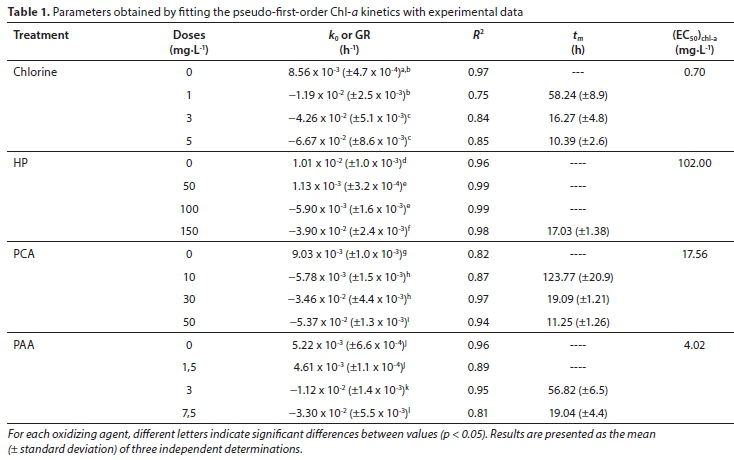
Figure 2 shows the Chl-a decay (as ln(C/C0)) vs. time under the different oxidant treatments. The value of k0 for each treatment was obtained by linear regression (Table 1). Statistically significant differences (p < 0.05) were observed for k0 values.
Table 1 also shows the growth rate (GR, positive values), which is the slope of the Chl-a increase. Control and samples treated with 50 mg∙L-1 of HP and 1.5 mg∙L-1 of PAA show positive GR values. The negative slope of the linear regression is Chl-a decay rate (k0). The k0 values increase when increasing the doses of oxidizing agent and this indicates a faster Chl-a decay. Chl-a decay is more pronounced under 5 mg∙L-1 of chlorine treatment, with higher k0 values (Table 1).
The time to reach half of the initial Chl-a concentration (tm) was calculated using Eq. 3. Positive growth rate values indicate absence of degradation of Chl-a, in which case tm was not calculated. As expected, for all oxidants, tm values decreased as oxidant concentration was augmented. The tm values ranged between 58.24 and 10.39 h for the treatment with chlorine. For experiments performed with HP, the tm value was 17.03 h at the highest concentration (150 mg∙L-1).
For PCA and PAA treatment, tm values ranged between 123.77 and 11.25 h and 56.82 and 19.04 h, respectively (Table 1). 5.0 mg∙L-1 chlorine was found to be the concentration of oxidant able to degrade the concentration of Chl-a to half its initial value in the shortest time (10.39 h). In order to take into account the effect of the addition of different concentrations of oxidants on k0 values, a linear regression was applied showing a good correlation (Eq. 4).
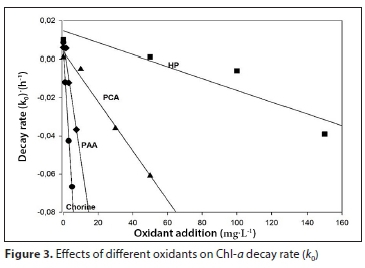
The fitting parameters were a = 5.4 x 10⁻³ (±3.1 x 10⁻³), b = −1.5 x 10⁻² (±1.0 x 10⁻³) and R2 = 0.991 for chlorine, a = 1.4 x 10⁻² (±8.1 x 10⁻³), b = −3.1 x 10⁻⁴ (±8.6 x 10⁻⁵) and R2 = 0.898 for HP treatment, a = 7.2 x 10⁻³ (±2.7 x 10⁻³), b = −1.3 x 10⁻³ (±8.9 x 10⁻⁵) and R2 = 0.990 for PCA and a = 4.1 x 10⁻³ (±8.9 x 10⁻³), b = −5.0 x 10⁻³ (±2.2 x 10⁻⁴) and R2 = 0.997 for PAA treatment (Fig. 3). Increase in Chl-a decay rate is indicated by more negative values of k0.
These parameters allow us to predict k0 values at concentrations that are different from those applied in the present study. An alternative way of evaluating the effects of oxidants on the degradation of Chl-a is through the effective concentration (EC50)Chl-a; the calculated values for each oxidant are presented in Table 1.
(EC50)Chl-a shows that, of the four oxidants applied, chlorine was the most effective, since it required the lowest concentration values (0.70 mg∙L-1), followed by PAA (4.02 mg∙L-1). Higher concentrations of the remaining two oxidants were required (17.56 mg∙L-1 for PCA and 102 mg∙L-1 for HP) (Table 1).
Effect of oxidants on M. aeruginosa cell viability and heterotrophic bacteria counts
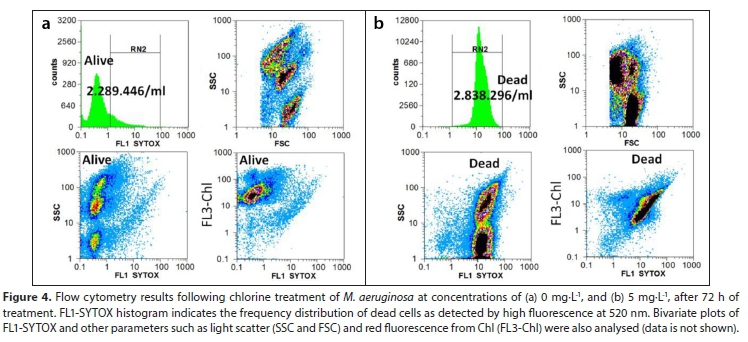
The initial M. aeruginosa cell concentration for the experiments was around 9 x 10⁵-1 x 10⁶ cells∙mL-1. The effect of oxidation by chlorine, HP, PCA and PAA on M. aeruginosa viability was quantitatively assessed for individual cells by flow cytometry. Individual dead cells were identified by staining them with the fluorescent probe SYTOX green, a dye that only stains nucleic acids when the cell membrane is damaged and permeable. Therefore, alive cells showed low SYTOX green fluorescence, and untreated cells represented negative controls as shown in Fig. 4a. In contrast, dead cells had high green fluorescence with a right-shifted fluorescence intensity frequency distribution, as shown Fig. 4b. Those cells that lay within region RN2 shown in Fig. 4, according to their SYTOX green fluorescence intensity were considered dead. A positive sample (treated high oxidant dose) where all cells are dead is shown in Fig. 4b. In Fig. 4a, most cells are outside the RN2, indicating they are alive, while a minor fraction lies within the RN2 region. The correlation plots, FSC vs. SSC, shown in Figs 4a and 4b illustrate that dead cells had lower FSC and lower SSC compared to live cells, while the correlation plots FL1 SYTOX vs. FL3-chl of the same panels show that dead cells had lower chlorophyll fluorescence than live cells. Therefore, live and dead cells were completely separated for each sample after using oxidizing agents. In addition, high SYTOX green fluorescence was also correlated to low SSC, FSC, and chlorophyll (FL3-chl).
Considering that M. aeruginosa is a non-axenic strain, the effect of oxidants on heterotrophic bacteria that coexist in the culture was also evaluated. For this purpose, the plate counts described in the materials and methods section were performed. In the control sample, the count of heterotrophic bacteria ranged from 7.0 x 10⁵-5.2 x 10⁵ CFU∙mL-1 at the beginning and the end of the experiment (72 h), respectively. A decrease in the counts of heterotrophic bacteria (0.85 to 1.02 log10) was observed in the treated samples with 1, 3 and 5 mg∙L-1 of chlorine. With HP and PCA a lower decrease in the counts of heterotrophic bacteria was observed (0.10-0.56 log10). With 1.5-7.5 mg∙L-1 of PAA treatment, a decrease in count ranging from 0.15-0.931 log10 was observed, with a higher microbial inhibitory effect as the oxidant concentration increased.
Modelling of M. aeruginosa decay
Using the flow cytometer, it was possible to evaluate the number of M. aeruginosa viable cells and thereafter generate the corresponding cell survival curves of the control cells and those obtained after treatment with chlorine, HP, PCA and PAA by plotting the log of survivors (expressed as log(N/N0)) against treatment time (Figs 5a, b, c and d, respectively). There were significant differences in the survival curves of M. aeruginosa, depending on the oxidant treatment. The decay of M. aeruginosa after oxidation by chlorine, HP, PCA and PAA exhibited both upward and downward concavity. Control experiments showed no cyanocidal effect on viable cells over 72 h exposures (Fig. 5). Treatment with 1 and 3 mg∙L-1 of chlorine resulted in approximately 0.5-log reduction (68%) in M. aeruginosa viability, whereas a 2.5-log reduction was observed with 5 mg∙L-1 of chlorine (99%) at the end of the experiment. Similar reductions were obtained with 50 mg∙L-1 of PCA and 7.5 mg∙L-1 of PAA (99%). A reduction of not more than 0.8-log (84%) was observed with the highest concentrations of HP (150 mg∙L-1) (Fig. 5).
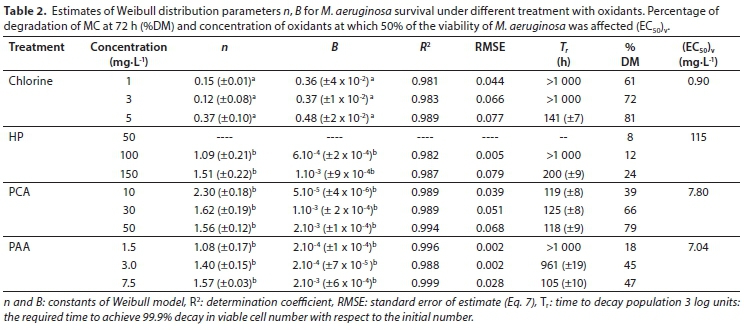
The effective concentration of the oxidant required to reduce the initial number of viable cells to half its value at the end of the experiment (72 h) was calculated (Table 2). For chlorine and HP treatment (EC50)v was 0.90 mg∙L-1 and 115 mg∙L-1, respectively. Similar values of (EC50)v (7.80-7.04 mg∙L-1) for viable cells were achieved with PCA and PAA, respectively (Table 2). Figure 5 also shows the fit of the Weibull model (Eq. 5). The control samples and those obtained with 50 mg∙L-1 of HP had a non-cyanocidal effect and showed a better fit with a linear model. The parameters were slope - 0.14 (±0.04) (positive values), and intercept - 0.0044 (±0.0002) with R2 of 0.89 for 50 mg∙L-1 of HP.
Table 2 shows the B and n parameters of the Weibull model for each treatment. The predicted values were consistent with experimental data having a determination coefficient (R2) ranging between 0.981 and 0.999 and RMSE less than 0.079 (Table 2). This shows that the Weibull model can explain between 98.1 and 99.9% of the variation in the experimental data.
The parameter B indicates how quickly M. aeruginosa is inactivated under different oxidant conditions (Van Boekel, 2002); it can be observed that B values increased with an increase in the concentrations of the oxidants. As expected, the n - or shape - parameter was less than 1 for chlorine inactivation curves, in accordance with the upward concavity. For other oxidants (HP, PCA and PAA), the n values were greater than 1 and a downward concavity was observed.
It is possible to predict the time of a given decrease in the microbial population according to Eq. 6, using the B and n parameters. In the present study, the time of a 3-log reduction (Tr) was selected as the time required for 99.9% decay in the number of viable cells with respect to the initial number. The Tr value is analogous to the classic D-value when a 3-log reduction (log(N/N0) = 3 or 99.9% of the reduction in viable cell number) was calculated (Manas and Pagan, 2005) and the values are shown in Table 2. For instance, the Tr values varied between 118 and 125 h for treatment with 10 and 50 mg∙L-1 of PCA, whereas a similar reduction required 105 h with 7.5 mg∙L-1 of PAA and 141 h with 5 mg∙L-1 of chlorine. HP (150 mg∙L-1) was the oxidizing agent that required the longest amount of time to achieve a 99.9% cell reduction (200 h) (Table 2).
Since M. aeruginosa is a non-axenic culture, the experimental system assayed can be considered to be heterogeneous (heterotrophic bacteria coexist, also presents a layer of polysaccharide mucilage) and these results can therefore be taken as a good correlation. The biological meaning of the n and B parameters of the Weibull model has been described by Peleg (2006). Upward concavity (n < 1) indicates that sensitive cells in the population die rapidly, leaving only the most resistant cells as survivors. Downward concavity of the survival curve (with n > 1) indicates that continued exposure and the resulting cumulative damage causes loss of resistance to the treatment and the cells die at progressively shorter times. Although the Weibull model is empirical, it can nevertheless be used to interpret the physiological effects of oxidizing agents on M. aeruginosa.
Relationship between Chl-a and viable cells of M. aeruginosa
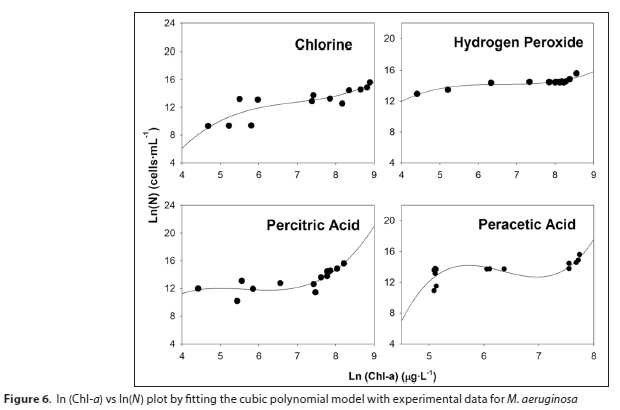
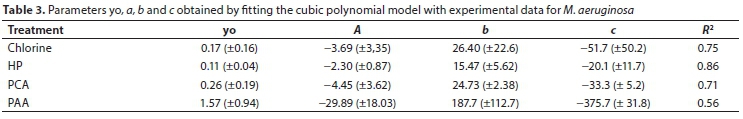
Several simple polynomial equations were tested to relate ln(Chl-a) vs ln(viable cells). A polynomial of third degree was found to successfully fit the data:

where N is M. aeruginosa number (cells∙mL-1), Chl-a (µg∙L-1) and yo, a, b and c are constants.
In Fig. 6 it is possible to observe the fitting of ln(Chl-a) vs ln(viable cells) values for each oxidant. Table 3 shows the parameters of polynomials and R2 values. A good correlation was obtained by applying the proposed model, with R2 ranging from 0.56-0.86. For the prediction of viable cells from experimental Chl-a values, it is possible to employ the polynomial model. Considering that Chl-a determination is easy, simple and inexpensive, the polynomial model allows prediction of the number of viable cells.
Toxin removal
The initial level of [D-Leu1] MC-LR in the culture of M. aeruginosa ranged between 50 and 200 µg∙L-1. No degradation of [D-Leu1] MC-LR was observed in the control samples. By contrast, [D-Leu]1 MC-LR had increased values ranging between 120 and 350 µg∙L-1 at the end of the experiment. After 72 h of exposure to HP, PCA and PCA, considerable [D-Leu]1 MC-LR degradation was observed (Table 2). The percentages of degradation of [D-Leu1] MC-LR relative to the initial values (%DM) are shown in Table 2. A 1-5 mg∙L-1 dose of chlorine was consumed very quickly, causing [D-Leu1] MC-LR release from Microcystis cells and significant degradation (61-81%). A chlorine dose of >5 mg∙L-1 can also augment disinfection by-product (DBP) concentrations (Fan et al., 2013) and increase health risks. A similar extent of degradation (66-79%) was achieved with 30-50 mg∙L-1 of PCA. By the end of the treatment, 45-47% degradation was obtained with 3.0-7.5 mg∙L-1 of PAA, and 24% with 150 mg∙L-1 of HP.
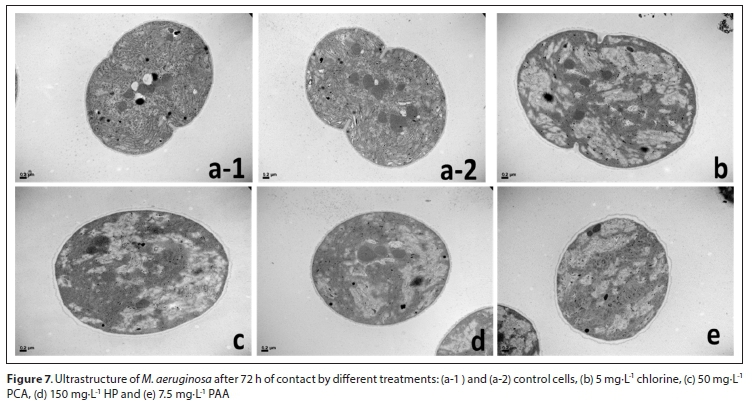
Transmission electron microscopy (TEM)
The control cells showed a dense and well-defined dense cytoplasm, without vacuolation zones and a conserved thylakoid net. The cytomembrane maintains its shape and structure (Figs 7 a-1 and a-2). In the treated cells, membrane deformation, less dense stroma, partial loss of the thylakoid net and extensive areas of cellular vacuolization can be observed. These damages to the cells are more evident in Fig. 7b, corresponding to cells treated with 5 mg∙L-1 of chlorine. Deformation, disintegration of thylakoids and cytoplasmic vacuolation were also observed after exposure with 50 mg∙L-1 PCA, 150 mg∙L-1 HP and 7.5 mg∙L-1 PAA (Fig. 7c, d and e).
DISCUSSION
One method used to assess the toxic action of oxidants on Chl-a degradation and cell viability is by calculating EC50. Depending on the endpoint (Chl-a or viability), chlorine proved to be the most effective oxidant since it produced the lowest EC50 values, varying between 0.70 and 0.90 mg∙L-1. For PAA, the values ranged from 4.02-7.04 mg∙L-1 and for PCA from 17.76-7.80 mg∙L-1 (Tables 1 and 2). HP produced the highest EC50 values, ranging from 102-115 mg∙L-1 (Tables 1 and 2). EC50 values ranging from 0.3 to 0.5 mg∙L−1 were found in the literature for another strain of M. aeruginosa treated with HP (Wang et al., 2012). For field-collected colonial M. aeruginosa, a relatively high EC50 of about 30 mg∙L−1 for HP has been previously reported (Wang et al., 2012). The high value of EC50 reported in the present work (102-115 mg∙L-1) could be due to the use of extremely high cyanobacteria concentrations tested (106 cell∙mL-1). In this study, the degradation of Chl-a by a first‐order kinetic model was successfully applied to the experimental data. The k0 values were higher with an increase in oxidant doses, indicating a faster Chl-a decay. Chlorine was the best oxidant treatment, followed by PAA and PCA, since it required a lower concentration of oxidant to produce a rapid and effective degradation of Chl-a. HP had the weakest effect on Chl-a degradation.
In addition, the Chl-a degradation model can be successfully applied to predict the Chl-a value for any concentration of oxidant in the range studied. For instance, for 80 mg∙L-1 of HP, it is possible to predict k0 values by Eq. 4 and the corresponding parameters a = 1.4.10-2 (± 8.1 x 10⁻³), b = −3.1 x 10⁻⁴ (±8.6 x 10⁻⁵) (Fig. 3). The calculated k0 is 1.08 x 10⁻² h-1, and then from Eq. 2, with Chl-a initial of 2 514 μg∙L-1 at 72 h of treatment, the predicted value of Chl-a is 1 155 μg∙L-1.
Chl-a decay was satisfactorily adjusted by means of linear regression kinetics but the kinetics of cell reduction was not linear. This is frequently the case when there is a mixture of oxidant-resistant and sensitive sub-populations of bacteria. This does not occur with the degradation of Chl-a, the latter being a chemical compound whose degradation is assumed to be a simple chemical event, unaffected by such factors as the high density of cells or the infrequent re-suspension of cells through stirring (Shaman and Lorenxen, 1975).
According to the Weibull model, concave upward (n < 1) survival curves of M. aeruginosa treated with different concentrations of chlorine can be interpreted as evidence that weak or sensitive members of the populations die at a relatively fast rate, leaving behind survivors with initial higher resistance and/or which have adapted to the oxidant stress (Peleg and Cole, 1998).
HP, PCA and PAA recorded 'n' values that were >1, which indicate that the remaining cells became increasingly susceptible to oxidants, and the cumulative damage made it increasingly difficult for them to survive. All oxidants tested inactivated M. aeruginosa by direct action through the formation of active oxidizing agents, such as hypochlorous acid, hypochlorite ion and other chlorine-containing oxidants and indirect oxidation by ROS.
Chlorination of heavily algae-laden water, especially in the presence of M. aeruginosa, may be very risky since chlorination can potentially cause severe cyanobacteria cell cytoclasis and MC-LR release. However, in the present study, 5 mg∙L-1 of chlorine produced a 77.0% degradation of [D-Leu1] MC-LR after 72 h; it took 141 h to reduce viable cells by 99.9%. Although not reported in the literature, it is likely that the effect of PCA and PAA on cyanobacteria is similar to that of HP, since they both produce HP in their reactions. Among peroxide treatments (HP, PCA and PAA), PCA (30-50 mg∙L-1) produced the highest level of MC degradation (66-79%) (Table 2). PAA (3.0-7.5 mg∙L-1) and HP (100-150 mg∙L-1) showed lower MC degradation values: 45-47% and 12-24%, respectively. These data therefore point to PCA as the peroxide of choice among those assayed.
It is important to note that PCA and PAA achieved the removal of more cells and a greater degradation of [D-Leu1] MC-LR than HP alone, probably because they contain HP (30% mass/volume) as part of the makeup of their compounds which could increase their toxicity for M. aeruginosa and degrade the released toxin.
The different peroxide treatments (HP, PCA and PCA) may have catalysed the production of hydroxyl and hydroperoxyl radicals that induced the oxidative cleavage of microcystins. MC-LR could be degraded into peptide residues by either modifying the Adda-moiety or breaking the amino-acid ring structure of the microcystins (Antoniou et al., 2008; Liu et al., 2003).
Hydrogen peroxide (HP) is selective for cyanobacteria (vs. eukaryotic algae and higher plants) and poses no serious long-term threats to the system because of its rapid decomposition without producing persistent toxic chemicals or by-products that cause aesthetic odour or colour issues (Matthijs et al., 2012). It has been reported that HP has potential for removing Microcystis spp. and MCs in different environments (Cornish et al., 2000; Drábková et al., 2007a; Barrington and Ghadouani, 2008; Wang et al., 2012).
It is possible that the oxidants initially reacted with the cell-bound mucilage before reaching the outer membrane. The M. aeruginosa CAAT2005-3 used in this work is a mucilage-producing cyanobacteria, the cells being embedded within a matrix of mucilage comprised of polysaccharides. The ratio of mucilage volume to cell volume has been reported to be 0.50 for M. aeruginosa CAAT2005-3 (Rosso et al., 2014). It is likely that the mucilage provides an oxidative demand that consumes OH radicals and protects the cell membrane from oxidative attack until sufficient damage accumulates on the cell surface to breach cell integrity.
It is not always possible to compare the results obtained in laboratory experiments with those obtained in the field since factors such as water quality and hydraulic conditions vary greatly and affect oxidation efficiency. The formation of OH radicals, for instance, and the decay of oxidants are influenced by pH, dissolved organic matter, inorganic radical scavengers, other possible contaminants and the presence of bacteria. Humic acid and nitrates, two common water solutes, can inhibit the processes of cellular inactivation and toxin degradation, due to the ROS scavenging and 'inner filter' effect. Furthermore, the formation of cyanobacterial colonies of different sizes under natural conditions and colonies with mucilage or sheaths may enhance cell resistance to oxidative stress (Huo et al., 2015). Variations in morphology, physical and biochemical characteristics between individual and colonial Microcystis cells were found (Fan et al., 2016). Such differences need to be considered when determining dose levels under real situations. Consequently, it is important to modify the parameters of oxidation (concentration and time) and include a full-scale trial based on the results of this study before application in natural waters.
CONCLUSION
The Weibull model showed a good fit to the data for the inactivation kinetics of M. aeruginosa in culture media and it was possible to predict the required exposure time to oxidants to achieve 99.9% reduction in viable cells. The shortest time of exposure was achieved with PCA (10-50 mg∙L-1) and required 118-125 h.
HP was the oxidant that required the longest time to achieve a 99.9% reduction (200 h). A concentration of 5 mg∙L-1 chlorine significantly reduced M. aeruginosa viability and was accompanied by a decline in the total microcystin concentrations (81%). The application of 7.5 mg∙L-1 of PAA presented a 47% degradation of [D-Leu1] MC-LR, and 150 mg∙L-1 of HP a 24% degradation. With 30-50 mg∙L-1 of PCA, a 66-79% degradation of [D-Leu1] MC-LR was obtained. These data therefore point to PCA as the peroxide of choice among those assayed. The present study also revealed that added chlorine and peroxide (HP, PCA and PAA) were degraded within 72 h and thus no residual values in the culture media were detected.
PCA and PAA could be considered as a possible strategy for bloom control due to the fact that they act as alternatives that offer low cost and less environmental impact. These are new oxidants that have been recently been applied at scale in a wastewater treatment plant. In this study, the oxidants have been shown to be effective in decreasing M. aeruginosa cells, degrading Chl-a and [D-Leu1] MC-LR in a culture medium. A full-scale trial based on the results of this study is necessary to complete the evaluation for treating water sources with cyanobacterial blooms.
ACKNOWLEDGEMENTS
This study was financially supported by University National of La Plata (UNLP X526), National Agency of Scientific and Technical Research (PICT0861-2013) and CONICET (PIP0959).
REFERENCES
AGUILERA A and ECHENIQUE RO (2017) Cyanobacteria nocivas de ambientes acuáticos continentales: taxonomía y ecología. In: Giannuzzi L (ed.) Cianobacterias como determinantes ambientales de salud. Ministerio de Salud. 27-48. ISBN 978-950-38-0255-7. [ Links ]
ANTONIOU MG, SHOEMAKER JA, DE LA CRUZ AA and DIONYSIOU DD (2008) Unveiling new degradation intermediates/pathways from the photocatalytic degradation of microcystin-LR. Environ. Sci. Technol. 42 8877-8883. https://doi.org/10.1021/es801637z. [ Links ]
APHA (2005) Standard Methods for Examination of Water and Wastewater (21st11 edn) (2005) American Public Health Association / American Water Works Association / Water Environment Federation, Washington, DC. [ Links ]
BARCO M, LAWTON LA, RIVERA J and CAIXACH J (2005) Optimization of intracellular microcystin extraction for their subsequent analysis by high-performance liquid chromatography. J. Chromatog. A. 1074 (1) 23-30. https://doi.org/10.1016/j.chroma.2005.03.087 [ Links ]
BARRINGTON DJ and GHADOUANI A (2008) Application of hydrogen peroxide for the removal of toxic cyanobacteria and other phytoplankton from wastewater. Environ. Sci. Technol. 42 (23) 8916−8921. https://doi.org/10.1021/es801717y [ Links ]
BARROIN G and FEUILLADE M (1986) Hydrogen peroxide as a potential algicide for Oscillatoria rubescens D.C. Water Res. 20 619-623. https://doi.org/10.1016/0043-1354(86)90026-6 [ Links ]
BAUZÁ L, AGUILERA A, ECHENIQUE R, ANDRINOLO D and GIANNUZZI L (2014) Application of hydrogen peroxide to the control of eutrophic lake systems in laboratory assays. Toxins. 6 2657-2675. https://doi.org/10.3390/toxins6092657 [ Links ]
BOOTH RA and LESTER JN (1995) The potential formation of halogenated by-products during peracetic acid treatment of final sewage effluent. Water Res. 29 1793-1801. https://doi.org/10.1016/0043-1354(94)00263-7 [ Links ]
CHUN H, KIM J, CHUNG K, WON M and SONG KB (2009) Inactivation kinetics of Listeria monocytogenes, Salmonella enterica serovar Typhimurium, and Campylobacter jejuni in ready-to-eat sliced ham using UV-C irradiation. Meat Sci. 83 599-603. https://doi.org/10.1016/j.meatsci.2009.07.007 [ Links ]
CORNISH BJ, LAWTON LA and ROBERTSON PKJ (2000) Hydrogen peroxide enhanced photocatalytic oxidation of microcystin-LR using titanium dioxide. Appl. Catal., B-Environ. 25 59-67. https://doi.org/10.1016/S0926-3373(99)00121-6 [ Links ]
CREBELLI R, CONTI L, MONARCA S, FERRETTI D, ZERBINI I, ZANI C, VESCHETTI E, CUTILLI D and OTTAVINI M (2005) Genotoxicity of the disinfection by-products resulting from peracetic acid or hypochlorite disinfected sewage wastewater. Water Res. 39 1105-1113. https://doi.org/10.1016/j.watres.2004.12.029 [ Links ]
DRÁBKOVÁ M, ADMIRAAL W and MARŠÁLEK MB (2007a) Combined exposure to hydrogen peroxide and light: Selective effects on cyanobacteria, green algae, and diatoms. Environ. Sci. Technol. 41 309-314. https://doi.org/10.1021/es060746i [ Links ]
FALSANISI D, GEHR R, SANTORO D, DELL'ERBA A, NOTARNICOLA M and LIBERTI L (2006) Kinetics of PAA demand and its implications on disinfection of wastewaters. Water Qual. Res. 41 398-409. https://doi.org/10.2166/wqrj.2006.043 [ Links ]
FAN J, HO L, HOBSON P and BROOKES J (2013) Evaluating the effectiveness of copper sulphate, chlorine, potassium permanganate, hydrogen peroxide and ozone on cyanobacterial cell integrity. Water Res. 47 (14) 5153−5164. https://doi.org/10.1016/j.watres.2013.05.057 [ Links ]
FAN J, RAO L, CHIU Y and LIN T (2016) Impact of chlorine on the cell integrity and toxin release and degradation of colonial Microcystis. Water Res. 102 394-404. https://doi.org/10.1016/j.watres.2016.06.053 [ Links ]
GIANNUZZI L, KROCKC B, CRETTAZ MINAGLIA MC, ROSSO L, HOUGHTON C, SEDAN D, MALANGA G, ESPINOSA M, ANDRINOLO D and HERNANDO M (2016) Growth, toxin prod-uction, active oxygen species and catalase activity of Microcystis aeruginosa (Cyanophyceae) exposed to temperature stress. Comp. Biochem. Physiol. B. 189 22-30. https://doi.org/10.1016/j.cbpc.2016.07.001 [ Links ]
GONZÁLEZ M, SKANDAMIS PN and HÄNNINEN M (2009) A modified Weibull model for describing the survival of Campylobacter jejuni in minced chicken meat. Int. J. Food Microbiol. 136 52-58. https://doi.org/10.1016/j.ijfoodmicro.2009.09.022 [ Links ]
HARKE M, STEFFEN M, GOBLER C, OTTEN T, WILHELM S, WOODF S and PAERL H (2016) A review of the global ecology, genomics, and biogeography of the toxic cyanobacterium, Microcystis spp. Harmful Algae. 54 4-20. https://doi.org/10.1016/j.hal.2015.12.007 [ Links ]
HUO X, CHANG D, TSENG J, BURCH M and LIN T (2015) Exposure of Microcystis aeruginosa to hydrogen peroxide under light: Kinetic modeling of cell rupture and simultaneous Microcystin degradation. Environ. Sci. Technol. 49 5502−5510. https://doi.org/10.1021/acs.est.5b00170 [ Links ]
IZYDORCZYK I, CARPENTIER K, MRÓWCZYŃSKI J, WAGENVOORT A, JURCZAK T and TARCZYŃSKA M (2009) Establishment of an alert level framework for cyanobacteria in drinking water resources by using the algae online analyser for monitoring cyanobacterial chlorophyll-a. Water Res. 43 989-996. https://doi.org/10.1016/j.watres.2008.11.048 [ Links ]
JÖHNK KD, HUISMAN J, SHARPLES J, SOMMEIJER B, VISSER PM and STROOM JM (2008) Summer heatwaves promote blooms of harmful cyanobacteria. Glob. Change Biol. 14 495-512. https://doi.org/10.1111/j.1365-2486.2007.01510.x [ Links ]
KOSTEN S, HUSZAR VLM, BÉCARES E, COSTA LS, VAN DONK E, HANSSON LA, JEPPESEN E, KRUK C, LACEROT G, MAZZEO N, DE MEESTER L and co-authors (2012) Warmer climates boost cyanobacterial dominance in shallow lakes. Glob. Change Biol. 18 118-126. https://doi.org/10.1111/j.1365-2486.2011.02488.x [ Links ]
LEFEVRE F, AUDIC JM and FERRAND F (1992) Peracetic acid disinfection of secondary effluents discharged off coastal seawater. Water Sci. Technol. 25 155-163. https://doi.org/10.2166/wst.1992.0347 [ Links ]
LIU I, LAWTON LA and ROBERTSON PKJ (2003) Mechanistic studies of the photocatalytic oxidation of microcystin-LR: an investigation of byproducts of the decomposition process. Environ. Sci. Technol. 37 3214-3219. https://doi.org/10.1021/es0201855 [ Links ]
MANAS P and PAGAN R (2005) Microbial inactivation by new technologies of food preservation. J. Appl. Microbiol. 98 (6) 1387-1399. https://doi.org/10.1111/j.1365-2672.2005.02561.x [ Links ]
MAFART P, COUVERT O, GAILLARD S and LEGUERINEL I (2002) On calculating sterility in thermal preservation methods: application of the Weibull frequency distribution model. Int. J. Food Microbiol. 72 107-113. https://doi.org/10.1016/S0168-1605(01)00624-9 [ Links ]
MARKER AFH, CROWTHER CA and GUNN RJM (1980) Methanol and acetone as solvents for estimating chlorophyll a and phaeopigments by spectrophotometry. Arch. Hydrobiol. Beih. Ergebn. Limnol. 14 52-69. [ Links ]
MATTHIJS H, VISSER P, REEZE B, MEEUSE J, SLOT P, WIJN G, TALENS R and HUISMAN J (2012) Selective suppression of harmful cyanobacteria in an entire lake with hydrogen peroxide. Water Res. 46 1460-1472. https://doi.org/10.1016/j.watres.2011.11.016 [ Links ]
MATTHIJS H, JANČULA D, VISSER P and MARŠÁLEK B (2016) Existing and emerging cyanocidal compounds: new perspectives for cyanobacterial bloom mitigation. Aquat Ecol. 50 443-460. https://doi.org/10.1007/s10452-016-9577-0 [ Links ]
MONARCA S, RICHARDSON SD, FERETTI D, GROTTOLO M, THRUSTON AD, ZANI C, NAVAZIO G, RAGAZZO P, ZERBINI I and ALBERTI A (2002) Mutagenicity and disinfection byproducts in surface drinking water disinfected with peracetic acid. Environ. Toxicol. Chem. 21 309-318. https://doi.org/10.1002/etc.5620210212 [ Links ]
PAERL HW and HUISMAN J (2008) Blooms like it hot. Science. 320 57-58. https://doi.org/10.1126/science.1155398 [ Links ]
PAERL HW and OTTEN TG (2013) Harmful cyanobacterial blooms: causes, consequences, and controls. Microbial Ecol. 65 995-1010. https://doi.org/10.1007/s00248-012-0159-y [ Links ]
PELEG M and COLE MB (1998) Reinterpretation of microbial survival curves. Crit. Rev. Food Sci. Nutr. 38 353-380. https://doi.org/10.1080/10408699891274246 [ Links ]
PELEG M (2006) Advanced Quantitative Microbiology for Foods and Biosystems: Models for Predicting Growth and Inactivation. CRC Series in Contemporary Food Science. CRC Press, Boca Raton, FL. https://doi.org/10.1201/9781420005370 [ Links ]
PINKENELL U, KARST U and CAMMAN K (1994) Determination of peroxyacetic acid using high-performance liquid chromatography with external calibration. Anal. Chem. 66 (15) 2599-2602. https://doi.org/10.1021/ac00087a028 [ Links ]
ROSITANO J, NEWCOMBE G, NICHOLSON B and SZTAJNBOK P (2001) Ozonation of NOM and algal toxins in four treated waters. Water Res. 35 (1) 23-32. https://doi.org/10.1016/S0043-1354(00)00252-9 [ Links ]
ROSSO L, SEDAN D, KOLMAN M, CAIXACH J, FLORES C, OTEIZA JM, SALERNO G, ECHENIQUE R, GIANNUZZI L and ANDRINOLO D (2014) Microcystis aeruginosa strain [D-Leu1] Mcyst-LR producer, from Buenos Aires province, Argentina. J. Coast Life Med. 2 (4) 287-296. [ Links ]
SHAMAN R and LORENXEN C (1975) Quantitative degradation of chlorophyll by a marine herbivore. Limnol. Oceanogr. 4 (20) 580-586. https://doi.org/10.4319/lo.1975.20.4.0580 [ Links ]
SNEDECOR GW and COCHRAN W G (1969) Statistical Methods (6th edn). University Press, Iowa. [ Links ]
STANFORD B, ADAMS C, ROSENFELDT E, AREVALO E and REINERT A (2016) CyanoTOX: tools for managing cyanotoxins in drinking water treatment with chemical oxidants. J. Am. Water Works Assoc. 108 412-446. https://doi.org/10.1155/2019/3231473 [ Links ]
TASHYREVA D, ELSTER J and BILLI D (2013) A novel staining protocol for multiparameter assessment of cell heterogeneity in phormidium populations (cyanobacteria) employing fluorescent dyes. PLoS One 8 e55283. https://doi.org/10.1371/journal.pone.0055283 [ Links ]
UENO Y, NAGATA S, TSUTSUMI T, HASEGAWA A, WATANABE MF, PARK HD, CHEN GC, CHEN G and YU SZ (1996) Detection of microcystins, a bluegreen algal hepatotoxin, in drinking water sampled in Haimen and Fusui, endemic areas of primary liver cancer in China, by highly sensitive immunoassay. Carcinogenesis. 17 1317-1321. https://doi.org/10.1093/carcin/17.6.1317 [ Links ]
USEPA (United States Environmental Protection Agency) (2015) Drinking Water Health Advisory for the Cyanobacterial Microcystin Toxins. USEPA, Washington DC. https://www.epa.gov/cyanohabs/epa-drinking-water-health-advisories-cyanotoxins [ Links ]
VAN BOEKEL MAJS (2002) On the use of the Weibull model to describe thermal inactivation of microbial vegetative cells. Int. J. Food Microbiol. 74 139-159. https://doi.org/10.1016/S0168-1605(01)00742-5 [ Links ]
WANG Z, LI D, QIN H and LI Y (2012) An integrated method for removal of harmful cyanobacterial blooms in eutrophic lakes. Environ. Pollut. 160 34-41. https://doi.org/10.1016/j.envpol.2011.09.003 [ Links ]
WESTRICK JA, SZLAG DC, SOUTHWELL BJ and SINCLAIR J (2010) A review of cyanobacteria and cyanotoxins removal/inactivation in drinking water treatment. Anal. Bioanal. Chem. 397 1705-1714. https://doi.org/10.1007/s00216-010-3709-5 [ Links ]
WHO (World Health Organization) (1999) http://www.who.int/water_sanitation_health/resourcesquality/toxcyanchap5.pdf [ Links ]
ZAMYADI A, DORNER S, SAUVE S, ELLIS D, BOLDUC A, BASTIEN C and PREVOST M (2013) Species-dependence of cyanobacteria removal efficiency by different drinking water treatment processes. Water Res. 47 2689-2700. https://doi.org/10.1016/j.watres.2013.02.040 [ Links ]
ZHAO Y, XIE P and ZHANG X (2009) Oxidative stress response after prolonged exposure of domestic rabbit to a lower dosage of extracted microcystins. Environ. Toxicol. Pharmacol. 27 195-199. https://doi.org/10.1016/j.etap.2008.10.005 [ Links ]
 Correspondence:
Leda Giannuzzi
Email: leda@biol.unlp.edu.ar
Received: 12 July 2019
Accepted: 29 June 2020
* These authors contributed equally to this work.

