


Services on Demand
Article
 English (pdf)
 Article in xml format
 Article references
Indicators

Related links
-
 Cited by Google
 -
 Similars in Google
Share

 Permalink
Water SA
On-line version ISSN 1816-7950
Print version ISSN 0378-4738
Water SA vol.46 n.3 Pretoria Jul. 2020
http://dx.doi.org/10.17159/wsa/2020.v46.i3.8657
RESEARCH PAPERS
Design optimization of water distribution networks: real-world case study with penalty-free multi-objective genetic algorithm using pressure-driven simulation
Tiku T TanyimbohI, II; Alemtsehay G SeyoumII, III
ISchool of Civil and Environmental Engineering, University of the Witwatersrand, Johannesburg, Private Bag 3, WITS 2050, South Africa
IIDepartment of Civil and Environmental Engineering, University of Strathclyde Glasgow, 5th Floor, James Weir Building, 75 Montrose Street, Glasgow G1 1XJ, United Kingdom
IIISWS Consultancy, Megenaga-CMC Road, Abenezer Building, PO Box 11351, Addis Ababa, Ethiopia
ABSTRACT
Water distribution systems are an integral part of the economic infrastructure of modern-day societies. However, previous research on the design optimization of water distribution systems generally involved few decision variables and consequently small solution spaces; piecemeal-solution methods based on pre-processing and search space reduction; and/or combinations of techniques working in concert. The present investigation was motivated by the desire to address the above-mentioned issues including those associated with the lack of high-performance computing (HPC) expertise and limited access in developing countries. More specifically, the article's aims are, firstly, to solve a practical water distribution network design optimization problem and, secondly, to develop and demonstrate a generic multi-objective genetic algorithm capable of achieving optimal and near-optimal solutions on complex real-world design optimization problems reliably and quickly. A multi-objective genetic algorithm was developed that applies sustained and extensive exploration of the active constraint boundaries. The computational efficiency was demonstrated by the small fraction of 10-245 function evaluations relative to the size of the solution space. Highly competitive solutions were achieved consistently, including a new best solution. The water utility's detailed distribution network model in EPANET 2 was used for the hydraulic simulations. Therefore, with some additional improvements, the optimization algorithm developed could assist practitioners in day-to-day planning and design
Keywords: water distribution system, pressure-driven dynamic simulation, constrained multi-objective genetic algorithm, feasible and infeasible frontier optimal sets, generational distance, active constraint boundaries
INTRODUCTION
Water distribution systems, as part of the indispensable economic infrastructure of modern societies, should be designed, maintained and operated in an economical and sustainable way. Multi-objective evolutionary optimization algorithms are widely used for design purposes, as they yield a range of efficient candidate solutions that provide the decision makers with the vital flexibility that is needed when appraising and selecting the final solutions (Li et al., 2015). Other advantages of multi-objective evolutionary optimization algorithms are that the objective and constraint functions of the optimization problem need not be differentiable or continuous, discrete and mixed decision variables and non-convex problems can be handled relatively easily and, by deploying a population of candidate solutions simultaneously, the chances of achieving the global optimal or near-optimal solutions are greatly increased.
Evolutionary optimization algorithms operate on populations of solutions that may include both feasible and infeasible solutions. To address constraint violations when optimizing water distribution systems, penalty-based methods have been applied widely (Broad et al., 2005; Ostfeld and Tubaltzev, 2008). The major drawback of the penalty-based approaches is that additional case-specific parameters are required (Ayvaz and Kentel, 2015; Ostfeld and Tubaltzev, 2008; Kang and Lansey, 2012), the calibration of which is generally very challenging (Moosavian and Lence, 2017; Siew et al., 2014; Saleh and Tanyimboh, 2013, 2014; Siew and Tanyimboh, 2012a; Dridi et al., 2008; Prasad and Park, 2004).
Thus, some of the constraint-handling methods in the literature are: (i) penalties imposed on infeasible solutions to reduce their fitness; (ii) constraint dominance tournaments that, essentially, impede the survival and propagation of infeasible solutions (Deb et al., 2002); (iii) replacement of infeasible solutions with new solutions created randomly (Tersi et al., 2015); (iv) repair of infeasible solutions (Chootinan and Chen, 2006); and (v) stochastic ranking that involves binary tournaments and probabilistic penalty functions (Runarsson and Yao, 2000). While constraint dominance tournaments may have a strong practical appeal based on the ease of implementation, they tend to reduce diversity in the population of candidate solutions too quickly (Liu et al., 2010; Eskandar et al., 2012; Sheikholeslami and Talatahari, 2016), which, in turn, impedes the progress of the optimization through lack of diversity in the gene pool. Repairing infeasible solutions and designing penalty functions are, generally, extremely challenging, while replacing infeasible solutions is wasteful (Oyama et al., 2007; Ray et al., 2009; Woldesenbet et al., 2009; Yen, 2009), as the information content of the infeasible solutions is not harnessed.
Furthermore, when applied to real-world problems, multi-objective evolutionary optimization algorithms commonly require computationally intensive simulation models that are time-consuming to execute. Moreover, for complex optimization problems such as the design of real-world water distribution networks, the amount of time needed for the simulations can be prohibitive as, typically, the number of function evaluations or simulations required is very large. Thus, a major challenge concerning evolutionary algorithms in the context of the design optimization of water distribution systems is that the algorithms are computationally demanding and particularly difficult to implement when applied to large real-world networks with multiple operating conditions that generally require dynamic or extended period simulation (Van Zyl et al., 2004; Broad et al., 2010; Kang and Lansey, 2012; Sheikholeslami and Talatahari, 2016).
Even with the latest powerful workstations, a single execution of an evolutionary optimization algorithm may require many days or several weeks or more, depending on the problem at hand. Moreover, the solution space of the optimization problem is frequently enormous and, consequently, instances of premature convergence are common. Therefore, to be confident that any solutions achieved are reasonably optimal, the algorithms are normally executed many times. This is the reason that HPC (high-performance computing) facilities are frequently used to overcome the problem (Barlow and Tanyimboh, 2014; Seyoum et al., 2015; Tanyimboh and Seyoum, 2016). However, most researchers and practitioners lack access to HPC facilities and the necessary expertise, which holds true in South Africa also.
One way of addressing this difficulty involves using parallel algorithms, which inherently are computationally more efficient (Trobec et al., 2009). Two common approaches for parallel algorithms are the controller-worker and island models. The controller-worker model is popular due to the relative ease of implementation (Alba, 2005; Castillo et al., 2008; Cantu-Paz, 2000). It employs a single population with the fitness evaluation carried out in parallel by assigning a fraction of the population to different processors. It is very efficient, particularly for problems in which the fitness evaluation is computationally demanding (Cantu-Paz and Goldberg, 2000), and achieves significant speed-up, if the communication costs are small when compared to the computation costs (Kumar et al., 2006; Cantu-Paz and Goldberg, 2000).
In the island model, the candidate solutions are divided into sub-populations that evolve independently and may exchange some solutions that are called migrant solutions occasionally. When designed well, it can solve very complex problems for which the serial algorithm performs poorly regardless of the search duration (Back et al., 1997; Tang et al., 2007). However, the island model is much more difficult to design (Cantù-Paz and Goldberg, 2000), and its practical application is not straightforward as it involves several parameters that require calibration, e.g., the size of the sub-populations, frequency of migration, number of migrant solutions and their destinations, etc. (Artina et al., 2012). It is worth noting again that evolutionary optimization algorithms commonly apply penalties to address constraint violations (Piratla and Ariaratnam, 2012; Moosavian and Lence, 2017). Moreover, the development and calibration of the penalty functions on a case-by-case basis is particularly challenging (Dridi et al., 2008; Gibbs et al., 2015). This increases the overall complexity of the calibration effort further, when considered alongside the parameters of the underlying evolutionary algorithm that generally require calibration also.
In any case, applications of parallel evolutionary optimization algorithms in the design of water distribution systems are surprisingly lacking in the literature. Moreover, applications of evolutionary optimization algorithms that address complex design problems based on real-world water distribution systems are also lacking. Such problems often involve large networks, enormous solution spaces, time-varying demands, multiple operating conditions, extended period simulation, etc. Indeed, Kang and Lansey (2012) observed that studies on the optimization of water distribution systems in the preceding three decades had focused mainly on the applications of new optimization techniques (e.g. Ostfeld and Tubaltzev, 2008; Wu et al., 2013; Moosavian and Lence, 2017) to relatively simple systems. For example, Ewald et al. (2008) applied an island model to optimize the locations of booster chlorination stations. Artina et al. (2012) employed both the controller-worker and island models to optimize the design of a water distribution network. They observed that frequent exchanges of good solutions improved the results. Barlow and Tanyimboh (2014) used the controller-worker model to execute a single optimization run while the island model performed multiple independent optimization runs simultaneously.
Following Walski (1995), Kang and Lansey (2012) characterised three levels of water supply and distribution planning and design as follows. The master planning scale (Level 1) considers large-scale infrastructure that includes water treatment plants and major trunk mains (e.g. the New York City Water Supply Tunnels and Hanoi network in the literature). The second level of planning and design (Level 2, e.g., the hypothetical Anytown network in the literature) considers the transmission mains that distribute water between and within water supply zones (i.e. demand management areas or pressure zones). The third level of planning and design (Level 3) involves the distribution network that supplies individual households. Kang and Lansey (2012) also emphasised that, although water distribution network models having thousands of pipes were the focus of network modelling or simulation (as distinct from optimization) in the water industry nowadays, the distribution network (i.e. Level 3) generally has not been considered in design optimization studies, as the problems are extremely difficult to solve.
Several examples illustrate the point further. Kang and Lansey (2012) optimized the diameters of a water distribution network using steady state rather than dynamic simulation to solve the problem in two stages by applying a heuristic technique followed by a genetic algorithm. It is important to note that the optimized solutions they achieved using the heuristic technique were then used as the starting point for the genetic algorithm. Price and Ostfeld (2016) and Stokes et al. (2016) optimized pump scheduling only, without optimizing the diameters of the pipes. Also, several studies (e.g. Barlow and Tanyimboh, 2014, etc.) have optimized the diameters of the Balerma irrigation network using hybrid algorithms. Hybrid algorithms combine multiple optimization strategies, as in Sheikholeslami and Talatahari (2016), for example. Finally, Moosavian and Lence (2017) applied a non-dominated sorting differential evolution algorithm to hypothetical networks only. Thus, the above-mentioned investigations mainly considered problems that were relatively easy to solve. The formulations generally involved: (i) few decision variables and consequently small solution spaces; (ii) piecemeal solution methods based on pre-processing and search space reduction (Abdy Sayyed et al., 2019); or (iii) combinations of techniques working in concert.
The present investigation was motivated by the desire to address the above-mentioned weaknesses, including issues associated with limited HPC expertise and access in developing countries, e.g., South Africa. Accordingly, this article considers the multi-objective evolutionary design optimization of water distribution networks. The multi-objective genetic algorithm developed utilises extended period simulation based on a pressure-driven analysis model through which the constraints of the optimization problem are addressed seamlessly, efficiently and reliably. More specifically, the article's aims are, firstly, to solve a practical water distribution network design optimization problem and, secondly, to develop and demonstrate a generic multi-objective genetic algorithm capable of achieving optimal and near-optimal solutions on complex real-world design optimization problems reliably and quickly. Moreover, the quantified evaluation of the algorithm's performance is extended herein to cover not just the least-cost feasible solution but, also, the whole Pareto-optimal front.
MATERIALS AND METHODS
Design optimization model
The algorithm developed is based on a multi-objective evolutionary optimization algorithm in Siew and Tanyimboh (2012a). A key feature of the algorithm is that it exploits feasible and infeasible individuals in the population of candidate solutions equally with respect to constraint violations using pressure-driven analysis. Essentially, the proposed formulation provides a level playing field for all the feasible and infeasible candidate solutions. This has the added advantage of promoting greater diversity among the candidate solutions by allowing non-dominated infeasible solutions to survive until the end of the optimization process. Thus, an enhanced and sustained boundary search also takes place through the development and evolution of sub-populations of near-optimal feasible and infeasible solutions (Saleh and Tanyimboh, 2013, 2014, 2016).
Pressure-driven analysis of water distribution networks considers the relationship between the flow and pressure at a demand node (Tanyimboh et al., 1997). Thus, an infeasible solution does not satisfy the nodal pressures and demands in full and the shortfall in the flow delivered provides a direct measure of its infeasibility. In this way, the hydraulic simulations address the minimum node pressure constraints efficiently, reliably and seamlessly. A pressure-driven extension of EPANET 2 (Siew and Tanyimboh, 2012b) was adopted.
Moosavian and Lence (2017) reported that the non-dominated sorting differential evolution (NSDE) algorithm outperformed all other algorithms on randomly generated hypothetical networks as opposed to real-world and benchmark networks in the literature. However, NSGA II (Deb et al., 2002) achieved better results than NSDE at high cost levels on benchmark networks. Indeed, NSGA II is the most popular multi-objective evolutionary optimization algorithm. Moosavian and Lence (2017) reported that it has weaknesses, such as unstable and slow convergence and difficulties in escaping from local optima. By contrast, the methodology in Siew and Tanyimboh (2012a) solved various benchmark problems in the literature successfully (Siew et al., 2014; 2016) and was highly competitive compared to all other algorithms, considering the quality of the solutions achieved and computational efficiency.
Minimising the total capital and operating cost and maximising hydraulic performance are the conflicting objectives of the optimization model. The decision variables typically include pipe diameters that are selected from a set of commercially available discrete pipe sizes. Depending on the nature of the optimization problem, other decision variables and/or components (e.g. pumps and tanks) may be included readily if required (Siew et al., 2016). It was assumed that the system's topological properties were pre-specified and thus topological optimization (Phan et al., 2013; Saleh and Tanyimboh, 2013; 2014) was not considered.
The cost objective function was:

where Np is the population size; i and (i) refer to ith solution; and χi is the ratio of the cost of solution i to the cost of the most expensive solution in the current generation. Thus:

with Ci the cost of solution i.
The hydraulic performance objective function was:

For solution i, σj,i represents the hydraulic performance property that is the ratio of the available flow to the required flow, for time step j of duration tj. The function f2 is thus the time-weighted mean value of the demand satisfaction ratio (Ackley et al., 2001) of the network for an operating cycle.
The exponent values of 2 and 4 in Eqs 1 and 3, respectively, were derived empirically in Siew and Tanyimboh (2012a). Both objective functions take values from zero to 1.0. A solution that has a demand satisfaction ratio that is less than 1.0 is infeasible in the sense that it cannot satisfy all nodal demands in full. Conversely, the demands are satisfied in full if the distribution network delivers the required flow and pressure in full (Germanopoulos, 1985).
The constraints of the design optimization problem were the equations for conservation of mass and energy, and specified minimum pressures at the demand nodes and fire hydrants. The energy and mass conservation equations were satisfied in the hydraulic simulation model. The minimum node pressure constraints were addressed in the hydraulic performance function f2. Accordingly, all candidate solutions were rated using Pareto-dominance based on the actual cost and hydraulic performance only, without recourse to any additional constraint-handling procedures.
Solution quality and optimality measure
The algorithm's ability to provide optimal solutions reliably was investigated. The generational distance parameter (Veldhuizen and Lamont, 1998) may be used to quantify the average distance between a given set of non-dominated solutions and the Pareto front. Thus:

where GD is the generational distance; and Np is the number of non-dominated solutions. di is the distance in the objective space between the ith non-dominated solution and the nearest solution of the Pareto-optimal set; i.e.:
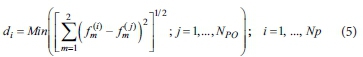
where  is the value of the mth objective function for the ith non-dominated solution;
  is the value of the mth objective function for the jth Pareto-optimal solution; and NPO is the number of solutions in the Pareto-optimal front.
The optimized solutions achieved were normalised for the results appraisal as follows, to ensure that subsequent comparisons based on Eqs 4 and 5 would be equitable. Accordingly:

in which the function fn normalises the function f; m and i refer to the mth objective function and ith solution, respectively; 'max' and 'min' refer to the largest and smallest values of fm achieved, respectively.
Computational solution and software implementation
The optimization problem was solved with the genetic algorithm developed. Binary coding was used for the pipe diameters as the decision variables. The genetic operators used comprised single-point crossover, single-bit mutation and binary tournament selection for crossover. Figure 1 summarises the parallel computer program developed in C++ using Message Passing Interface (MPI) routines. Microsoft HPC pack 2008 was used to run the program in Microsoft Visual Studio (version 2010).
The crowding distance parameter in Fig. 1 is a measure of the spatial density of the solutions in the objective space, that is used to help achieve a relatively uniform distribution of the solutions in the Pareto-optimal front (Deb et al., 2002). Thus, when the number of solutions in the leading non-dominated front exceeds the population size, the crowding distance is applied, as an auxiliary criterion besides the non-domination rank, to help reduce the over-representation of the solutions from the relatively more densely populated regions of the solution space. In the implementation of the crowding distance herein, to enhance further the boundary search properties of the algorithm, 30% of the solutions in the next generation comprised the least expensive feasible solutions while the remaining 70% were obtained using the crowding distance (Siew and Tanyimboh, 2012a).
The controller-worker model was adopted as the fitness evaluation that involved extended period simulation was computationally very demanding and communication costs were small compared to the computation costs (Cantu-Paz and Goldberg, 2000; Kumar et al., 2006). All the processors including the controller processor shared the fitness evaluation of the child population equally (Fig. 1). Additionally, the controller processor performed the operations of selection, crossover and mutation along with the rest of the procedures of the algorithm.
Illustrative example
Network data and problem specifications
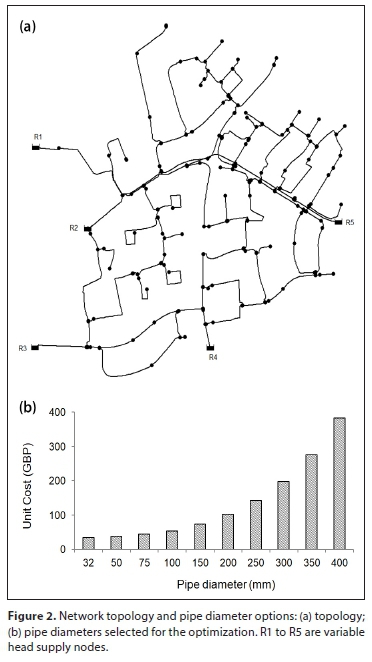
The example presented here for demonstration purposes is based on the water distribution network in Fig. 2 that is part of a water distribution system in the UK. The calibrated EPANET 2 network model and GIS database having the network and operational data were obtained from the water utility. The respective averages of the heads at the five supply nodes R1 to R5 were: 130.33, 129.94, 129.85, 129.88 and 130.32 m. The water distribution network comprised 251 pipes, 228 demand nodes of which 29 were fire hydrants, 5 variable-head supply nodes, and there were 3 demand categories as detailed in Seyoum and Tanyimboh (2014). The calibrated model of the network comprised 31 h of operation with a hydraulic time step of 1 h and a fire demand at a different location in each hour of operation except during the first and last hour. The pipe data included 28 pipe sizes and their respective costs per unit length, etc.
The minimum residual head required was 20.0 m for all demand nodes and 3.0 m for all fire hydrants, for a fire flow of 8.0 L/s. Velocity constraints were not included in the optimization model, as they were not prescribed. However, based on the British Standard for Water Supply Requirements for Systems and Components Outside Buildings (BS EN 805:2000), velocities of 0.5 to 2.0 m/s may be appropriate. In special circumstances, e.g., fire flows, velocities of up to 3.5 m/s may be acceptable. The velocities were examined, accordingly, in the post-optimization evaluation.
The optimization problem was cast as the design of a new network as opposed to the rehabilitation and/or upgrading and capacity expansion of a pre-existing network. The reason is that the existing network already had enough capacity as the pipe diameters had previously been optimized using commercial software. Therefore, the real aim of the optimization herein was to reveal the amount of spare capacity/redundancy in the system, if any, by determining the extent to which the cost could be reduced further.
Hydraulic simulation details
For realistic comparisons with the existing network and to allow for any built-in uncertainties and assumptions, the network model and operational data from the water utility were used without modification. Extended period simulation was carried out with the nodal demands and 29 different fire flows. Head loss due to friction was calculated using the Darcy-Weisbach formula (Rossman, 2002). The pipe roughness heights ranged from 0.01 mm to 3.0 mm. Self-evidently, less expensive solutions could be obtained by assuming pipe roughness values for new pipes. Additional details are available in Seyoum and Tanyimboh (2014).
Parameters of the genetic algorithms
With a total of 28 current and historical pipe diameters in the network and 251 pipes, the solution space, in theory, comprised 28251 feasible and infeasible solutions. However, the old (and thus obsolete) pipe diameters that were no longer commercially available were subsequently excluded from the solution space to ensure that the solutions obtained by the optimization algorithms would be achievable in practice. Strictly speaking, the real number of distinct pipe sizes was less than 28 in practice, as some of the pipe diameters were effectively duplicated, where the old pipe diameters in inches (imperial units) had been replaced by the corresponding diameters in mm (SI units) that were either similar or essentially the same. The smallest and largest diameters in the existing network were 32 mm and 400 mm respectively. Ten commercially available pipe diameters were selected subsequently, based on the existing diameters in the network that ranged from 32 mm to 400 mm, as shown in Fig. 2. In addition to the smallest diameter (32 mm), the selected diameters included 50 mm, 75 mm and all standard diameters from 100 mm to 400 mm which, therefore, represents virtually a full set in practical terms. The solution space was thus reduced by a factor of 2.8251 ≈ 1.7 × 10112 to 10251, an enormous reduction.
No attempt was made to explore the rest of the solution space that had been excluded and, similarly, no attempt was made to improve the subset of the pipe diameter options that was used in the optimization. Self-evidently, the solution space thus specified, with 10251 candidate solutions, remained extremely large. Search space reduction is beyond the scope of this article; sophisticated search space reduction methods are available in the literature (Kadu et al., 2008; Barlow and Tanyimboh, 2014; Tanyimboh and Czajkowska, 2018; Abdy Sayyed et al., 2019). As explained in Templeman (1982), the main objective herein was to demonstrate that the algorithm developed can find numerous high-quality solutions quickly and reliably, given that the present optimization problem is NP-hard (Yates et al., 1984). Hereafter, all references to the solution space refer to the reduced solution space of 10251, unless otherwise stated.
Due to the large size and complexity of the water distribution network, coupled with large spatial and temporal variations in the demands, the demand satisfaction ratio of the entire network rather than the critical node (Siew and Tanyimboh, 2012a; Siew et al., 2014) was used to evaluate the hydraulic performance function f2 in Eq. 3. In this way, any risk of premature convergence due to excessive selection pressure would be obviated.
A four-bit binary string was used to encode the solutions. There were thus 24 = 16 four-bit combinations of which 6 were redundant. The redundant codes were allocated as follows: one each to the two smallest and two largest pipe diameters, and one each to the two middle pipe diameters. This symmetrical and balanced allocation was designed to minimize the effects of the representational bias that arises due to the imbalance between the number of binary codes and decision (pipe diameter) options (Tanyimboh and Czajkowska, 2018). Alternative approaches for handling redundant codes are available in the literature (Saleh and Tanyimboh, 2014; Herrera et al., 1998).
The crossover and mutation probabilities were pc = 1.0 and pm = 0.005, respectively. The population size was Np = 1 000 and the maximum number of function evaluations allowed was 106. The serial and parallel algorithms were executed 10 times each. An inherent feature of the solution methodology is that the initial population always includes the minimum and maximum decision variable vectors while the rest of the (Np - 2) solutions were generated randomly. To reduce complexity in the subsequent analyses and comparisons of the results obtained, the 10 sets of initial populations used were identical for both algorithms.
RESULTS AND DISCUSSION
Serial algorithm
The additional results used to assess the algorithm developed further and more deeply were obtained with a serial algorithm on a supercomputer. The high-performance computing (HPC) facility had 276 compute nodes. Each compute node had Dual Intel Xeon 2.66 GHz CPU (6 cores each) and 48 GB RAM, on the Linux Operating System. On average, the number of function evaluations and CPU time to achieve the best solution, within the specified upper limit of 1 000 000 function evaluations, were 973 700 function evaluations and 12.81 h, respectively. The average CPU time to complete a single optimization run comprising 1 000 000 function evaluations was 13.17 h, with a standard deviation of 0.94 h.
The least expensive feasible solution obtained was 419 514 GBP (British Pounds) at 985 000 function evaluations. The mean and median values of the minimum cost achieved were £421 938 and 420 408 GBP, respectively, and the standard deviation was 4 038 GBP (Table 1). The existing network cost, with the optimized diameters obtained previously using commercial software, was 809 700 GBP, approximately. Therefore, on average, a potential saving of approximately 47.9% was achieved for the 10 optimization runs collectively. The least expensive feasible solution of 419 514 GBP achieved a potential saving of approximately 48.2%.
It is worth re-stating that the existing network cost refers to the real-world network after rehabilitation/upgrading with comm-ercial software. The data for the original network prior to the rehabilitation were not available. Therefore, by casting the problem as the design of a new network, the solutions achieved would help to reveal the amount of spare capacity or headroom in the existing, rehabilitated network. Also, by identifying the suboptimal and/or grossly suboptimal pipe diameters in the existing network, the solutions achieved could help simplify and guide the long-term rehabilitation decisions.
Figure 3 shows the pipe diameters, velocities and nodal heads of the existing and new optimized networks. In general, the new optimized solutions had smaller pipe diameters and, hence, lower residual heads than the existing network. As stated previously, the existing network had some pipe diameters that were no longer commercially available. The minimum residual head requirements of 20.0 m and 3.0 m, respectively, for the demand nodes and fire hydrants were fulfilled for the entire operating cycle. The heads at the fire hydrants greatly exceeded 3.0 m due to the proximity of the fire hydrants to the demand nodes.


The maximum velocity in the existing network was 1.1 m/s. A large proportion of the velocities were less than 0.5 m/s, which may be low under certain circumstances, considering such factors as the water age and discolouration potential (Boxall and Saul, 2005; Besner et al., 2005; Furnass et al., 2013; Seyoum et al., 2013; Seyoum and Tanyimboh, 2014). Indeed, Fig. 3c shows that all the solutions depicted have pipes with low velocities. This points to the need to include the minimum pipe velocity constraints in the optimization model, in addition to any explicit water quality related objectives (Woolschlager et al., 2005).
In the new optimized design, collectively 43 velocities (i.e. 0.6%) with an arithmetic mean of 4.6 m/s exceeded the 3.5 m/s guidance value in 27 pipes. It was observed that the high velocities were related to the short pipes/sections of about 1.0 m in length, located at the pipe junctions. The details of the fittings and connections were not considered here; inter alia, they were not available. While the maximum velocity constraints were not addressed explicitly in the optimization problem, possibly an area for additional research in the future, these results seem reasonable given the available information.
Parallel algorithm
The parallel algorithm was executed on a Workstation with Dual Intel Xeon 2.4 GHz CPU (four cores each) and 16 GB RAM, on the Windows 7 Operating System. All the eight cores of the workstation were utilized. A single run of the serial algorithm with 1 000 000 function evaluations required an average CPU time of 30 days on the Workstation. The CPU time of the parallel algorithm with 1 000 000 function evaluations on the Workstation ranged from 1.75 to 2.74 days, or 2 days on average, i.e., an average speed up of 15. This is a significant achievement in the sense that it is far more practical than the serial algorithm. The supercomputer's average CPU time of 13.17 h was obviously superior, but HPC facilities are very scarce as stated previously. The above-mentioned average speed-up of 15 refers to the speed-up achieved on the Workstation. To clarify further, the supercomputer was used mainly to generate quickly - given the lengthy execution times - the additional solutions needed to assess the parallel algorithm rigorously. Typical examples of the speed-ups achievable using parallel computing on the supercomputer are available in Barlow and Tanyimboh (2014).
The least expensive feasible solution achieved by the parallel algorithm was 418 685 GBP at 975 000 function evaluations. This is 0.2% less expensive than the best solution from the serial algorithm (419 514 GBP, 985 000 function evaluations) and is a new best solution. It represents a potential saving of 48.3% compared to the existing network. The average number of function evaluations to reach the best solution achieved in each optimization run (within the specified upper limit of 1 000 000 function evaluations) was 981 000.
Figure 3 also shows the optimized pipe diameters achieved by the parallel algorithm. The solution had collectively 43 velocities in 27 pipes that exceeded the 3.5 m/s guidance value, with an arithmetic mean of 4.7 m/s. As mentioned previously, the high velocities were localised at the pipe junctions in the short pipes/sections of about 1.0 m in length.
Accuracy and reliability of the solutions achieved
The Pareto-optimal front was approximated by merging the solutions from all the non-dominated sets achieved herein and in Seyoum et al. (2015). Figure 4 compares the individual non-dominated fronts achieved to the Pareto front. The final Pareto front achieved comprised NPO = 989 solutions while the fronts of the individual optimization runs had Np = 1 000 solutions each. This is the reason that some of the generational distance values (e.g. Run 9 in Fig. 4) are seemingly relatively high, which is somewhat misleading. Such values were nevertheless retained herein for completeness. The minimum generational distance value achieved was 0.00005 for both the serial and parallel algorithms. This demonstrates the algorithm's effectiveness and reliability as well as the accuracy of the results clearly. The accuracy and consistency of the results is therefore remarkable, considering that the fraction of the solution space that was sampled in each optimization run was only 106/10251 = 10-245. In other words, only one solution in every 10245 was simulated in each optimization run. Indeed, the convergence characteristics in Fig. 5 show that the algorithm's progress is very quick and steady, with the bulk of the reduction in cost occurring early on.
CONCLUSIONS
An efficient multi-objective genetic algorithm for the design optimization of water distribution systems was developed and demonstrated using a real-world case study with hundreds of decision variables. In terms of the computational efficiency, only one solution in every 10245 candidate solutions was sampled in each optimization run. Thus, the fraction of the solution space that was evaluated was an impressive 10-245.
A controller-worker parallel algorithm developed for use on a Workstation achieved an average speed-up of 15, thus reducing a 30-day optimization run to 2 days on average. Nevertheless, the additional results obtained using a supercomputer and a serial algorithm took only 13.17 h on average to complete one optimization run. It should be noted, however, that HPC facilities are very scarce.
The quality of the solutions was assessed (i) by comparing the optimized designs achieved to the existing network, which was previously optimized using commercial software, and (ii) by spatial analysis of the Pareto-optimal fronts using the generational distance. Highly competitive solutions were obtained consistently, with a very high degree of reliability. The best feasible solution achieved a cost 48.3% less than the previously optimized solution of a real-world case study and is a new best solution. The coefficient of variation of the least cost achieved by the parallel algorithm for a feasible solution was 0.024. The best generational distance value achieved was 5 × 10⁻⁵, based on the normalised objective function values.
The effectiveness of the multi-objective genetic algorithm developed is due to the co-evolution and preservation of both feasible and infeasible frontier-optimal solutions from the beginning to the end of the optimization process. In this way, the full range of the genetic materials are retained in the gene pool throughout the optimization run which, therefore, promotes diversity and avoids stagnation and premature convergence. This follows naturally from the strict interpretation and application of the Pareto-optimality principle employed in the genetic algorithm developed, which ensures that infeasible frontier optimal solutions are not discarded arbitrarily and too quickly during the optimization.
Except for the maximum and minimum decision variable vectors that were always included by default in each optimization run, an inherent feature of the solution methodology, the initial populations were generated randomly. The role of the minimum and maximum decision variable vectors is that they help to reinforce and expand the population diversity through recombination as the optimization progresses (Saleh and Tanyimboh, 2014). However, unlike the minimum solution (decision variable) vector, the maximum solution (decision variable) vector generally does not survive until the last generation. The reason is that a more economical non-inferior solution that has essentially the same hydraulic properties as the maximum solution (decision variable) vector tends to prevail at the expense of the maximum solution (decision variable) vector.
Having demonstrated the effectiveness and reliability of the genetic algorithm as a free-standing procedure, self-evidently, it could be used readily in a memetic algorithm, for example, or in combination with other approaches and solution-enhancing techniques. However, these aspects were not considered in this investigation. It would be instructive, nevertheless, to investigate additional mechanisms to address other factors and constraints, e.g., excessively low velocities, with the potential to extend the algorithm's functionality. A key issue is that the fitness assessment of the solutions that violate any additional constraints should avoid any built-in bias that favours the feasible solutions. This is a necessary condition that enables frontier optimal infeasible solutions to survive from the start to the end of the evolutionary search process, thus focusing the search around the feasibility boundaries.
ACKNOWLEDGEMENTS
This work was supported in part by the UK Engineering and Physical Sciences Research Council (EPSRC grant reference EP/G055564/1); the British Government (Overseas Research Students Awards Scheme); and the University of Strathclyde. The authors also thank Veolia Water UK (now Affinity Water) and the HPC team at the University of Strathclyde. Additional results were obtained on the ARCHIE-WeSt High Performance Computer (www.archie-west.ac.uk) funded by the UK Engineering and Physical Sciences Research Council (EPSRC grant number EP/K000586/1).
CONFLICT OF INTEREST
There is no conflict of interest.
ORCID
Tiku T Tanyimboh
http://orcid.org/0000-0003-3741-7689
REFERENCES
ABDY SAYYED MAH, GUPTA R and TANYIMBOH TT (2019) Combined flow and pressure deficit-based penalty in GA for optimal design of water distribution network. ISH J. Hydraul. Eng. https://doi.org/10.1080/09715010.2019.1604180 [ Links ]
ACKLEY JRL, TANYIMBOH TT, TAHAR B and TEMPLEMAN AB (2001) Head-driven analysis of water distribution systems. In: Coulbeck B (ed.) Water Software Systems: Theory and Applications. Research Studies Press, Taunton, UK. [ Links ]
ALBA E (2005) Parallel Metaheuristics: A New Class of Algorithms, Vol. 47. Wiley & Sons, New York. https://doi.org/10.1002/0471739383 [ Links ]
ARTINA S, BRAGALLI C, ERBACCI G, MARCHI A and RIVI M (2012) Contribution of parallel NSGA-II in optimal design of water distribution networks. J. Hydroinf. 14 (2) 310-323. https://doi.org/10.2166/hydro.2011.014 [ Links ]
AYVAZ MT and KENTEL E (2015) Identification of the best booster station network for a water distribution system. J. Water Resour. Plann. Manage. 141 (5). https://doi.org/10.1061/(ASCE)WR.1943-5452.0000473 [ Links ]
BACK T, FOGEL D and MICHALEWICZ Z (1997) Handbook of Evolutionary Computation. IOP Publishing Ltd, Bristol. https://doi.org/10.1201/9781420050387 [ Links ]
BARLOW E and TANYIMBOH TT (2014) Multi-objective memetic algorithm applied to the optimisation of water distribution systems. Water Resour. Manage. 28 (8) 2229-2242. https://doi.org/10.1007/s11269-014-0608-0 [ Links ]
BESNER MC, GAUTHIER V, TRÉPANIER M, LECLAIR M and PREVOST M (2005) Interactive analyser for understanding water quality problems in distribution systems. Urban Water J. 2 (2) 93-105. https://doi.org/10.1080/15730620500144340 [ Links ]
BOXALL JB and SAUL AJ (2005) Modelling discoloration in potable water distribution systems. J. Environ. Eng. 131 (5) 716-725. https://doi.org/10.1061/(ASCE)0733-9372(2005)131:5(716) [ Links ]
BSI (British Standards Institution) (2000) Water Supply Requirements for Systems and Components Outside Buildings. BS EN 805:2000. BSI, London. [ Links ]
BROAD DR, DANDY GC and MAIER HR (2005) Water distribution system optimization using metamodels. J. Water Resour. Plann. Manage. 131 (3) 172-180. https://doi.org/10.1061/(ASCE)0733-9496(2005)131:3(172) [ Links ]
BROAD DR, MAIER HR and DANDY GC (2010) Optimal operation of complex water distribution systems using metamodels. J. Water Resour. Plann. Manage. 136 (4) 433-443. https://doi.org/10.1061/(ASCE)WR.1943-5452.0000052 [ Links ]
CANTU-PAZ E (2000) Efficient and Accurate Parallel Genetic Algorithms, Vol. 1. Springer Science & Business Media, Berlin/Heidelberg. https://doi.org/10.1007/978-1-4615-4369-5_1 [ Links ]
CANTU-PAZ E and GOLDBERG DE (2000) Efficient parallel genetic algorithms: theory and practice. Comput. Methods Appl. Mech. Eng. 186 (2) 221-238. https://doi.org/10.1016/S0045-7825(99)00385-0 [ Links ]
CASTILLO O, MELIN P and PEDRYCZ W (eds.) (2008) Soft Computing For Hybrid Intelligent Systems, Vol. 154. Springer Science & Business Media, Berlin/Heidelberg. https://doi.org/10.1007/978-3-540-37421-3 [ Links ]
CHOOTINAN P and CHEN A (2006) Constraint handling in genetic algorithms using a gradient-based repair method. Comput. Oper. Res. 33 2263-2281. https://doi.org/10.1016/j.cor.2005.02.002 [ Links ]
DEB K, PRATAP A, AGARWAL S and MEYARIVAN T (2002) A fast and elitist multi-objective genetic algorithm: NSGA-II. IEEE Trans. Evol. Comp. 6 (2) 182-197. https://doi.org/10.1109/4235.996017 [ Links ]
DRIDI L, PARIZEAU M, MAILHOT A and VILLENEUVE JP (2008) Using evolutionary optimization techniques for scheduling water pipe renewal considering a short planning horizon. Computer‐Aided Civ. Infrastruct. Eng. 23 (8) 625-635. https://doi.org/10.1111/j.1467-8667.2008.00564.x [ Links ]
ESKANDAR H, SADOLLAH A, BAHREININEJAD A and HAMDI M (2012) Water cycle algorithm - a novel metaheuristic optimization method for solving constrained engineering optimization problems. Comput. Struct. 110-111 151-166. https://doi.org/10.1016/j.compstruc.2012.07.010 [ Links ]
EWALD G, KUREK W and BRDYS MA (2008) Grid implementation of a parallel multiobjective genetic algorithm for optimized allocation of chlorination stations in drinking water distribution systems: Chojnice case study. IEEE Trans. Syst. Man. Cybern. Part C, Appl. Rev. 38 (4) 497-509. https://doi.org/10.1109/TSMCC.2008.923864 [ Links ]
FURNASS WR, MOUNCE SR and BOXALL JB (2013) Linking distribution system water quality issues to possible causes via hydraulic pathways. Environ. Model. Softw. 40 78-87. https://doi.org/10.1016/j.envsoft.2012.07.012 [ Links ]
GERMANOPOULOS G (1985) A technical note on the inclusion of pressure dependent demand and leakage terms in water supply network models. Civ. Eng. Syst. 2 (3) 171-179. https://doi.org/10.1080/02630258508970401 [ Links ]
GIBBS MS, MAIER HR and DANDY GC (2015) Using characteristics of the optimisation problem to determine the genetic algorithm population size when the number of evaluations is limited. Environ. Model. Softw. 69 226-239. https://doi.org/10.1016/j.envsoft.2014.08.023 [ Links ]
HERRERA F, LOZANO M and VERDEGAY JL (1998) Tackling real-coded genetic algorithms: Operators and tools for behavioural analysis. Artif.l Intell. Rev. 12 265-319. https://doi.org/10.1023/A:1006504901164 [ Links ]
KADU MS, GUPTA R and BHAVE PR (2008) Optimal design of water networks using a modified genetic algorithm with reduction in search space. J. Water Resour. Plann. Manage. 134 (2) 147-160. https://doi.org/10.1061/(ASCE)0733-9496(2008)134:2(147) [ Links ]
KANG D and LANSEY K (2012) Revisiting optimal water-distribution system design: issues and a heuristic hierarchical approach. J. Water Resour. Plann. Manage. 138 (3) 208-217. https://doi.org/10.1061/(ASCE)WR.1943-5452.0000165 [ Links ]
KUMAR SV, DOBY TA, BAUGH JW JR, BRILL ED and RANJITHAN SR (2006) Optimal design of redundant water distribution networks using a cluster of workstations. J. Water Resour. Plann. Manage. 132 (5) 374-384. https://doi.org/10.1061/(ASCE)0733-9496 (2006)132:5(374) [ Links ]
LI C, Yu JZ, ZHANG TQ, MAO XW and HU YJ (2015) Multiobjective optimization of water quality and rechlorination cost in water distribution systems. Urban Water J. 12 (8) 646-652. https://doi.org/10.1080/1573062X.2014.939093 [ Links ]
LIU H, CAI Z and WANG Y (2010) Hybridizing particle swarm optimization with differential evolution for constrained numerical and engineering optimization. Appl. Soft Comput. 10 (2) 629-640. https://doi.org/10.1016/j.asoc.2009.08.031 [ Links ]
MOOSAVIAN N and LENCE BJ (2017) Nondominated sorting differential evolution algorithms for multiobjective optimization of water distribution systems. J. Water Resour. Plann. Manage. 143 (4) https://doi.org/10.1061/(ASCE)WR.1943-5452.0000741 [ Links ]
OSTFELD A and TUBALTZEV A (2008) Ant colony optimization for least-cost design and operation of pumping water distribution systems. J. Water Resour. Plann. Manage. 134 (2) 107-118. https://doi.org/10.1061/(ASCE)0733-9496(2008)134:2(107) [ Links ]
OYAMA A, SHIMOYAMA K and FUJII K (2007) New constraint-handling method for multi-objective and multi-constraint evolutionary optimization. Trans. Jap. Soc. Aeronaut. Space Sci. 50 (167) 56-62. https://doi.org/10.2322/tjsass.50.56 [ Links ]
PIRATLA KR and ARIARATNAM ST (2012) Reliability based optimal design of water distribution networks considering life cycle components. Urban Water J. 9 (5) 305-316. https://doi.org/10.1080/1573062X.2012.660961 [ Links ]
PHAN DT, LIM JBP, SHA W, SIEW C, TANYIMBOH TT, ISSA HK, MOHAMMAD FA (2013) Design optimization of cold-formed steel portal frames taking into account the effect of topology. Eng. Optim. 25 (4) 415-433. https://doi.org/10.1080/0305215X.2012.678493 [ Links ]
PRASAD TD and PARK NS (2004) Multiobjective genetic algorithms for design of water distribution networks. J. Water Resour. Plann. Manage. 130 (1) 73-82. https://doi.org/10.1061/(ASCE)0733-9496 (2004)130:1(73) [ Links ]
PRICE E and OSTFELD A (2016) Graph theory modeling approach for optimal operation of water distribution systems. J. Hydraul. Eng. 142 (3). https://doi.org/10.1061/(ASCE)HY.1943-7900.0001099 [ Links ]
RAY T, SINGH HK, ISAACS A and SMITH W (2009) Infeasibility driven evolutionary algorithm for constrained optimization. In: Constraint-Handling in Evolutionary Optimization, Vol. 198. Springer, Berlin. 145-165. https://doi.org/10.1007/978-3-642-00619-7_7 [ Links ]
ROSSMAN LA (2002) EPANET 2 Users Manual. Water Supply and Water Resources Division, National Risk Management Research Laboratory, US EPA, Cincinnati, OH, USA. [ Links ]
RUNARSSON TP and YAO X (2000) Stochastic ranking for constrained evolutionary optimization. Trans. Evol. Comput. 4 (3) 284-294. https://doi.org/10.1109/4235.873238 [ Links ]
SALEH SH and TANYIMBOH TT (2013) Coupled topology and pipe size optimization of water distribution systems. Water Resour. Manage. 27 (14) 4795-4814. https://doi.org/10.1007/s11269-013-0439-4 [ Links ]
SALEH SH and TANYIMBOH TT (2014) Optimal design of water distribution systems based on entropy and topology. Water Resour. Manage. 28 (11) 3555-3575. https://doi.org/10.1007/s11269-014-0687-y [ Links ]
SALEH SH and TANYIMBOH TT (2016) Multi-directional maximum-entropy approach to the evolutionary design optimization of water distribution systems. Water Resour. Manage. 30 (6) 1885-1901. https://doi.org/10.1007/s11269-016-1253-6 [ Links ]
SEYOUM AG, TANYIMBOH TT and SIEW C (2013) Assessment of water quality modelling capabilities of EPANET multiple species and pressure-dependent extension models. Water Sci. Technol.: Water Supply 13 (4) 1161-1166. https://doi.org/10.2166/ws.2013.118 [ Links ]
SEYOUM AG and TANYIMBOH TT (2014) Pressure dependent network water quality modelling. Proc. ICE: Water Manage. 167 (6) 342-355. https://doi.org/10.1680/wama.12.00118 [ Links ]
SEYOUM AG, TANYIMBOH TT and SIEW C (2015) Practical application of penalty-free evolutionary multi-objective optimization of water distribution systems. 9th World Congress of European Water Resources Association, Istanbul, Turkey, June 2015. [ Links ]
SHEIKHOLESLAMI R and TALATAHARI S (2016) Developed swarm optimizer: A new method for sizing optimization of water distribution systems. J. Comput. Civ. Eng. https://doi.org/10.1061/(ASCE)CP.1943-5487.0000552 [ Links ]
SIEW C and TANYIMBOH TT (2012a) Penalty-free feasibility boun-dary convergent multi-objective evolutionary algorithm for the optimization of water distribution systems. Water Resour. Manage. 26 (15) 4485-4507. https://doi.org/10.1007/s11269-012-0158-2 [ Links ]
SIEW C and TANYIMBOH TT (2012b) Pressure-dependent EPANET extension. Water Resour. Manage. 26 (6) 1477-1498. https://doi.org/10.1007/s11269-011-9968-x [ Links ]
SIEW C, TANYIMBOH TT and SEYOUM AG (2014) Assessment of penalty-free multi-objective evolutionary optimization approach for the design and rehabilitation of water distribution systems. Water Resour. Manage. 28 (2) 373-389. https://doi.org/10.1007/s11269-013-0488-8 [ Links ]
SIEW C, TANYIMBOH TT and SEYOUM AG (2016) Penalty-free multi-objective evolutionary approach to optimization of Anytown water distribution network. Water Resour. Manage. 30 3671-3688. https://doi.org/10.1007/s11269-016-1371-1 [ Links ]
STOKES CS, MAIER HR and SIMPSON AR (2016) Effect of storage tank size on the minimization of water distribution system cost and greenhouse gas emissions while considering time-dependent emissions factors. J. Water Resour. Plann. Manage. 142 (2). https://doi.org/10.1061/(ASCE)WR.1943-5452.0000582 [ Links ]
TANYIMBOH TT and CZAJKOWSKA AM (2018) Self-adaptive solution-space reduction algorithm for multi-objective evolutionary design optimization of water distribution networks. Water Resour. Manage. 32 (10) 3337-3352. https://doi.org/10.1007/s11269-018-1994-5 [ Links ]
TANYIMBOH TT and SEYOUM AG (2016) Multi-objective evolutionary optimization of water distribution systems: Exploiting diversity with infeasible solutions. J. Environ. Manage. 183 (2016) 133-141. https://doi.org/10.1016/j.jenvman.2016.08.048 [ Links ]
TANYIMBOH T, TABESH M, GUPTA R and BHAVE P (1997) Comparison of methods for predicting deficient-network performance. J. Water Resour. Plann. Manage. 124 (6) 369-370. https://doi.org/10.1061/(ASCE)0733-9496(1997)123:6(369) [ Links ]
TANG Y, REED PM and KOLLAT JB (2007) Parallelization strategies for rapid and robust evolutionary multiobjective optimization in water resources applications. Adv. Water Resour. 30 (3) 335-353. https://doi.org/10.1016/j.advwatres.2006.06.006 [ Links ]
TEMPLEMAN A (1982) Discussion of optimization of looped water distribution systems by Quindry et al. J. Environ. Eng. Div. 108 (3) 599-602. [ Links ]
TERSI L, FANTOZI S and STIAGNI R (2015) Characterization of the performance of memetic algorithms for the automation of bone tracking with fluoroscopy. IEEE Trans. Evol. Comp. 19 (1) 19-29. https://doi.org/10.1109/TEVC.2013.2281540 [ Links ]
TROBEC R, VAJTERSIC M and ZINTERHOF P (2009) Parallel Computing: Numerics, Applications, and Trends. Springer Science & Business Media, Berlin/Heidelberg. https://doi.org/10.1007/978-1-84882-409-6 [ Links ]
VAN ZYL JE, SAVIC DA and WALTERS GA (2004) Operational optimization of water distribution systems using a hybrid genetic algorithm. J. Water Resour. Plann. Manag. 130 (2) 160-170. https://doi.org/10.1061/(ASCE)0733-9496(2004)130:2(160) [ Links ]
VELDHUIZEN DAV and LAMONT GB (1998) Evolutionary computation and convergence to a pareto front. https://pdfs.semanticscholar.org/f329/eb18a4549daa83fae28043d19b83fe8356fa.pdf (Accessed 26 February 2020). [ Links ]
WALSKI TM (1995) Optimization and pipe sizing decisions. J. Water Resour. Plann. Manag. 121 (4) 340-343. https://doi.org/10.1061/(ASCE)0733-9496(1995)121:4(340) [ Links ]
WOLDESENBET YG, YEN GG and TESSEMA BG (2009) Constraint handling in multiobjective evolutionary optimization. Trans. Evol. Comput. 13 (3) 514-525. https://doi.org/10.1109/TEVC.2008.2009032 [ Links ]
WOOLSCHLAGER JE, RITTMANN BE and PIRIOU P (2005) Water quality decay in distribution systems - problems, causes, and new modeling tools. Urban Water J. 2 (2) 69-79. https://doi.org/10.1080/15730620500144027 [ Links ]
WU W, MAIER HR and SIMPSON AR (2013) Multiobjective optimization of water distribution systems accounting for economic cost, hydraulic reliability, and greenhouse gas emissions. Water Resour. Res. 49 (3) 1211-1225. https://doi.org/10.1002/wrcr.20120 [ Links ]
YATES DF, TEMPLEMAN AB and BOFFEY TB (1984) The computational complexity of the problem of determining least capital cost designs for water supply networks. Eng. Optim. 7 (2) 143-155. https://doi.org/10.1080/03052158408960635 [ Links ]
YEN GG (2009) An adaptive penalty function for handling constraint in multi-objective evolutionary optimization. In: Mezura-Montes E (ed.) Constraint Handling in Evolutionary Optimization. Springer, Berlin/Heidelberg. 121-143. https://doi.org/10.1007/978-3-642-00619-7_6 [ Links ]
 Correspondence:
Tiku T Tanyimboh
Email: tiku.tanyimboh@wits.ac.za
Received: 9 August 2019
Accepted: 15 June 2020

