


Servicios Personalizados
Articulo
 Inglés (pdf)
 Articulo en XML
 Referencias del artículo
Indicadores

Links relacionados
-
 Citado por Google
 -
 Similares en Google
Compartir

 Permalink
Water SA
versión On-line ISSN 1816-7950
versión impresa ISSN 0378-4738
Water SA vol.46 no.3 Pretoria jul. 2020
http://dx.doi.org/10.17159/wsa/2020.v46.i3.8655
RESEARCH PAPERS
Pre-disaster planning and preparedness: drought and flood forecasting and analysis in Zimbabwe
Remember SamuI; Bertuğ AkıntuğII
IDiscipline of Engineering and Energy, College of Science, Health, Engineering and Education, Murdoch University, South Street, Murdoch WA 6150, Australia
IICenter for Sustainability, Civil Engineering Program, Middle East Technical University Northern Cyprus Campus, Kalkanli, Guzelyurt, Mersin 10, Turkey
ABSTRACT
A situational analysis of future drought and flood impacts in Zimbabwe is outlined in this present study. The assessment under different scenarios is carried out using Aqueduct Global Flood Analyzer in which all the analyses are based on the gross domestic product (GDP), population, and the present and future (2030) urban damage. In this study, to effectively estimate future changes, three scenarios were employed, namely, IPCC Scenario A2, the Representative Concentration Pathways (RCP) scenario which represents climate change, and the Shared Socio-economic Pathways (SSP) scenario which represents socio-economic change. All these scenarios were employed from the Intergovernmental Panel on Climate Change 5th Assessment Report. To determine current mean monthly precipitation, 1981-2010 data were used and Meteonorm V7 software was employed for the generation of the mean monthly precipitation from 2011 to 2100. The level of flood protection employed is a 10-year one which is used to identify the population at risk, the effects of this event on the GDP and to determine the rate at which urban damage is happening. Utilizing Meteonorm V7 software, average monthly precipitation is predicted. This study determined that, in any year, the majority of Zimbabwe has a low to medium (2-3% probability) flood occurrence in which a 10-year flood has a 10% occurrence probability in any given year. If there is no flood protection employed, this 10-year flood could cause around 74.9 million USD affected GDP, 119 thousand affected population and 49.5 million USD urban damage. As much as it is impossible to eliminate drought and flood events, a diminution approach and proper planning and preparation before their occurrence reduce the economic and social losses.
Keywords: Aqueduct Global Flood Analyzer, drought, flood, flood protection level, Meteonorm V7 software, Zimbabwe
INTRODUCTION
Due to climate change, droughts and floods have become more frequent in various parts of the world, of which some extreme cases result in loss of lives and properties (Dalu et al., 2018; Nchito 2007; Douglas et al., 2008; Turral et al., 2008; Bates et al., 2008; Gornall et al., 2010; Ligtvoet et al., 2013; Simane et al., 2016; Samu and Kentel, 2018; Kjeldsen et al., 2002). Floods are observed mostly as a result of extreme precipitation, tidal influences, or the release of a huge amount of water unexpectedly from a storage such as snowpacks or dams. On the contrary, droughts occur when there is a prolonged period of less than expected rainfall. In comparison to floods, droughts have a longer lifespan as they can persist for a couple of years, such as the droughts in Namibia in 2013 (Schlechter, 2013).
Studies and analyses of floods and droughts have been performed for different parts of the world. Li et al. (2013) studied annual variations and causes of drought and flood hazards in South China. Their results show that places in the southwest and north of Guangxi, Guangdong and the junction of Fujian and Jiangxi were at high risk of excess flooding. Asumadu-Sarkodie et al. (2015a) analysed drought and flood in Rwanda. They concluded that Rwanda's probability of inland flooding was more than 20% in any given year and a 10-year flood would have a 10% probability of occurrence in any given year and could cause around 6.1 million USD worth of damage. Asumadu-Sarkodie et al. (2015b) also did an impact analysis study of the flood in Ghana's capital, Accra. This was a study prior to the flood in Accra that happened in 2015 (3 June), in which more than 152 lives were lost. They employed a 10-year flood protection level model.
Mubaya et al. (2010) collected data and employed quantitative and qualitative methods to perceive the impacts of climate-related parameters such as floods and droughts on smallholder farmers in Zambia and Zimbabwe. They concluded that farmers identify impacts of drought and flood in terms of water, crop yield, human and livestock health, and other socio-economic factors. In similar research, Bola et al. (2014), collected data from 144 households using interviews, discussions, and questionnaires to understand if and in what ways extreme floods and droughts impact on livelihoods: According to perceptions of households, average rainfall has decreased over the years and dry spells have become more frequent. On the other hand, according to households' opinion, there is an increase in the frequency of flood events.
Over the years, losses due to flooding have been increasing mainly due to global warming, high rates of urbanization of the flood-prone areas, an increase in population densities, amendments of the usage of the land, and a lot of sub-customary constructions. Due to these and many other reasons, chances of flooding in cities are high, mainly because of high population densities and concentration of economic activities (Asumadu-Sarkodie et al., 2015a). Against this backdrop, improvements for design flood estimation procedures are being explored. Some such studies for South Africa were performed by Kershani and Smithers (2005) in the Thukela catchment in South Africa and by Nathanael et al. (2018).
Recently, Ward et al. (2016) provided the first modelling exercise that assesses the link between flood frequency and duration and inter-annual climate variability on a global scale. Their results show that flooding duration is more sensitive to El Niño Southern Oscillation (ENSO) than is the frequency of the flood.
The 1992 drought in Zimbabwe was one of the worst droughts in recorded history, which was experienced throughout Southern Africa (Maphosa 1994). This drought transformed the country from having a food surplus to a food importer. In their study, Manatsa et al. (2010) analysed the frequency and spatiotemporal characteristics of agricultural droughts in Zimbabwe using the Standard Precipitation Index. They considered 1901-2004 rainfall data and concluded that severe and extreme droughts tended to be concentrated near the end of the time-series. In another recent study, Mukwada and Manatsa (2018) concluded that the mean temperature has been rising since 1980, and examined the effects of severe droughts in Southern African countries, including Zimbabwe. Future climate predictions for Southern Africa outline an increase in drought severity, thus indicating the need to have drought mitigation measures in place (Sifundza et al., 2019). In the identification of drought events, several methods are employed; however, Chamaille-Jammes and Murindagomo (2007) have suggested that the quantile regression approach is a valuable tool to investigate climatic changes in arid and semi-arid regions.
Some studies have concluded that Zimbabwe's average annual rainfall has declined by 10% or 100 mm in the past 100 years. Mazvimavi (2010) investigated the validity of this assumption; the results revealed that statistically there is no significant trend. On the other hand, Brown et al. (2012) studied several publications which examined projections, certain scenarios, and climate change trends in Zimbabwe and concluded that the nation is already experiencing the effects of climate change, shown by extreme weather conditions and precipitation patterns. Shortly before this study, Chikozho (2010) examined the major impacts of climate change and rainfall variability on the rainfed agricultural sector in vulnerable agro-ecological regions of Zimbabwe. Studies on mitigation measures that can be employed for a sustainable future, especially in the flood-prone and vulnerable regions in Zimbabwe, were performed by Samu and Kentel (2018) and Gwimbi (2009).
As these papers outline, different methodologies have been applied to different studies and locations but none has presented a situational analysis for both drought and flood events in Zimbabwe, which is the novel contribution of this study. Affected Gross Domestic Product (GDP), affected population and urban damage is determined for a 10% probability of flood occurrence. In order to estimate the changes in the future, the IPCC Scenario A2, the Shared Socioeconomic Pathways (SSP) and the Representative Concentration Pathways (RCP) are the scenarios employed.
Demographics
Zimbabwe is a landlocked country with an estimated area of 390 760 km2 situated at an average of 19.0154°S latitude and 29.1549°E longitude. The country straddles the high plateau between the Limpopo and the Zambezi rivers to the south and to the north, respectively, with a tropical climate (World Bank, 2019). The Udizi and Nyanga Mountains stretch along the border to the east with Mozambique; Zimbabwe's highest (2 592 m amsl at Nyanga Mountains) and lowest (162 m amsl at the intersection of Save and Runde Rivers) are also found here. The Nyanga Mountain is a source of three rivers: Pungwe River which flows due east into Mozambique, Gairezi River, and Nyamuziwa River. Water bodies in Zimbabwe constitute 26 572 km2, around 6.8% of the surface. Zimbabwe receives 266 666 million m3 as an annual mean rainfall, of which 7.5% of it is carried by rivers (World Atlas, 2019).
However, the mean annual evaporation of 1 200 mm to 1 800 mm is quite high thus creating a deficit in the water balance throughout the year. The highest annual rainfall of 2 000 mm is recorded in the eastern highlands, whilst over one-quarter of the land area receives less than 600 mm (FAO, 1997). The dry season is 7 months a year; hence temporary water shortages have been observed in recent years.
Zimbabwe is a sparsely populated nation with an average of 43.28 people/km2, giving a total population of 17 197 655 (World Population Review, 2019). Zimbabwe's economy is based on a number of factors, with agriculture contributing 19% of the country's GDP and 80% of Zimbabweans' lives depending on mostly rain-fed agriculture (Nangombe, 2013). Zimbabwe used to be considered the 'breadbasket' of the Southern African Development Community (SADC) region, but currently, Zimbabwe is in a food crisis. This is so mainly due to droughts which have prevailed for years, in which the water table is lowered. There has been accelerated runoff due to deforestation and this results in rivers drying sooner than before; even the major rivers such as Limpopo and Save have had their water levels decreased. Agricultural output has decreased as a result of these droughts, though population growth plays a big role in the causes of these droughts.
The hydrography of Zimbabwe comprises 6 basins in which the largest are the Limpopo and the Zambezi. Parts of Masvingo drain into the Save River basin and the Indian Ocean. There is an inland drainage basin of the Okavango via Nata River in Matabeleland North. The Buzi River and Pungwe River cover the southern and northern parts of Manicaland and both drain into the Indian Ocean through Mozambique (World Atlas, 2019).
Zimbabwe's flood and drought history
From time to time, Zimbabwe experiences both droughts and floods, and these constitute the majority of the natural disasters experienced by the country. Droughts mostly last up to about 5 years. In these times, grasses and trees wilt, animals perish from thirst and hunger and crop failure is observed leading to food shortages. The history of droughts in Zimbabwe can be traced back to pre-colonial times. The terms for drought in the vernacular Shona are chingwaga, shangwa or nzara, which ultimately mean hunger, as droughts have been argued to be the leading cause of famines. However, the post-independence Zimbabwe administration has been commended for its effective management of drought impacts (Hicks, 1993).
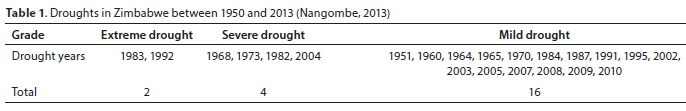
Zimbabwe has experienced several mild, severe, and extreme droughts, but has never experienced a killing famine in which masses of people die due to malnutrition and starvation. In recorded history, 1820-1830 was a period of severe drought in the whole of Africa (GAIA, 1994). Zimbabwe used to produce more than 80 000 tons/a of maize, which is the staple diet; however, in 1991-1992 Zimbabwe experienced the worst drought in living memory, which saw maize production decreasing by 75% resulting in the collection of only 13 000 tons of maize by the Grain Marketing Board, just enough to feed the whole nation for 2 days (Nangombe, 2013). Again, due to intervention by the government to provide food for the people, this drought did not result in a famine. Drought prevailed again in 1993 and 1994, then again in 2002, 2004 and 2012. The 2012 drought left around 1.4 million people, almost 10% of the country's population, faced with famine (Nangombe, 2013). Table 1 gives a summary of the drought history in Zimbabwe up to 2013.
On average, 250 lives in Zimbabwe are claimed by floods yearly (Mutsaka, 2017). On 22 February 2000, Zimbabwe was hit by Cyclone Eline, which affected the eastern and the southern parts. This tropical cyclone arrived at a time when the main river basins, the Save in Manicaland and Limpopo in Matabeleland South and Masvingo, were already facing life-threatening floods (UN Zimbabwe 2000). 500 000 people were affected, of which 96 000 needed urgent help related to shelter, water, food, agriculture, sanitation, transport, communication, and education. There were 106 recorded deaths and 20 000 were left homeless (UN Zimbabwe, 2000).
On 9 January 2015, more than 10 people died due to a flood in Mbire (Share, 2015). In this unexpected event, hospitals, bridges, schools, and toilets were destroyed. On 4 February of the same year, 158 mm of rainfall fell in the capital city Harare. In total 18 flood deaths were recorded in 2015 (Davies, 2015). On 15 March 2019, the eastern region of Zimbabwe was hit by Cyclone Idai, with Chipinge and Chimanimani districts in Manicaland Province the hardest-hit. An estimated 250 000 people were impacted, with 154 people recorded dead, 162 reported injured, 136 still marooned and 687 still missing as of 27 March 2019. A summary of the natural disasters in Zimbabwe from 1900 to 2016 is given in Table 2.
Drought and flood management strategies
The major keys to drought and flood management are the issues of preparedness, recovery, mitigation, and response. Following independence in 1980, the government of Zimbabwe set up an emergency management system. In times of emergency, this system would utilize the available national resources following an order from the presidential office (Chikoto and Sadiq, 2012). Currently, Zimbabwe's National Policy on Drought Management mainly focuses on sustainability and improving livelihoods as a way of lowering stresses experienced by inhabitants. The policy argues strongly for enforcement of an integrated approach to the management of drought pointing out that the country should not address droughts through crisis management but should treat droughts 'as part of long-term development programming'.
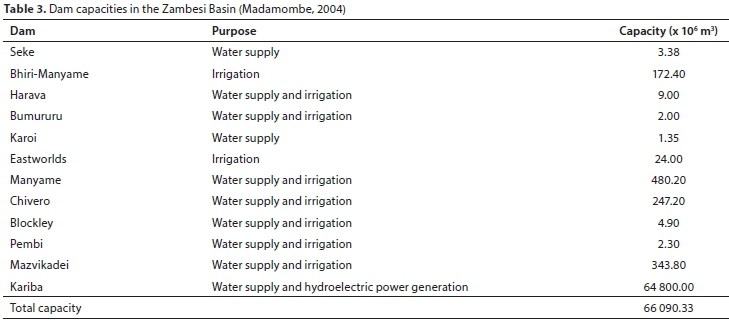
For flood mitigation, there are two types of measures adopted in Zimbabwe (Madamombe, 2004). Firstly, there are the structural measures in which weirs and dams are constructed mainly for the storage of runoff. Table 3 shows some of the major dams that play a role in flood mitigation in the Zambesi basin (Madamombe, 2004). Non-structural types of mitigation include flood forecasting, as well as rescuing, evacuation, and resettlement of the flood victims. This is the most important type of flood management. For forecasting, the information on the prevailing weather conditions is provided by the Meteorological Service Department of Zimbabwe.
METHODOLOGY
Meteonorm V7 software was used to obtain the meteorological data used in the present study. Meteonorm is a unique combination of reliable data sources and sophisticated calculation tools in which accurate and representative typical meteorological years for any place on Earth are generated. One can choose from more than 30 different weather parameters. The database comprises more than 5 geostationary satellites, a globally calibrated aerosol climatology and over 8 000 weather stations. Based on these, sophisticated interpolation models, based on more than 30 years of experience, provide results with high accuracy worldwide (Meteonorm, 2016). It was not possible to get a historical rainfall dataset after the year 2010 from the Meteorological Authority of Zimbabwe; therefore, this software was employed, making this study one of the few to date in which this method has been employed. The historical data used for the determination of the current average monthly precipitation for the whole country were from 1981 to 2010. The data used for the prediction of the average monthly precipitation in the years 2011 to 2100 were generated by employing the Intergovernmental Panel on Climate Change (IPCC) Scenario A2. This employed scenario assumes a population decrease (Pachauri et al., 2014). Studies which consider the amount of rainfall have proved reliable in the determination of variabilities in climate change, as either drought or flood are all directly dependent on the amount of precipitation (Raleigh et al., 2015).
In this study, Aqueduct Global Flood Analyzer was used for the flood risk analysis in Zimbabwe (Edenhofer et al., 2012; Samu and Kentel, 2018). This software assumes that population growth, climate change, and global economic development will alter the competition for and availability of water around the world. Projections of climate variables were driven primarily by general circulation models from the Coupled Model Intercomparison Project (CMIP) Phase 5 Project, and socioeconomic variables were based on the Shared Socioeconomic Pathways database from the International Institute for Applied Systems Analysis (Luck et al., 2015). Aqueduct Flood Analyzer has been employed in a few studies for flood hazard mapping as well as the determination of future flood risks (Brakenridge, 2010; Eilander et al., 2017; Sutanudjaja et al., 2017; Winsemius et al., 2015). A series of models are employed for the estimation of river flooding impacts. These impacts are mainly focused on the amount of urban damage in US dollars (USD) caused by floods, the GDP that will be exposed to floods and the population that will be affected by floods.
The following series of steps are employed by the Aqueduct Flood Analyzer. In the global hydrological and hydraulic modelling, daily river runoff and flood volumes are simulated for the period 1960-1990. The PCR-GLOBWB, which is the global hydrological model, and its extension, DynRout, for dynamic routing, are then used (PCR-GLOBWB 2017). The daily radiation, temperature, and precipitation are used for the estimation of the river runoff. For the calculation of the volume of the floods for any flood magnitude, ranging from a 2-year flood event to a 1 000-year flood event, extreme value statistics were used. In this step, the daily flood volume time series for 1960-1999, and annual maximum flood volumes for each 0.5° x 0.5° cell on the map are extracted, and these are fitted to an Extreme Value (Gumbel) distribution curve. Inundation modelling follows in which course resolution flood volumes are converted to high-resolution ones using GLOFRIS downscaling module. GLOFRIS estimates the effect of land cover and climate change on global flood risks in river catchments and coastal areas (Ward et al., 2013; Winsemius et al., 2012). Then impact modelling is employed in which several types of flood impacts are estimated for varying magnitudes of floods. These are then aggregated to user-selected geographic units (countries, states, basins). The included impacts are urban damage, exposed population, and GDP, all estimated in US dollars. Flood risk in the future can be impacted by either economic growth, socio-economic changes, and climate change. For the estimation of the future flood risk, Global circulation models (GCM) over the period 2010-2049 and socio-economic data (socio-economic change) were employed.
In the present study, the risk of the flood was estimated by Aqueduct Global Flood Analyzer based on the urban damage, the GDP, and the country's population for the year 2010 and the future (up to 2030). Changes in the future are expected and for their estimation Shared Socioeconomic Pathways (SSP) and the Representative Concentration Pathways (RCP) obtained from the IPCC 5th Assessment Report released in 2013, representing socioeconomic change and climate change scenarios, were employed. Scenario A comprises SPP2 which assumes a continuation of the socio-economic development and RCP4.5 in which a moderate climate change is assumed. Scenario B comprises SPP2 which assumes a continuation of the socio-economic development and RCP8.5 in which a severe climate change is assumed. Scenario C comprises SPP3 in which fragmented economies and uncontrolled population growth is assumed and RCP8.5 in which severe climate change is assumed (Edenhofer et al., 2012).
Between the years 1985 and 2011, a couple of floods were recorded in the catchments and the Flood Occurrence (FO) was used to measure them. From this, the flood extent was reported and obtained from the Global Flood Observatory and remote sensing was modelled mathematically as:
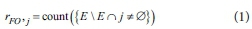
where E is the polygons' extent that is joined spatially to the j catchments so as to count the floods which may affect each catchment over the recorded period.
To measure the average severity of the drought events in the period 1901-2008, drought severity (DRO) was used (Gassert et al., 2015; Wood, 2008). In every grid cell, a dataset is obtained using a monthly soil moisture hydrograph and the drought that has been defined runs continuously whilst the moisture in the soil falls below the 20th percentile of the monthly hydrograph (q(θ) < 20%):
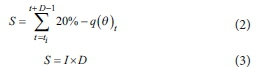
where S represents the drought severity running at the beginning of time, ti and I is the intensity that is equivalent to the mean points in which the moisture in the soil falls under the 20th percentile and D is the drought length, measured in months.
Aqueduct Global Flood Analyzer calculates the dataset of the averaged severity (S) and the mean of the hydrological catchments in Zimbabwe using:

The employed methodology for this present study is limited to simulations of large-scale river flooding, and does not include fluvial, coastal or flash flooding; for the estimation of urban damage, the inundation depth and the actual damage are estimated to be the same throughout the whole world.
RESULTS AND DISCUSSION
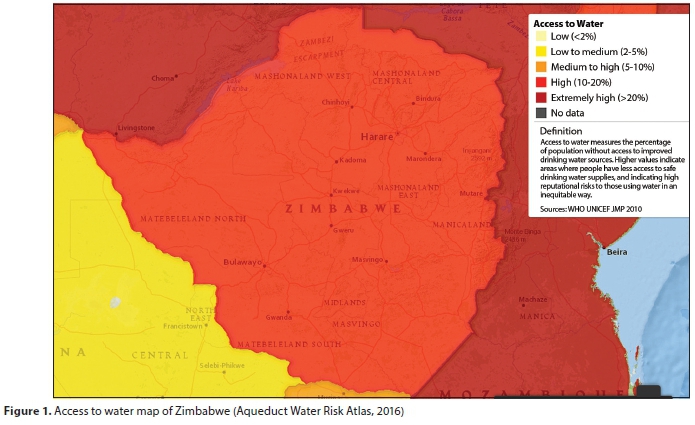
Mainly due to climate change and population growth, Zimbabwe is facing a water crisis, leading from anomalies in rainfall trends and long periods of drought. Figure 1 shows an analysis of 'access to water' for Zimbabwe obtained using Aqueduct Water Risk Atlas. By definition, access to water measures the population percentage that has no access to improved and safe drinking water sources (Aqueduct Water Risk Atlas, 2016). As shown in Fig. 1, Zimbabwe has a 'high' (10-20%) risk of the population having limited access to safe drinking water supplies; this indicates that reputational risks are quite high to people using water inequitably.
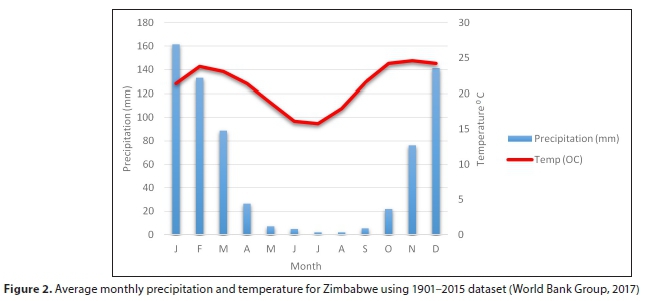
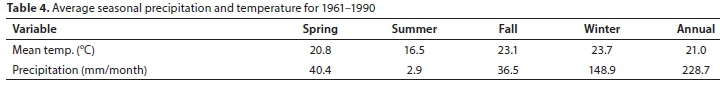
Figure 2 shows the monthly average precipitation and temperature values for Zimbabwe obtained from the 1901-2015 dataset (World Bank Group, 2017) and Table 4 shows the average seasonal precipitation and temperature values which are calculated using the 1961-1990 datasets as well (Osborn, 2016).
Using 10 different GCMs used in the IPCC 4th Assessment Report and finer projections for the southeast of Harare, Messina, and Rusape Stations, projections of future climate changes for Zimbabwe were also performed. Temperature projections showed an increase in the range of 2-2.75C by the period 2046-2065. Rainfall projections showed that in the same period (2046-2065), there will be a decrease in September-November rainfall and a later onset of the rainy season, from December to January (Taylor, 2013).
Flood risk assessment in Zimbabwe
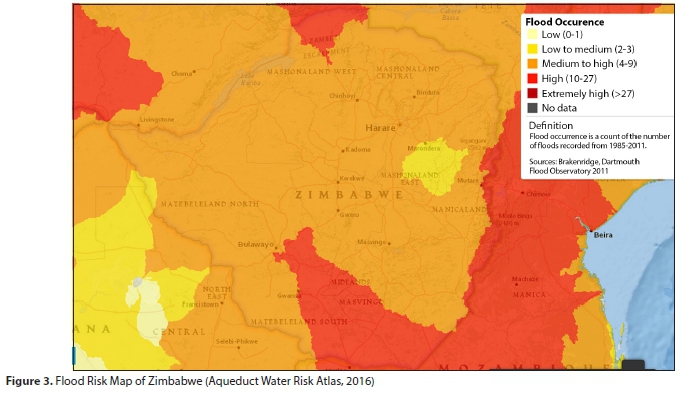
Aqueduct Water Risk Atlas was used for an analysis of the flood occurrence and the results are shown in Fig. 3. Eastern parts of Matabeleland South, Masvingo, and Midlands provinces, as well as the Zambezi region and eastern border parts of Zimbabwe, have a high probability (10-27%) of occurrence of floods. The majority of the nation has a low to medium (2-3% probability) flood occurrence, except for Mashonaland East province which has low (0-1% probability) of flood occurrence. Flood occurrence in this context is defined as the number of flood events that occurred from 1985 to 2011 (Aqueduct Water Risk Atlas, 2016).
Using the 10-year flood protection level, the rate of urban damage was determined and its effects on the GDP and the population at risk were predicted as well. A 10-year flood is a flood event that has 1 in 10 chance (10% probability) of being equalled or exceeded in any given year. The flood protection level outlines to what extent any given area is protected against flood damage (Analyzer, 2016). The protection is provided by imposing restrictions on settlements in flood-prone areas and by investing in flood protection infrastructure such as dikes. However, it is understood that dikes might not be the (or the only) way to mitigate flood risks in many places. Other flood protection schemes, such as dams, mangroves and early warning systems, should all be considered and evaluated when information is available and the situation applicable.
Urban damage in Zimbabwe
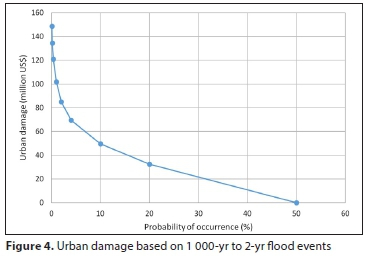
'Urban damage' is an estimate of the direct annualized damage of assets as a result of inland flooding in the urban areas. Table 5 gives the urban damage in Zimbabwe based on 1 000-year to 2-year flood event occurrences. This information is also given in Fig. 4. The estimated urban damage will be a possible outcome if there is no flood protection.

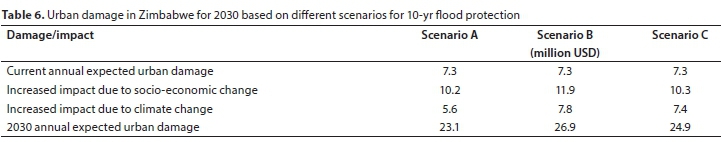
Urban damage in Zimbabwe for 2030 based on different scenarios is given in Table 6. Based on Scenarios A, B, and C, the current annual expected urban damage for Zimbabwe is 7.3 million USD, accounting for its existing country-wide average 10-year flood protection. Based on Scenario A, by 2030, 64.6% of the expected increase in annual urban damage in Zimbabwe could be driven by socio-economic change. This is with an assumption that no additional flood protection is introduced. Again, with the assumption of no introduction of any flood protection by 2030, 35.4% of the expected increase in annual expected urban damage in Zimbabwe could be driven by climate change. By 2030, annual urban damage could reach 23.1 million USD in Zimbabwe, assuming that no additional flood protection is introduced.
Based on Scenario B, by 2030, 60.6% of the expected increase in annual urban damage in Zimbabwe could be driven by socio-economic change. This is with an assumption that no additional flood protection is introduced. Again, with the assumption of no introduction of any flood protection, by 2030, 39.4% of the expected increase in annual expected urban damage in Zimbabwe could be driven by climate change. By 2030, annual urban damage could reach 26.9 million USD in Zimbabwe, by assuming that no additional flood protection is introduced.
Scenario C assumes that by 2030, 58.2% of the expected increase in annual urban damage in Zimbabwe could be driven by socio-economic change. This is with an assumption that no additional flood protection is introduced. Again, with the assumption of no introduction of any flood protection, by 2030, 41.8% of the expected increase in annual expected urban damage in Zimbabwe could be driven by climate change. By 2030, annual urban damage could reach 24.9 million USD in Zimbabwe, assuming that no additional flood protection is introduced.
Affected gross domestic product
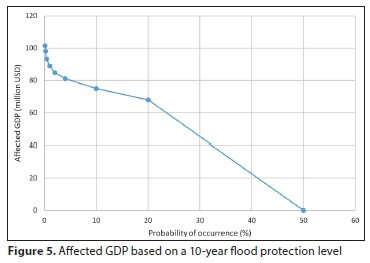
The Analyzer also gives an estimation of the GDP that is affected by inland flooding in a given area annually. The Analyzer overlays a global inundation map on a global GDP map to reveal the USD value of assets regularly exposed to inland floods (Analyzer 2016). Based on a 10-year flood protection level in Zimbabwe, Fig. 5 shows the affected GDP and Table 7 summarizes the results obtained from Fig. 5. The estimated 'affected GDP' will be a possible outcome if there is no flood protection

In Table 8, Scenarios A, B and C assume that the current annual expected affected GDP for Zimbabwe is 8.1 million USD, accounting for its existing country-wide average 10-year flood protection. Assuming that no flood protection is introduced, Scenario A predicts that by 2030, 57.4% of the expected increase in annual affected GDP in Zimbabwe could be driven by socio-economic change, 42.6% of the expected increase in annual expected affected GDP in Zimbabwe could be driven by climate change and the annual affected GDP could reach 19.9 million USD.

Scenario B projects that by 2030, 57.6% of the expected increase in annual affected GDP in Zimbabwe could be driven by socio-economic change, 42.4% of the expected increase in annual expected affected GDP in Zimbabwe could be driven by climate change and the annual affected GDP could reach 19.7 million USD in Zimbabwe, assuming that no additional flood protection is introduced.
By 2030, based on Scenario C, 40% of the expected increase in annual affected GDP in Zimbabwe could be driven by climate change, 60.0% could be driven by socio-economic change and the annual affected GDP could reach 21.7 million USD. This is with the assumption that no additional flood protection is introduced.
Affected population
'Affected population' shows an estimation of the number of people that are affected by inland flooding in a given area annually. The Analyzer overlays a global inundation map on a global population map to reveal the total population exposed to inland floods (Analyzer, 2016). Based on a 10-year flood protection level in Zimbabwe, Fig. 6 shows the affected population. Table 9 summarizes the results obtained from the points marked on the graph in Fig. 6. The estimated 'affected population' will be a possible outcome if there is no flood protection.


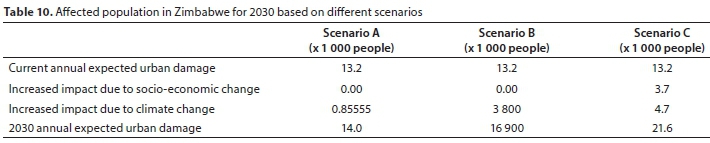
In Table 10, the current annual expected affected population for Zimbabwe is 13 200, based on Scenarios A, B and C, accounting for its existing country-wide average 10-year flood protection. Assuming that no flood protection level is employed, by 2030, the annual affected population could reach 14 000; 100% of the expected increase in annual affected population in Zimbabwe could be driven by climate change and 0% of the expected increase in annual affected population in Zimbabwe could be driven by socio-economic change.
No increase in affected population is expected to be driven by socio-economic change for scenarios A and B, thus by 2030, 100% of the expected increase in annual affected population in Zimbabwe could be driven by climate change. The annual affected population is projected to reach 16 900 by 2030, assuming that no additional flood protection is employed.
Scenario C predicts that by 2030, the annual affected population could reach 21 600, with 56.2% of the expected increase in annual affected population being driven by climate change and the remaining 43.8% of the expected increase in annual affected population being driven by socio-economic change, assuming no introduction of any additional flood protection level.
Drought severity assessment in Zimbabwe
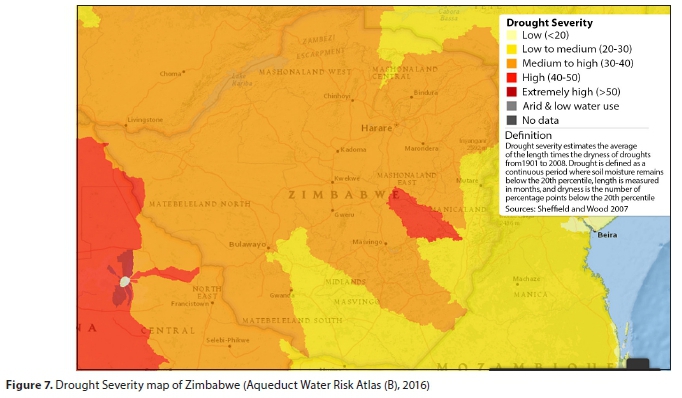
Drought severity is a rough approximation of the mean of the length/duration multiplied by how dry the droughts are from 1901-2008. Drought is an ongoing timeframe in which the moisture in the soil stays under the 20th percentile (Aqueduct Water Risk Atlas (B), 2016). Figure 7 shows the drought severity map of Zimbabwe. The results obtained using Aqueduct Water Risk Atlas show that the majority of Zimbabwe has a medium to high (30-40% probability) drought severity, save for a small area in between Masvingo, Mashonaland East, and Manicaland provinces, which have a high (40-50% probability) drought severity. The eastern border of Zimbabwe, the northern parts of Mashonaland Central province, Matabeleland South, Midlands and Masvingo provinces all have a low to medium (20-30% probability) drought severity.
CONCLUSION
It is impossible to eliminate drought and flood events, but a diminution approach and proper planning and preparation before their occurrence reduce the economic and social losses. In this study, a situational drought and flood analysis in Zimbabwe was outlined. The assessment was carried out using Aqueduct Global Flood Analyzer in which all analysis is based on the GDP, population, and the present and future (2030) urban damage. Three scenarios were employed in this study to effectively estimate future changes. The RCP scenario, which represents climate change, and the SSP scenario which represents socio-economic change, both from the Intergovernmental Panel on Climate Change 5th Assessment Report, were employed. 1981-2010 mean monthly precipitation data were used and Meteonorm V7 software was employed for the generation of the mean monthly precipitation from 2011 to 2100. The level of flood protection employed is a 10-year one which is used to identify the population at risk, the effects of this event on the GDP and to determine the rate at which urban damage is happening. This present study determined that, in any year, the majority of Zimbabwe has a low to medium (2-3% probability) flood occurrence in which a 10-year flood has a 10% occurrence probability. If there is no flood protection employed, this 10-year flood could cause around 74.9 million USD affected GDP, 119 thousand affected population and 49.5 million USD urban damage.
Given the limitations described above, the results are meant to provide a first impression of the distribution of risk among provinces and basins. This provides an indication of risk magnitude and an impression of the magnitude of future change in risk that can be expected. The results should be used to focus attention on certain vulnerable areas and open dialogues on the risks and how they can be managed. For the dimensioning of specific flood protection measures more detailed and locally calibrated models that include additional information on local conditions, including more accurate river profiles, structures, existing flood protection, reservoir conditions and management during floods, and more accurate information on exposure and vulnerability, are required. It would also require a thorough engagement with local experts and stakeholders.
ORCID
Remember Samu
https://orcid.org/0000-0003-4531-4815
REFERENCES
ACTALLIANCE (2018) Alert droughts. URL: http://www.actalliance.org (Accessed 27 March 2019). [ Links ]
ANALYZER AGF (2016) Floods.wri.org. http://floods.wri.org/#/country/253/Zimbabwe (Accessed 27 March 2019). [ Links ]
AQUEDUCT WATER RISK ATLAS (2016) URL: http://www.wri.org/applications/maps/aqueduct-atlas/#x=28.18&y=-21.93&s=ws!20!28!c&t=waterrisk&w=def&g=0&i=BWS-16!WSV-4!SV-2!HFO-4!DRO-4!STOR-8!GW-8!WRI-4!ECOS-2!MC-4!WCG-8!ECOV-2!&tr=ind-1!prj-1&l=6&b=terrain&m=single-HFO (Accessed 27 March 2019). [ Links ]
ASUMADU-SARKODIE S, RUFANGURA P, JAYAWEERA H and OWUSU PA (2015a) Situational analysis of flood and drought in Rwanda. Int. J. Sci. Eng. Res. 6 (8) 960-970. https://doi.org/10.14299/ijser.2015.08.013 [ Links ]
ASUMADU-SARKODIE S, OWUSU PA and RUFANGURA P (2015b) Impact analysis of flood in Accra, Ghana. Adv. Appl. Sci. Res. 6 (9) 53-78. [ Links ]
BATES BC, KUNDZEWİCZ ZW, WU S and PALUTİKOF JP (eds) (2008) Climate Change and Water. Technical paper of the Intergovernmental Panel on Climate Change. Climate Change and Water, IPCC Secretariat, Geneva. 210 pp. [ Links ]
BOLA G, MABIZA C, GOLDIN J, KUJINGA K, NHAPI I, MAKURIRA H and MASHAURI D (2014) Coping with droughts and floods: A case study of Kanyemba, Mbire district, Zimbabwe. Phys. Chem. Earth. 67-69 180-186. https://doi.org/10.1016/j.pce.2013.09.019 [ Links ]
BRAKENRİDGE GR (2010) Global active archive of large flood events. Dartmouth Flood Observatory, University of Colorado. [ Links ]
BROWN D, CHANAKIRA RR, CHATIZA K, DHLIWAYO M, DODMAN D, MASIIWA M, MUCHADENYIKA D, MUGABE P and ZVIGADZA S (2012) Climate change impacts, vulnerability and adaptation in Zimbabwe. IIED Climate Change Working Paper No. 3. IIED, London. [ Links ]
CHAMAILLE-JAMMES S and MURINDAGOMO HF (2007) Detecting climate change of concern in highly variable environments: Quantile regression reveals that droughts worsen in Hwange National Park, Zimbabwe. J. Arid Environ. 71 321-326. https://doi.org/10.1016/j.jaridenv.2007.05.005 [ Links ]
CHIKOTO GL and SADIQ A (2012) Zimbabwe's Emergency Management System: A Promising Development. In: McEntire D (ed.) Comparative Emergency Management: Understanding Disaster Policies, Organizations, and Initiatives from Around the World. FEMA, US Department of Homeland Security, Indianapolis. [ Links ]
CHIKOZHO C (2010) Applied social research and action priorities for adaptation to climate change and rainfall variability in the rainfed agricultural sector of Zimbabwe. Phys. Chem. Earth. 35 780-790. https://doi.org/10.1016/j.pce.2010.07.006 [ Links ]
DALU T, MWAZVITA TB and SHACKLETON CM (2018) Influence of land cover, proximity to streams and household topographical location on flooding impact in informal settlements in the Eastern Cape, South Africa. Int. J. Disaster Risk Reduction. 28 (June) 481-490. https://doi.org/10.1016/j.ijdrr.2017.12.009. [ Links ]
DAVIES R (2015) Flood list, Zimbabwe - 1 missing after heavy rain floods Harare. URL: http://floodlist.com/africa/zimbabwe-floods-1-missing-harare (Accessed 2 February 2017). [ Links ]
DOUGLAS I, ALAM K, MAGHENDA M, MCDONNELL Y, MCLEAN L and CAMPBELL J (2008) Unjust waters: climate change, flooding and the urban poor in Africa. Environ. Urbanization. 20 (1) 187-205. https://doi.org/10.1177/0956247808089156. [ Links ]
EDENHOFER O, PICHS-MADRUGA R, SOKONA Y, BARROS V, FIELD CB, ZWICKEL T, SCHLOEMER S, EBI K, MASTRANDREA M, MACH K and VON SC (eds ) (2012) IPCC, (2012): Workshop Report of the Intergovernmental Panel on Climate Change Workshop on Socio-Economic Scenarios. IPCC Working Group III Technical Support Unit, Potsdam Institute for Climate Impact Research, Potsdam Germany. [ Links ]
EILANDER D, WINSEMIUS H, WARD P, LOAIZA AD, HAAG A, MARTIN V and LUO T (2017) Global coastal flood hazard mapping. In: Proc. 19th EGU General Assembly, EGU2017, 23-28 April 2017, Vienna. [ Links ]
CRED (Centre for Research on the Epidemiology of Disasters) (2016) EM-DAT: The OFDA/CRED International Disaster Database. http://emdat.be/country_profile/index.html (Accessed 30 October 2016). [ Links ]
FAO (Food and Agriculture Organization of the United Nations) (1997) Fisheries management of small water bodies in seven countries in Africa. URL: http://www.fao.org/docrep/w7560e/W7560E02.htm (Accessed 27 December 2016). [ Links ]
GAIA (1994) State of the Environment in Southern Africa, SADC, 1994; Zimbabwe: Landuse in Dry Tropical Savannas. http://www.ess.co.at/GAIA/CASES/ZIM/drought.html (Accessed 17 December 2016). [ Links ]
GASSERT F, LUCK M, LANDIS M, REIG P and SHIAO (2015) Aqueduct Global Maps 2.1: Constructing Decision-Relevant Global Water Risk Indicators. Working Paper. World Resources Institute. Washington, DC. [ Links ]
GORNALL J, BETTS R, BURKE E, CLARK R, CAMP J, WILLETT K and WILTSHIRE A (2010) Implications of climate change for agricultural productivity in the early twenty-first century. Phil. Trans. R. Soc. Lond. Series B, Biol. Sci. 365 2973-2989. https://doi.org/10.1098/rstb.2010.0158. [ Links ]
GWIMBI P (2009) Linking rural community livelihoods to resilience building in flood risk reduction in Zimbabwe. Jàmbá. J. Disaster Risk Stud. 2 (1) 80-89. https://doi.org/10.4102/jamba.v2i1.16 [ Links ]
HICKS D (1993) An Evaluation of the Zimbabwe Drought Relief Programme 1992/1993: The roles of household-level response and decentralized decision making. World Food Program, Harare. [ Links ]
KERSHANI C and SMITHERS J (2005) Continuous simulation modelling for design flood estimation in South Africa: Preliminary investigations in the Thukela Catchment. Phys. Chem. Earth. 30 (11-16) 634-638. https://doi.org/10.1016/j.pce.2005.08.002. [ Links ]
KJELDSEN TR, SMITHERS JC and SCHULZE RE (2002) Regional flood frequency analysis in the Kwazulu-Natal Province, South Africa, using the index-flood method. J. Hydrol. 255 (1-4) 194-211. https://doi.org/10.1016/S0022-1694(01)00520-0. [ Links ]
LI LP, ZHANG KM, LUO T and X F (2013) An analysis of the drought and flood hazard characteristics and risks during the pre-rainy season in South China. Nat. Hazards. 71 (2) 1195-1213. [ Links ]
LIGTVOET W, VAN MINNEN J and FRANKEN R (2013) The effect of Climate Change in the Netherlands: 2012. PBL Netherlands Environmental Assessment Agency, The Hague. [ Links ]
LUCK M, LANDIS M and GASSERT F (2015) Aqueduct Water Stress Projections: Decadal Projections of Water Supply and Demand Using CMIP5 GCMs. Technical Note. World Resources Institute, Washington, DC. https://www.wri.org/sites/default/files/aqueduct-water-stress-projections-technical-note.pdf (Accessed 8 April 2019). [ Links ]
MADAMOMBE EK (2004) Zimbabwe: flood management practices - selected flood-prone areas Zambezi basin. Integrated Flood Management, The Associated Programme on Flood Management. World Meteorological Organization / Global Water Partnership. http://www.floodmanagement.info/publications/casestudies/cs_zimbabwe_full.pdf. (Accessed 8 April 2019). [ Links ]
MANATSA D, MUKWADA G, SIZIBA E and CHINYANGANYA T (2010) Analysis of multidimensional aspects of agricultural drought in Zimbabwe using Standard Precipitation Index (SPI). Theor. Appl. Climatol. 102 287-305. https://doi.org/10.1007/s00704-010-0262-2 [ Links ]
MAPHOSA B (1994) Lessons from the 1992 drought in Zimbabwe: The quest for alternative food Policies. Nord. J. Afr. Stud. 3 (1) 53-58. [ Links ]
MAZVIMAVI D (2010) Investigating changes over time of annual rainfall in Zimbabwe. Hydrol. Earth Syst. Sci. 14 2671-2679. https://doi.org/10.5194/hess-14-2671-2010 [ Links ]
METEONORM (2016) http://www.meteonorm.com/en/ (Accessed 17 December 2016). [ Links ]
MUBAYA CP, NJUKI J, LIWENGA E, MUTSVANGWA EP and MUGABE FT (2010) Perceived impacts of climate-related parameters on smallholder farmers in Zambia and Zimbabwe. J. Sustainable Dev. Afr. 12 (5) 170-186. [ Links ]
MUKWADA G and MANATSA D (2018) Is Climate change the nemesis of rural development? An analysis of patterns and trends of Zimbabwean droughts. In: Mal S, Singh R and Huggel C (eds) Climate Change, Extreme Events and Disaster Risk Reduction, Sustainable Development Goal Series. Springer, Cham. https://doi.org/10.1007/978-3-319-56469-2_12 [ Links ]
MUTASA M (2010) Zimbabwe's drought conundrum: vulnerability and coping in Buhera and Chikomba districts. MSc thesis, Department of International Environment and Development Studies, Norwegian University of Life Sciences. [ Links ]
MUTSAKA F (2017) Nearly 250 people have died from flooding in Zimbabwe, months after severe drought. https://globalnews.ca/news/3285461/zimbabwe-flooding-kills-250/ (Accessed 8 April 2019). [ Links ]
NANGOMBE SS (2013) Drought conditions and management strategies in Zimbabwe. Meteorological Services Department, Harare, Zimbabwe. https://www.ais.unwater.org/ais/pluginfile.php/601/mod_page/content/29/Zimbabwe.pdf [ Links ]
NATHANAEL JJ, SMITHERS JC and HORAN MJC (2018) Assessing the performance of regional flood frequency analysis methods in South Africa. Water SA. 44 (3) 387-398. https://doi.org/10.4314/wsa.v44i3.06. [ Links ]
NCHITO WS (2007) Flood risk in unplanned settlements in Lusaka. Environ. Urbanization. 19 (2) 539-551. https://doi.org/10.1177/0956247807082835. [ Links ]
OSBORN N (2016) Climate information for Zimbabwe climate observations. https://crudata.uea.ac.uk/~timo/climgen/national/web/Zimbabwe/obs.htm (Accessed 8 April 2019). [ Links ]
PACHAURI RK, ALLEN MR, BARROS VR, BROOME J, CRAMER W, CHRIST R and DASGUPTA P (eds) (2014) Climate Change 2014: Synthesis report. Contribution of Working Group I, II and III to the fifth assessment report of the Intergovernmental Panel on Climate Change (IPCC). [ Links ]
PCR-GLOBWB (2017) PCR-GLOBWB: PCRaster Global Water Balance, 2017. http://pcraster.geo.uu.nl/projects/applications/pcrglobwb/ (Accessed 11 March 2018). [ Links ]
RALEIGH C, CHOI HJ and KNIVETON D (2015) The devil is in the details: An investigation of the relationships between conflict, food price and climate across Africa. Glob. Environ. Change. 32 187-199. https://doi.org/10.1016/j.gloenvcha.2015.03.005 [ Links ]
SAMU R and KENTEL AS (2018) An analysis of the flood management and mitigation measures in Zimbabwe for a sustainable future. Int. J. Disaster Risk Reduction. 31 691-697. Oct. 2018. https://doi.org/10.1016/j.ijdrr.2018.07.013 [ Links ]
SCHLECHTER D (2013) The worst drought in memory - Namibia | ReliefWeb. https://reliefweb.int/report/namibia/worst-drought-memory (Accessed 20 May 2019). [ Links ]
SHARE F (2015) Nehanda radio, Zimbabwe fights worst flooding in years. http://nehandaradio.com/2015/01/09/zimbabwe-fights-worst-flooding-years/ (Accessed 17 December 2016). [ Links ]
SHEFFIELD J and WOOD EF (2008) Projected changes in drought occurrence under future global warming from multi-model, multi-scenario, IPCC AR4 simulations. Clim. Dyn. 31 79-105 [ Links ]
SIFUNDZA LS, VAN DER ZAAG P and MASIH I (2019) 2016 El Niño Drought in the Komati Catchment in Southern Africa: Lessons to support future drought management. Water SA. 45 (4) 547-559. https://doi.org/10.17159/wsa/2019.v45.i4.7535. [ Links ]
SIMANE B, BEYENE H, DERESSA W, KUMIE A, BERHANE K and SAMET J (2016) Review of climate change and health in Ethiopia: Status and gap analysis. Ethiop J. Health Dev. 30 28-41. [ Links ]
SUTANUDJAJA E, VAN BEEK R, WINSEMIUS H, WARD P and BIERKENS M (2017) New version of 1 km global river flood hazard maps for the next generation of aqueduct global flood analyzer. In: Proc. 19th EGU General Assembly, EGU2017, 23-28 April 2017, Vienna. 9669. [ Links ]
TAYLOR A (2013) Information on Zimbabwe's climate and how it is changing. Climate Systems Analysis Group, University of Cape Town. https://www.weadapt.org/knowledge-base/using-climate-information/zimbabwe-climate-analysis (Accessed 2 February 2017). [ Links ]
TURRAL H, BURKE J and FAURES JM (2008) Climate Change, Water and Food Security. FAO, Rome. [ Links ]
UN Zimbabwe (2000) Reliefweb. Floods disaster in Zimbabwe. Technical Report by United Nations Country Team. http://reliefweb.int/report/zimbabwe/floods-disaster-zimbabwe (Accessed 8 April 2019). [ Links ]
WARD PJ, JONGMAN B, SPERNA WEILAND F, BOUWMAN AA, VAN BEEK R, BIERKENS MFP, LIGTVOET W and WINSEMIUS HC (2013) Assessing flood risk at the global scale: model setup, results, and sensitivity. Environ. Res. Lett. 8 8044019. https://doi.org/10.1088/1748-9326/8/4/044019 [ Links ]
WARD PJ, KUMMU M and LALL U (2016) Flood frequencies and durations and their response to El Niño Southern Oscillation: Global analysis. J. Hydrol. 539 358-378. https://doi.org/10.1016/j.jhydrol.2016.05.045 [ Links ]
WINSEMIUS HC, JEROEN CJH, AERT S, LUDOVICUS PH, VAN BEEK, MARC FP, BIERKENS, PAUL L, BOUWMAN LA, JONGMAN B, KWADIJK JCJ, LIGTVOET W, VAN VUUREN DP and WARD PJ (2015) Global drivers of future river flood risk. Nat. Clim. Change. 6 381-385. https://doi.org/10.1038/nclimate2893. [ Links ]
WINSEMIUS HC, VAN BEEK LPH, JONGMAN B, WARD PJ and BOUWMAN AA (2012) A framework for global river flood risk assessments. Hydrol. Earth Syst. Sci. Discuss. 9 (8) 9611-9659. https://doi.org/10.5194/hessd-9-9611-2012 [ Links ]
WORLD BANK (2019) Surface area (sq. km). http://data.worldbank.org/indicator/AG.SRF.TOTL.K2 (Accessed 8 April 2019). [ Links ]
WORLD BANK GROUP (2017) Climate Change Knowledge Portal. https://www.worldbank.org/en/country/zimbabwe/overview (Accessed 13 June 2020). [ Links ]
WORLD POPULATION REVIEW (2019) Zimbabwe population. http://worldpopulationreview.com/countries/zimbabwe-population/ (Accessed 8 April 2019). [ Links ]
WORLD ATLAS (2019) Zimbabwe Geography. http://www.worldatlas.com/webimage/countrys/africa/zimbabwe/zwland.htm (Accessed 08 April 2019). [ Links ]
 Correspondence:
Remember Samu
Email: R.Samu@murdoch.edu.au
Received: 16 August 2019
Accepted: 17 June 2020

