


Services on Demand
Article
 English (pdf)
 Article in xml format
 Article references
Indicators

Related links
-
 Cited by Google
 -
 Similars in Google
Share

 Permalink
Water SA
On-line version ISSN 1816-7950
Print version ISSN 0378-4738
Water SA vol.46 n.3 Pretoria Jul. 2020
http://dx.doi.org/10.17159/wsa/2020.v46.i3.8654
RESEARCH PAPERS
Climate trends in the Cape Town area, South Africa
Mark R JuryI, II
IGeography Dept, University of Zululand, KwaDlangewa, South Africa
IIPhysics Dept, University of Puerto Rico Mayagüez, Mayagüez, USA
ABSTRACT
Climatic conditions near Cape Town, South Africa (34°S, 19°E) are analysed for historical trends in station measurements in the 20th century and in modern satellite-blended datasets. Despite the variety of datasets and record lengths, all show a steady drying trend. Faster rates of warming, 0.1°C∙yr-1, are found in land surface temperatures during the period 2000-2017. Drying trends are most acute to the northwest of the Hottentots Holland mountains. Hydrology station measurements in the Upper Berg River catchment since 1956 reveal a decline in streamflow of −0.012 m3∙s-1∙month-1, and an upward slope in potential evaporation of +0.020 W∙m-2 ∙month-1. Rainfall has declined most in May and September, indicating a shorter winter wet season. Features supporting the drying trend include an increase of easterly winds and low-level subsidence during summer. The clockwise circulation trend around Cape Town entrains dry air from the Karoo interior and the south coast upwelling zone, leading to negative sensible heat flux, a capping inversion and diminished orographic rainfall.
Keywords: Cape Town, climate trend, water deficit
INTRODUCTION
The southwestern (SW) Cape of South Africa (34°S, 19°E) lies at the transition between the sub-tropical easterly and mid-latitude westerly wind regimes, and has a semi-arid, rainy-winter climate. The adjacent interior (Karoo) has sparse vegetation fronted by coastal mountains over 1 000 m. Past research on climate change at country-scale has found a ~0.02°C∙yr-1 increase of temperature (Kruger and Shongwe, 2004; Morishima and Akasaka, 2010; Kruger and Nxumalo, 2016) consistent with global averages, and mixed trends in rainfall (Tadross et al., 2005; MacKellar et al., 2014). Yet, water resources within reach of Cape Town's 4 million people (west of 20°E) dwindled to <30% of storage capacity according to the Department of Water and Sanitation (DWS), at the time of conducting this research in 2018. The scarcity of water supplies initiated numerous engineering projects (Muller, 2017), and rationing of 50 L1∙day-1∙person-1. Here an analysis of meteorological factors underlying the climate trends contributing to water deficit was conducted to promote awareness and strategic planning. Since 1980, global greenhouse gases have risen 2 ppm∙yr-1, South Africa's industrial emissions exceeded 600 Mt∙yr-1 (Bekker et al., 2008; DEAT, 2009), and continental agricultural emissions reached 1 350 Mt∙yr-1 (Semazzi and Song, 2001; Sinha et al., 2003). This study focuses on the mesoscale structure of the drying trend, with equal focus on winter rain and summer desiccation.
DATA AND METHODS
The region near Cape Town, South Africa (SA), has a dense network of rainfall, streamflow and potential evaporation stations maintained by the Department of Water and Sanitation (DWS). Here monthly long-term records with >90% completeness are obtained in the Upper Berg River catchment for the period 1956-2017 for 3 stations with near-continuous records: 33.65°S, 19.01°E; 33.83°S, 19.08°E; 33.93°S, 19.06°E (positions shown in Fig. 2b). High resolution NOAA MODIS (cf. Table 1 acronyms) satellite data were analysed for land surface temperature and vegetation colour (2000-2017), to study both climate and land-use impacts. The dispersion of urban emissions is represented by OMI satellite NO2 measurements (Bucsela et al., 2013) averaged for 2010-2017. Gridded fields that have been generated by interpolation of station measurements since 1901 include: CRU4 rainfall and Palmer Drought Severity Index (PDSI; Harris et al., 2014) and GPCC7 rainfall (Schneider et al., 2014). Modern data assimilation of in-situ and satellite observations provide datasets starting in 1979: CHIRPS2 rainfall (Funk et al., 2015); NCEP2 atmosphere reanalysis (Kanamitsu et al., 2002); NOAAv2 sea surface temperature (SST; Reynolds et al., 2007), NOAA net outgoing long-wave radiation (OLR; Lee 2015), MERRA2 atmosphere reanalysis (Reinecker et al., 2011; Molod et al., 2015), and SODA3 ocean reanalysis since 1980 (Carton and Giese, 2008). Table 1 lists the datasets, resolution and starting dates employed herein. Wells et al. (2004) and Vicente-Serrano et al. (2010) describe how the CRU4 PDSI is formulated from station measurements of standardized precipitation minus potential evaporation anomalies. Here the PDSI in the area, 34.5-33.5°S, 18.5-19.5°E, is used to calculate trends by linear regression, as in Jury (2013, 2018). The rate of change or slope is evaluated across the field (for maps and sections) and within the study area (for time series) using parameters derived from reanalysis: wind circulation, air- land- sea-temperature, humidity, rainfall and vegetation. Statistical evaluations used the Pearson's 2-tailed t-test and degrees of freedom (DF). For records covering the period 1980-2017, the DF = 37 so 90% confidence is achieved when the correlation coefficient r > |0.27| or r2 > 0.06. Otto et al. (2018) employ similar datasets and statistical analyses to evaluate the drying trend.

The DWS hydrology analyses are conducted by averaging streamflow and (A-pan) potential evaporation data at the three stations in the Upper Berg River catchment (1956-2017), then filtering with an 18-month low-pass filter to remove seasonal cycles. The DWS time-series are then comparable with the filtered CRU4 PDSI precipitation minus potential evaporation anomalies. To achieve a mesoscale perspective on climate change, high-resolution products of limited record length are utilized. However multi-year variability may affect the results and requires evaluation. This is done by wavelet spectral analysis, and by cropping the PDSI time series at various start dates, and recalculating the linear regression slope and explained (r2) variance.
Ranking the satellite land surface temperature, a hot dry spell of 1-8 January 2011 was analysed using MERRA reanalysis fields and South African Weather Service hourly observations and radiosonde profiles from Cape Town airport (CPT). The case study helps link the Cape Town regional hydrology with climate change from rising greenhouse gases, amid natural multi-year fluctuations (Poccard et al., 2000).
The method for detecting trends, using linear regression and its r2 fit, is a simple approach that contributes to robust interpretations. One issue is the constraint of record length that depends on technological advances: (i) station rainfall since 1900, (ii) streamflow since 1950, (iii) satellite data since 1980, and (iv) high-resolution data since 2000. This issue is resolved by comparison of the longest record (PDSI) in those same eras.
RESULTS
Cape Town regional and spatial trends
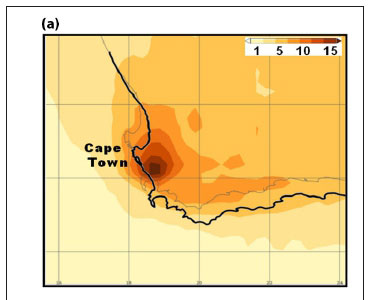
Cape Town's urban NO2 emissions (Fig. 1a) illustrate the atmospheric impact of 4 million residents and their resource needs (cf. Sousa et al., 2018). Higher pollution concentrations at 33.75°S, 18.75°E extend northward in a broad arc, according to OMI satellite measurements averaged 2010-2017. Values > 10 μg∙m-3 are consistent with in-situ data (Western Cape Government, 2017). The wind and rainfall trend map 1981-2017 (Fig. 1b) illustrates a broad cyclonic circulation trend and drying over the Cape Flats (31-34°S, 18-19°E) which lie northwest of the Hottentots Holland mountains.


SST trends (Fig. 1c) are positive offshore but negative nearshore (cf. Rouault et al., 2010), and point to the intensification of coastal upwelling by south-easterly winds from 1981-2017. The offshore Ekman transport and cyclonic wind shear lifts cool water over the shelf and strengthens the Benguela Current, with a desiccating effect as seen below.
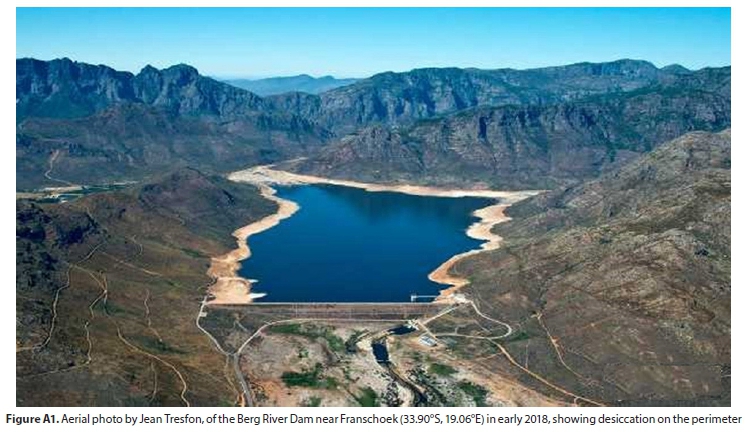
Land surface temperatures in the period 2000-2017 (Fig. 2c) display increases of 0.1°C∙yr-1 according to 1 km resolution MODIS infra-red data. Values are highest at the Berg River Dam, built in 2008 near Franschhoek (0.2°C∙yr-1), ~10 times above global and national means (Kruger and Shongwe, 2004). Such a high rate of warming is related with construction of the dam followed by water receding around its perimeter, and subsequent heating of bare soil during periods of high solar radiation (Appendix, Fig. A1; cf. Earth observatory 2018). In conjunction, the vegetation colour fraction has declined in the mountain catchments (Fig. 2d), around the water reservoirs (−0.02∙yr-1), and over the Cape Flats urban area. A lower vegetation fraction gives off less transpired moisture. In contrast, 'greening' is noted in the MODIS era (2000-2017) to the east of the Hottentots Holland > 19.1°E (+0.01∙yr-1), where CHIRPS2 rainfall trends (1981-2017) are weakly positive (Fig. 2e) due to up-slope easterly winds (cf. Fig. 4e).
The main hydrological concern is the diminishing rainfall north-west of the Hottentots Holland, across the populated Cape Flats. The annual rain trend is −0.5 mm∙month-1∙yr-1 in the vicinity of Wellington (33.64°S, 19.00°E). The histogram of NOAA infrared vegetation temperature, comparing the 1982-1988 and 2010-2016 era (Fig. 2f), illustrates shifts in both cold and warm seasons. In the 12.5°C range typical of winter, there was a reduction from 18 to 12 months. In the 30-32.5°C range typical of summer, there was an increase from 3 to 24 months. The histogram indicates a rapidly warming summer climate, which is placed in context below. The reader is referred to Fig. A2 (Appendix) for a comparison of PDSI trends over different record lengths.
Temporal characteristics
In this section, a temporal analysis is presented for station observations in the study area (cf. Fig. 2a,b). Ensemble rainfall trends per month since 1901 (Fig. 3a) are downward in most months, especially in May and September, at the beginning and end of winter. Filtered streamflow and potential evaporation anomalies in the Upper Berg River catchment since 1956 (Fig. 3b) reveal significant drying trends, with r2 variance of 31% and 41%, respectively. The downward slope of filtered streamflow anomalies is −0.012 m3∙s-1∙month-1; while the upward slope of filtered potential evaporation anomalies is +0.020 W∙m-2∙month-1. Streamflows nearly ceased by 2017 (end of record).
The filtered CRU4 PDSI anomalies since 1901 (Fig. 3c) reveal a persistent downward trend through the 20th century, consistent with Wolski, (2018). The 1970s saw a prolonged dry spell that recurred in the most recent decade (2010+). Apart from the 1950s and 1980s, the surface water balance has shown deficit conditions: potential evaporation exceeded precipitation. The downward trend in PDSI is 17% of total variance (1901-2017).
Multi-year variability is evaluated by wavelet spectral analysis in Fig. 3d. A persistent ~11-year period is found from 1930 to 1980. This cycle fades out and is replaced by a ~5-year oscillation. Sousa et al. (2018) show how the Southern Hemisphere circulation affects moisture flows, producing multi-year variability around the drying trend.
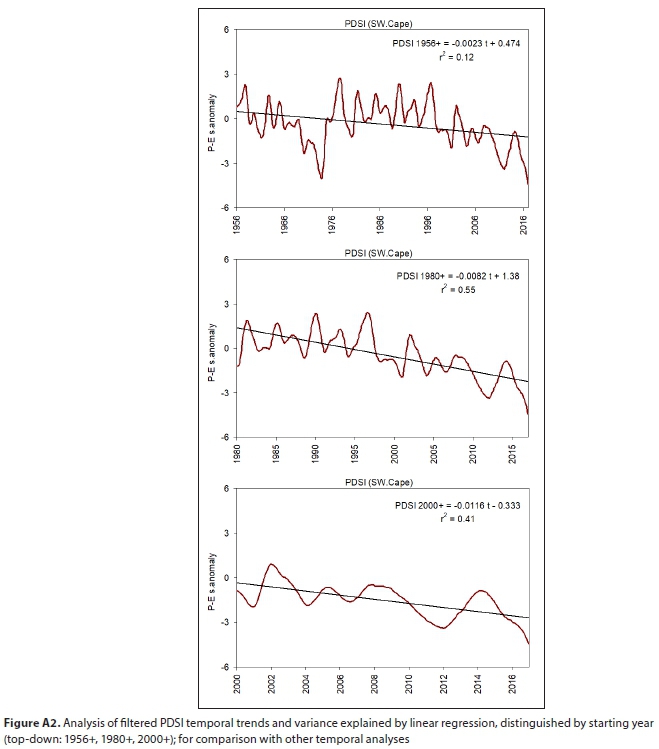
The filtered PDSI record is cropped at various start dates to assess the influence of multi-year variability on linear trends in Fig. A2 (Appendix). Starting in 1956: the slope is −0.0023 and r2 variance 12%; cropped from 1980: the slope is −0.0082 and variance is 55%; and cropped from 2000 the slope is −0.0116 and variance is 41%. Both linear slope and variance intensify, suggesting that multi-year variability is gradually overshadowed by trends attributable to climate change.
The above-mentioned station-based results are supported by satellite net OLR data averaged over the study area (Table 2) segregated by month. Positive trends that refer to reduced cloud cover are most significant in the December to April months (1979-2017). A similar analysis of MERRA zonal winds (not shown) found significantly increased surface easterly winds in December, January and April.

Regional features associated with the drying trend
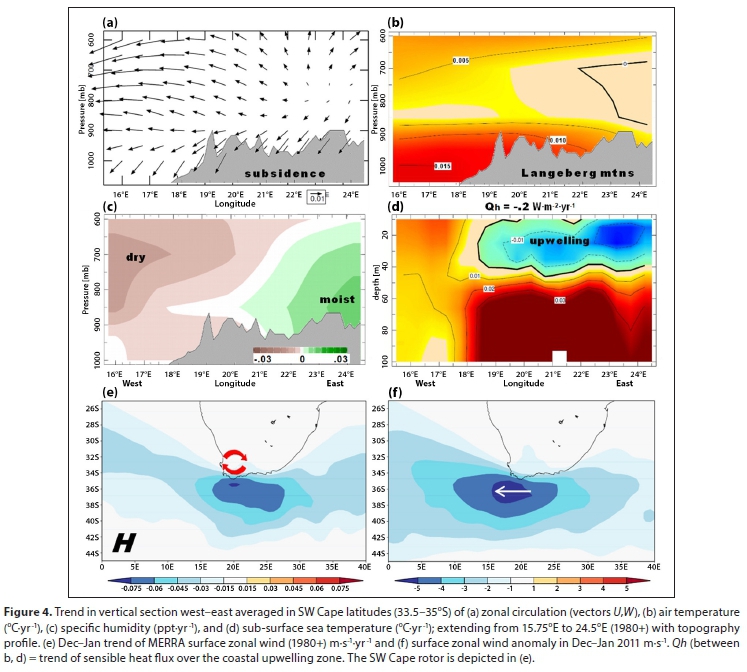
Trends are mapped in vertical sections along 34°S from 15.5°E to 24.5°E in Fig. 4a-d. A surprising result is that subsident trends within the easterlies are strongest south of the Langeberg mountains (20-24°E). Air temperature trends are relatively weak at 0.01°C∙yr-1 in the 1 000-900 hPa layer. Warming increases westward, consistent with a change from moistening 21-24°E to drying 16-19°E. Botai et al. (2017) found a similar east-west pattern in their trend analyses.
Turning attention to the shelf oceanography, it is evident that upwelling has intensified (−0.02°C∙yr-1) from surface to 40 m depth to the east of 19°E, despite a warming trend elsewhere in the period 1980-2016. The warm air/cool sea trend causes sensible heat flux (Qh) to decline at −0.2 W∙m-2∙yr-1. Hence the lower atmosphere is stabilized along the South Cape coast. As a secondary consequence, the subsidence inversion strengthens and caps the surface easterly flow, as outlined in Jury and Reason (1989). The Froude number, calculated from F = U∕NH, offers a way to determine whether the airflow will ascend the SW Cape mountains (F ≥ 1) or go around them (F < 1). With a westerly wind of U = 10 m∙s-1, a mountain height of H = 103 m, and a winter-time unstable (dθ∕dz) lapse rate of N = ((g∕θo)(dθ∕dz))0.5 ~10-2 s-1, the airflow lifts over the mountains causing stratiform rainfall. Under the summer-time easterly wind regime, the U and H values remain; but SST cooling and low-level warming (eg. −Qh) induce a stable lapse rate of N ~2∙10-2 s-1, so F = 0.5. The marine airflow is diverted around the mountains instead of going over the Hottentots Holland; leaving them sunny and prone to desiccation.
As the sub-tropical ridge shifts poleward, there is a broad zone of intensifying easterly flow from 32-40°S and 0-40°E (Fig. 4e), in agreement with Sousa et al. (2018). Evidence of Venturi acceleration at the southern tip of Africa (35°S, 20°E) emerges in zonal wind trends of −0.05 m∙s-1∙yr-1 (1980-2017). The associated easterly shear spins-up a wind rotor over the SW Cape (cf. Fig. 1b) with desiccating consequences.
The clockwise curvature of easterly winds can be traced to three influences: firstly, the change in coastal orientation, secondly, the daytime thermal gradient/sea-breeze and, thirdly, the land-friction/Ekman spiral. Seabreeze forcing is: dV = ((g H⁄θ) dθ⁄dy) dt with g = gravity, H = surface layer ~30 m, potential temperature θ ~300 K, dθ ~3K sea-land temperature increase, and dy, dt are length and time scales (both ~2 x 10⁴). The Ekman spiral effect is: V = Ug (e-az sin(−az)), with Ug geostrophic easterly wind (~10 m∙s-1), a = (f/2 K)0.5, z = 30 m, coriolis f = 7 10-5 s-1, and terrestrial eddy viscosity K > 2 m2∙s-1. As the easterly winds turn equatorward near Cape Town, subsidence is generated: W = V(ΔZ)(β/f), with V ~5 m∙s-1, thickness ΔZ ~3 x 10³ m, β = df/dy ~−1.5 10-11 s-1∙m-1, and f = 7 10-5 s-1. Sinking motion of W ~−3 x 10⁻³ m∙s-1 actively dries out the lower atmosphere. The regional pattern of zonal wind anomalies for Dec-Jan 2011 (Fig. 4f) is consistent with the long-term trend (negative over Cape Agulhas, cf. Fig. 4e), and leads into a case study dry spell.
Dry spell case study
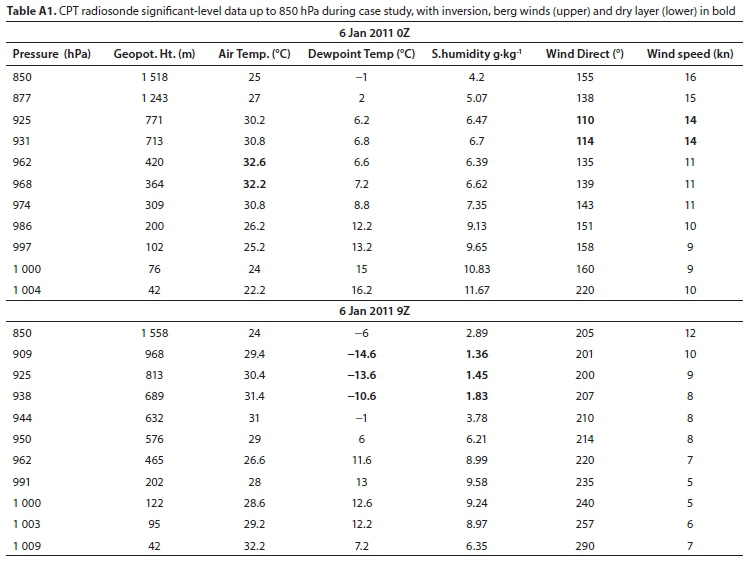
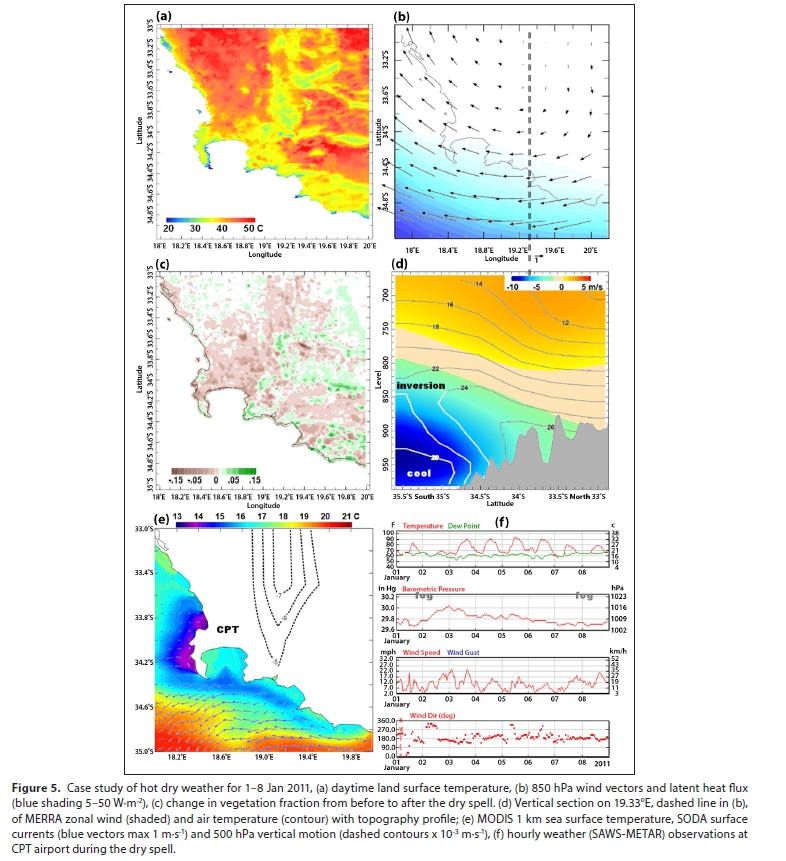
Ranking the MODIS daytime land surface temperature record in the SW Cape (33.5-34.5°S, 18.5-19.5°E), the period 1-8 January 2011 is the hottest case (42°C) in the period 2000-2017. The map of surface temperatures (Fig. 5a) reveals a narrow strip of cool conditions along the windward coastal promontories such as Cape Point (20°C). However, across the Cape Flats and interior valleys (Berg, Breede) the daytime land surface temperatures exceed 50°C! The airflow at 850 hPa (Fig. 5b) shows cyclonic curvature and > 5 m∙s-1 easterlies over the ocean to the south. The vegetation colour fraction (Fig. 5c) diminished by 0.1 from the end of December to mid-January 2011 in the Upper Berg River catchment, west of the Hottentots Holland mountains. A vertical section analysis shows a strong easterly 'jet' capped by an inversion (Fig. 5d) in the period 1-8 January 2011. In the offshore zone (35°S), the near-surface winds were 10 m∙s-1 and temperatures were < 20°C. During this dry spell, offshore ocean transport and coastal upwelling caused significant cooling over the shelf, evidenced by SST < 15°C (Fig. 5e). A consequence of warm air overlying cool sea is thermal stability, which inhibits the inland penetration of moisture (cf. Fig. 5b). The CPT weather station reported desiccating weather conditions for 3-6 January (Fig. 5f), characterized by Tmax = 34°C and Tdew = 16°C. Southerly winds strengthened for 3-4 January to 35 km∙h-1, and then abated following passage of the South Atlantic high pressure cell. CPT radiosonde profiles on 6 January 2011 (Table A1, Appendix) describe characteristics in the 400-700 m subsidence inversion: wind direction/speed 110°/14 kn, temperature 32.6°C, dewpoint −14.6°C, and specific humidity 1.36 g∙kg-1, due to entrainment of dry air from aloft (cf. 500 hPa sinking motions in Fig. 5e). Many DWS stations near Wellington recorded potential evaporation > 12 mm∙day-1!
SUMMARY
Hydro-climate trends near Cape Town, South Africa, were studied using historical observations since 1901, and gridded reanalysis fields and satellite observations since 1979. Trends (slope) were determined by linear regression and its r2 fit. This simple approach led to objective interpretations of a drying trend, regardless of record length. Hydrology station measurements in the Upper Berg River catchment since 1956 reveal a downward slope in filtered streamflow anomalies of −0.012 m3∙s-1∙month-1, and an upward slope in filtered potential evaporation anomalies of +0.020 W∙m-2∙month-1. Rainfall has declined most in May and September, indicating a shortening of the winter wet season. Multi-year variability has little effect on filtered PDSI trends in different periods: slopes are consistently downward (−0.0015 to −0.0116∙month-1) and explained variance remains significant (12-55%; cf. Fig. A2, Appendix). Despite the steadiness of drying, the variety of datasets and record lengths poses limitations.
The drying trend near Cape Town was associated with a poleward shift of the sub-tropical ridge, more frequent easterly winds, and a longer summer dry season. The easterly winds have secondary consequences: increased south coast upwelling and low-level subsidence over the Hottentots Holland (cf. Fig. 4a, c). The wind shear induces a cyclonic rotor around Cape Town which entrains dry air from the Karoo interior. Precipitation has declined particularly northwest of the Hottentots Holland mountains and many water reservoirs show diminishing inflows, increased surface temperature (+.1°C∙yr-1) and browning of nearby vegetation since 2000. The easterly winds derive from a zone of negative sensible heat flux over coastal upwelling, so the capping inversion (cf. Fig. 5d, Table A1, Appendix) inhibits orographic cloud development.
The regime shift from mid-latitude westerly winds and winter rainfall, to sub-tropical easterly winds and summer dry spells, has depleted water resources (Otto et al., 2018). Hence recycling, desalination, importation, and aquifer extraction projects are underway (Patel, 2018), and water conservation has become rooted in popular thinking and community awareness. The above results contribute to this educational initiative, and suggest that water scarcity in Cape Town, South Africa, will require ongoing vigilance.
ACKNOWLEDGEMENTS
South African Department of Education SAPSE funding support is acknowledged.
REFERENCES
APDRC HAWAII (2018) URL: http://apdrc.soest.hawaii.edu/las86/ (Accessed 17 May 2018). [ Links ]
BEKKER B, EBERHARD A, GAUNT T and MARQUARD A (2008) South Africa's rapid electrification programme: Policy, institutional, planning, financing and technical innovations. Energ. Polic. 36 3125-3137. https://doi.org/10.1016/j.enpol.2008.04.014 [ Links ]
BOTAI CM, BOTAI JO, DE WIT JP, NCONGWANE KP and ADEOLA AM (2017) Drought characteristics over the Western Cape Province, South Africa. Water. 9 876. https://doi.org/10.3390/w9110876 [ Links ]
BUCSELA EJ, KROTKOV NA, CELARIER EA, LAMSAL LN, SWARTZ WH, BHARTIA PK, BOERSMA KF, VEEFKIND JP, GLEASON JF and PICKERING KE (2013) A new stratospheric and tropospheric NO2 retrieval algorithm for nadir-viewing satellite instruments, applications to OMI. Atmos. Meas. Tech. 6 2607-2626. https://doi.org/10.5194/amt-6-2607-2013 [ Links ]
CARTON JA and GIESE BS (2008) A reanalysis of ocean climate using Simple Ocean Data Assimilation (SODA). Mon. Weather Rev. 136 2999-3017. https://doi.org/10.1175/2007MWR1978.1 [ Links ]
DEAT (Department of Environmental Affairs and Tourism, South Africa) (2009) Greenhouse gas inventory of South Africa: 1990-2000. Pretoria. [ Links ]
DWS (Department of Water and Sanitation, South Africa) (2018) URL: http://www.dwa.gov.za/Hydrology/ (Accessed 22 May 2018). [ Links ]
EARTH OBSERVATORY (2018) Satellite photos. www.earthobservatory.nasa.gov/IOTD/view.php?id=91649 (Accessed April 2018). [ Links ]
FUNK CC, PETERSON PJ, LANDSFELD MF, PEDREROS DH, VERDIN JP, ROWLAND JD, ROMERO BE, HUSAK GJ, MICHAELSEN JC and VERDIN AP (2014) A quasi-global precipitation time series for drought monitoring: U.S. Geol. Surv. Data Ser. 832 4 pp. https://doi.org/10.3133/ds832 [ Links ]
HARRIS I, JONES PD, OSBORN TJ and LISTER DH (2014) Updated high-resolution grids of monthly climatic observations, the CRUv4 Dataset. Int. J. Climatol. 34 623-642. https://doi.org/10.1002/joc.3711 [ Links ]
IRI CLIMATE LIBRARY (2018) URL: https://iridl.ldeo.columbia.edu/sources/ (Accessed 7 May 2018). [ Links ]
JURY MR and REASON CJ (1989) Extreme subsidence in the Agulhas-Benguela air mass transition. Bound. Layer Meteorol. 46 35-51. https://doi.org/10.1007/BF00118445 [ Links ]
JURY MR (2013) Climate trends in southern Africa. S. Afr. J. Sci. 109 53-63. https://doi.org/10.1590/sajs.2013/980 [ Links ]
JURY MR (2018) Climate trends across South Africa since 1980. Water SA 44 297-307. https://doi.org/10.4314/wsa.v44i2.15 [ Links ]
KANAMITSU M, EBISUZAKI W, WOOLLEN J, YANG S, HNILO JJ, FIORINO M and POTTER GL (2002) NCEP-DOE AMIP-II Reanalysis (R-2). Bull. Am. Meteorol. Soc. 83 1631-1643. https://doi.org/10.1175/BAMS-83-11-1631(2002)083<1631:NAR>2.3.CO;2 [ Links ]
KNMI CLIMATE EXPLORER (2018) URL: http://climexp.knmi.nl/ (Accessed 12 May 2018). [ Links ]
KRUGER AC and SHONGWE S (2004) Temperature trends in South Africa: 1960-2003. Int. J. Climatol. 24 1929-1945. https://doi.org/10.1002/joc.1096 [ Links ]
KRUGER AC and NXUMALO MP (2016) Surface temperature trends from homogenized time series in South Africa: 1931-2015. Int. J. Climatol. 37. https://doi.org/10.1002/joc.4851 [ Links ]
LEE H-T (2014) Climate algorithm theoretical basis document: Outgoing long-wave radiation (OLR). NOAA's Climate Data Record (CDR) Program, CDRP-ATBD-0526. 46 pp. [ Links ]
MACKELLAR N, NEW M and JACK C (2014) Observed and modelled trends in rainfall and temperature for South Africa: 1960-2010. S. Afr. J. Sci. 110 1-13. https://doi.org/10.1590/sajs.2014/20130353 [ Links ]
MITCHELL TD and JONES PD (2005) An improved method of constructing a database of monthly climate observations and associated high-resolution grids. Int. J. Climatol. 25 693-712. https://doi.org/10.1002/joc.1181 [ Links ]
MORISHIMA W and AKASAKA I (2010) Seasonal trends of rainfall and surface temperature over Southern Africa. Afr. Stud. Monogr. 40 67-76. [ Links ]
MOLOD A, TAKACS L, SUAREZ M and BACMIESTER J (2015) Development of the GEOS-5 atmospheric general circulation model: evolution from MERRA to MERRA2. Geosci Model Dev. 8 1339-1356. https://doi.org/10.5194/gmd-8-1339-2015 [ Links ]
MULLER M (2017) Understanding Cape Town's Water Crisis. Civil Engineering June 2017. https://ssrn.com/abstract=2995937. 11-16. [ Links ]
OTTO FEL, WOLSKI P, LEHNER F, TEBALDI C, VAN OLDENBORGH GJ, HOGESTEEGER S, SINGH R, HOLDEN P, FUCKAR NS, ODOULAMI RC and NEW M (2018) Anthropogenic influence on the drivers of the Western Cape drought 2015-2017. Environ. Res. Lett. 13 124010. [ Links ]
PATEL M (2018) Desalination in South Africa: panacea or peril for industrial development? URL: www.tips.org.za/research-archive/sustainable-growth/item/3500-desalination-in-south-africa-panacea-or-peril-for-industrial-development. 41 pp. [ Links ]
POCCARD I, JANICOT S and CAMBERLIN P (2000) Comparison of rainfall structures between NCEP/NCAR reanalyses and observed data over tropical Africa. Clim. Dyn. 16 897-915. https://doi.org/10.1007/s003820000087 [ Links ]
REYNOLDS RW, SMITH TM, LIU C, CHELTON DB, CASEY KS and SCHLAX MG (2007) Daily high-resolution blended analyses for sea surface temperature. J. Clim. 20 5473-5496. https://doi.org/10.1175/2007JCLI1824.1 [ Links ]
RIENECKER MM, SUAREZ MJ, GELARO R, TODLING R, BACMEISTER J, LIU E, BOSILOVICH MG, SCHUBERT SD, TAKACS L, KIM G and co-authors (2011) MERRA: NASA's modern-era retrospective analysis for research and applications. J. Clim. 24 3624-3648. https://doi.org/10.1175/JCLI-D-11-00015.1 [ Links ]
ROUAULT M, POHL B and PENVEN P (2010) Coastal oceanic climate change and variability from 1982 to 2009 around South Africa. Afr. J. Mar. Sci. 32 237-246. https://doi.org/10.2989/1814232X.2010.501563 [ Links ]
SCHNEIDER U, BECKER A, FINGER P, MEYER-CHRISTOFFER A, ZIESE M and RUDOLF B (2014) GPCC's new land surface precipitation climatology based on quality-controlled in situ data and its role in quantifying the global water cycle. Theor. Appl. Climatol. 115 15-40. https://doi.org/10.1007/s00704-013-0860-x [ Links ]
SEMAZZI FHM and SONG Y (2001) A GCM study of climate change induced by deforestation in Africa. Clim. Res. 17 169-182. https://doi.org/10.3354/cr017169 [ Links ]
SINHA P, HOBBS PV, YOKELSON RJ, BERTSCHI IT, BLAKE DR, SIMPSON IJ, GAO S, KIRCHSTETTER TW and NOVAKOV T (2003) Emissions of trace gases and particles from savanna fires in southern Africa. J. Geophys. Res. 108 d13, 8487. https://doi.org/10.1029/2002JD002325 [ Links ]
SOUSA PM, BLAMEY RC, REASON CJC, RAMOS AM and TRIGO RM (2018) The 'Day Zero' Cape Town drought and the poleward migration of moisture corridors. Environ. Res. Lett. 13 124025. https://doi.org/10.1088/1748-9326/aaebc7 [ Links ]
TADROSS M, JACK C and HEWITSON B (2005) On RCM-based projections of change in southern African summer climate. Geophys. Res. Lett. 32 L23713. https://doi.org/10.1029/2005GL024460 [ Links ]
VICENTE-SERRANO SM, BEGUERIA S, LOPEZ-MORENO JL, ANGULO M and ElKENAWY A (2010) A new global 0.5° gridded dataset (1901-2006) of a multiscalar drought index: comparison with current drought index datasets based on the Palmer Drought Severity Index. J. Hydrometeorol. 11 1033-1043. https://doi.org/10.1175/2010JHM1224.1 [ Links ]
WELLS N, GODDARD S and HAYES MJ (2004) A self-calibrating Palmer drought severity index. J. Clim. 17 2335-2351. https://doi.org/10.1175/1520-0442(2004)017<2335:ASPDSI>2.0.CO;2 [ Links ]
WESTERN CAPE GOVERNMENT (2017) State of Environment Outlook Report for the Western Cape Province. Air quality. November 2017. http://ward2forum.org/wp-content/uploads/2017/11/W_Cape_SOER_08_Air_Quality.pdf [ Links ]
WOLSKI P (2018) How severe is Cape Town's 'Day Zero' drought? Significance 15 24-27. https://doi.org/10.1111/j.1740-9713.2018.01127.x [ Links ]
WUNDERMAP (2018). https://www.wunderground.com/wundermap (Accessed 22 May 2018). [ Links ]
 Correspondence:
Mark R Jury
Email:mark.jury@upr.edu
Received: 22 July 2019
Accepted: 8 June 2020
APPENDIX

