


Serviços Personalizados
Artigo
 Inglês (pdf)
 Artigo em XML
 Referências do artigo
Indicadores

Links relacionados
-
 Citado por Google
 -
 Similares em Google
Compartilhar

 Permalink
Water SA
versão On-line ISSN 1816-7950
versão impressa ISSN 0378-4738
Water SA vol.46 no.3 Pretoria Jul. 2020
http://dx.doi.org/10.17159/wsa/2020.v46.i3.8653
RESEARCH PAPERS
Investigating stable isotope effects and moisture trajectories for rainfall events in Johannesburg, South Africa
Khahliso Leketa*; Tamiru Abiye
School of Geosciences, University of the Witwatersrand, Private Bag X3, Wits 2050, Johannesburg, South Africa
ABSTRACT
This study investigated the isotopic composition of daily rainfall in Johannesburg from November 2016 to October 2018. The moisture sources and trajectories for rainfall events of extreme isotopic signatures were deduced using the Hybrid Single Particle Lagrangian Integrated Trajectory model (HYSPLIT). The results from time series and regression analysis show temperature and amount effects, with low coefficient of determination (R2) values of 0.21 and 0.12, respectively. The rainfall with amounts of <20 mm yielded a meteoric water line (MWL) with a slope of +6.9 and deuterium excess (d-excess) of +11.9‰. Rainfall with amounts of ≥20 mm had slope and d-excess values of +8.2 and +18.6‰, respectively. The lower slope in rainfall of <20 mm indicated the preferential occurrence of sub-cloud re-evaporation on light rainfall. Considering the lack of re-evaporation in heavy rainfall (≥20 mm), its slope and d-excess were approximated to those of incoming or in-cloud moisture prior to condensation. Therefore, a high d-excess of +18.6‰ in incoming moisture indicates evaporation that mainly occurs under warm sea surface temperature and low relative humidity. HYSPLIT shows that the moisture for the most depleted and the most enriched rainfall originates in the higher latitudes but differs in trajectory. The moisture for the most depleted rainfall had long residence in the higher latitudes following a semi-direct trajectory to Johannesburg, over the Atlantic and Indian Oceans. The most enriched rainfall followed a curved anticlockwise trajectory with long residence in the lower latitudes over the Indian Ocean. Circulation of saturated moisture over the warm Indian Ocean leads to a loss of light isotopes, thereby enhancing enrichment in the moisture that moves further inland. HYSPLIT indicated the importance of atmospheric conditions along the moisture trajectory on the signature of Johannesburg rainfall.
Keywords: stable isotope effects, deuterium excess, HYSPLIT, rainfall moisture sources, Johannesburg, South Africa
INTRODUCTION
Stable isotopes of water (δ18O and δ2H) have been widely used as tracers for the provenance of water in various reservoirs, including groundwater (Sami, 1992; Harris et al., 1998; Abiye et al., 2011; Ayadi et al., 2018; Leketa et al., 2018), soil water storage (Allison et al., 1983; Selaolo, 1998; Soderberg et al., 2012; Isokangas et al., 2017), groundwater-surface water interaction (Herczeg et al., 1992; Abiye et al., 2015) and vegetation (Evaristo and McDonnell, 2017; Shakhane et al., 2017). Moreover, various water resource assessment studies that incorporate the use of stable isotopes in South(ern) Africa have been documented in Abiye (2013).
In order to determine the provenance of water using stable isotopes, it is important to understand the isotopic signature of precipitation and its variations (Gat, 2010; Guan et al., 2013), so that the characteristic input signal that varies regionally and temporally can be provided for (Clark and Fritz, 1997). The use of stable isotopes for groundwater recharge characterisation is based on the comparison between groundwater signature (δ18O and δ2H) and that of precipitation (Clark and Fritz, 1997). The enrichment of groundwater often infers focused recharge occurring from a surface water body or existence of hot springs, while a depleted groundwater often infers direct diffuse recharge from rainfall (Sami, 1992; Healy, 2010). However, an extremely depleted groundwater sample could also infer an exchange of oxygen between CO2 and groundwater in dolomite-rich aquifers (Karolytė et al., 2017; Leketa et al., 2018; Leketa, 2019) rather than a recharge mechanism.
The regional and temporal variability in rainfall signature is influenced by the stable isotope effects, which are a function of the climate (temperature, humidity and amount of rainfall, etc.) and physical characteristics (elevation, distance from ocean, rainfall moisture sources, etc.). The stable isotope effects include, among others, the altitude effect, continental effect, temperature effect and amount effect (Dansgaard, 1964; Gat, 2001). Because of these climatic and physical characteristics, rainfall samples in a location form a regression line (meteoric water line) with a distinct slope and Y-intercept (deuterium excess) (Craig, 1961; Dansgaard, 1964; Clark and Fritz, 1997; Gat, 2001). As a result of the uniqueness of slope and deuterium excess (d-excess), the climatic and physical conditions at the rainfall location, in the atmosphere along the moisture trajectory and at the location of moisture source, can be inferred (Fritz et al., 1987; Guan et al., 2013).
The d-excess in precipitation depends on the temperature and humidity conditions at the sea surface during primary evaporation, humidity along the moisture trajectory and the occurrence of secondary evaporation (re-evaporation) in the sub-cloud (Fritz et al., 1987; Clark and Fritz, 1997; Guan et al., 2013). The d-excess of vapour at the sea surface is negatively correlated with relative humidity, while slightly positively correlated with sea surface temperature (Clark and Fritz, 1997; Pfahl and Wernli, 2008). Along the moisture trajectory from the ocean, any addition of vapour that evaporated from continental reservoirs results in an increase of d-excess in the resultant precipitation (Guan et al., 2013). Additionally, the occurrence of sub-cloud re-evaporation leads to a decrease in rainfall d-excess (Clark and Fritz, 1997), while an exchange of moisture with vapour in the sub-cloud layers, that have higher d-excess, may lead to an increase of d-excess in the falling raindrop (Guan et al., 2013). The slope of the meteoric water line (MWL) depends on the average temperature during condensation and the occurrence of secondary evaporation during rainout (Clark and Fritz, 1997; Guan et al., 2013). After condensation, as rainfall passes through dry air, some water re-evaporates causing enrichment of δ2H and δ18O, which leads to a shift in the residual raindrop towards a slope less than +8 (Friedman et al., 1962; Gat, 2001).
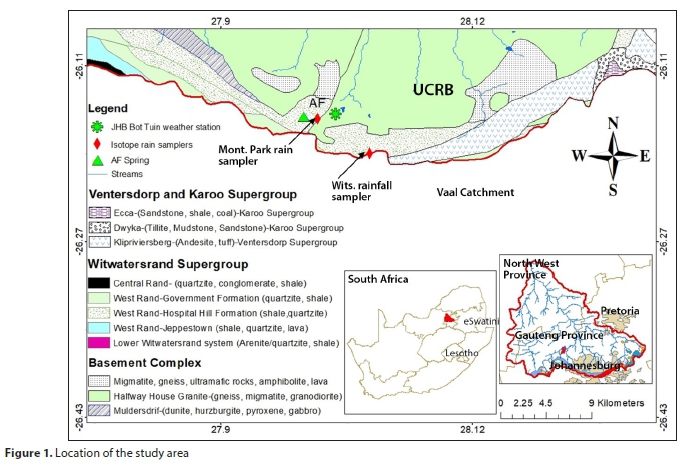
Characterisation of stable isotopes in precipitation has been done in different parts of the world. For example, Europe and North America (Schoch-fischer et al., 1983; Fritz et al., 1987), Asia (Araguás-Araguás et al., 1998; Kong et al., 2019) and Australia (Liu et al., 2010). In South Africa, the Pretoria Local Meteoric Water Line (δ2H = 6.7δ18O + 7.2‰) was constructed using monthly rainfall samples (Fig. 1) (IAEA/WMO, 2018). Diamond and Harris (1997) and Harris et al. (2010) studied the stable isotope effects in precipitation in the west coast of South Africa. Durowoju et al. (2019) specified the isotopic effects in rainfall of Thohoyandou in Limpopo Province and generated the Thohoyandou Local Meteoric Water Line (TLMWL) as δ2H = 7.56δ18O + 10.64‰ (n = 12). Leketa et al. (2018) determined the Johannesburg Local Meteoric Water Line (JLMWL) using 3 years daily rainfall data (δ2H=6.7δ18O + 10‰, n = 260 and R2 = 0.92) (Fig. 1). However, stable isotope effects on daily rainfall in the central part of South Africa, such as Johannesburg, are still poorly studied.
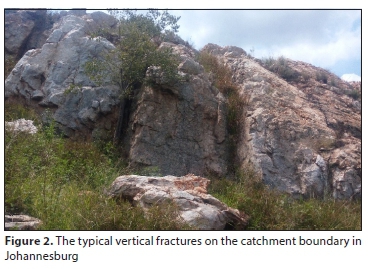
Due to the location of Johannesburg on the boundary of the Upper Crocodile River Basin (UCRB) and the Vaal Catchment (Fig. 1), assessment of stable isotopes in Johannesburg rainfall is particularly important because rainfall is the source of direct runoff and baseflow in the area. Therefore, the isotopic signature of Johannesburg rainfall resembles the input isotopic signal for groundwater and surface water in these two catchments. Abiye (2011) already emphasised the importance of rainfall for vertical recharge through the fractured quartzite (Fig. 2) on the catchment boundary. This was confirmed in Leketa et al. (2019), where the long-term groundwater samples from a spring (Albert Farm spring (AF); Fig. 1) that discharges from the fractured quartzite were studied and found to resemble the isotopic signature of rainfall, inferring the occurrence of recharge from rainfall, possibly through the vertical fractures in quartzite (Fig. 2).
The aim of this study is, therefore, to characterise the stable isotopes in the 2-year (November 2016 to October 2018) daily rainfall collected in Johannesburg and to assess the conditions at the source and along the moisture trajectory. Additionally, the Lagrangian-based air particle trajectory model is applied to infer the backward trajectory of rainfall moisture. The results from this work shall be useful to researchers interested in the use of stable isotopes to assess the provenance of water and recharge mechanisms, particularly for the Johannesburg area. This also improves the understanding of spatial isotopic composition of South African precipitation, adding onto work done on precipitation in other parts of South Africa (Diamond and Harris, 1997; Harris et al., 2010; IAEA/WMO, 2018; Durowoju et al., 2019).
Description of study area
Johannesburg is a commercial hub of South Africa located at about 26.2041°S and 28.0473°E, at the elevation of about 1 750 m amsl (Fig. 1).
The general moisture circulation in Southern Africa mainly consists of the sub-tropical semi-permanent anticyclones that are located in the two adjacent oceans (Indian Ocean and Atlantic Ocean), the Intertropical Convergence Zone (Tyson and Preston-Whyte, 2000), and the high latitudes towards the Antarctica region (White and Peterson, 1996; Renwick, 2002; Blamey and Reason, 2007). Precipitation in Johannesburg occurs mainly in summer (October to April) in the form of convective rainfall, with prevalence of cumulonimbus-induced thundershowers and occasional frontal rainfall (DWAF, 2004; Dyson, 2009). The mean annual rainfall for the period between 1997 and 2016 ranges from 380 mm to 907 mm, as computed from the Johannesburg Botanical Garden weather station (JHB Bot Tuin; Fig. 1), while the mean annual temperature ranges between 15.2°C and 18.9°C for the same period (source of data is South African Weather Service, SAWS).
MATERIALS AND METHODS
Daily rainfall was sampled for stable isotope analysis at Montgomery Park in Johannesburg, South Africa (Fig. 1), between November 2016 and October 2018, using a graduated conventional rain-gauge. The samples were collected and kept in a 10 mL glass bottle immediately after rainfall to avoid evaporation. The rainfall amount was recorded from the rain-gauge. The daily samples consisted of a composite of different rainfall events on days where multiple events took place. In general, 88 rainfall samples were collected and analysed for stable isotopes.
The analysis for δ18O and δ2H was done at the University of the Witwatersrand using the Liquid Water Isotope Analyzer-model 45-EP. The instrument contains the laser analysis system, internal computer, liquid auto-sampler, a small membrane vacuum pump, and a room air intake line that passes air through a drierite column for moisture removal. Sample preparation involved pipetting 1 to 1.5 mL aliquot of a sample into a 2 mL glass vial, which has a polytetrafluoroethylene (PTFE) septum cap. Using a Hamilton microliter syringe, the instrument injected 0.75 µL of sample through a PTFE septum into the auto-sampler. The injection port of the auto-sampler was heated to 46°C to vaporize the sample under vacuum conditions immediately after sample injection. The vapour was then passed down the transfer line into the pre-evacuated mirrored chamber for analysis. Five standards were used in the analysis procedure where the laser machine automatically calibrates itself and measures stable isotope values for each water sample. The laser machine is capable of providing accurate results with a precision of approximately ±1‰ for δ2H and ±0.2‰ for δ18O in liquid water samples with up to 1 000 mg/L of dissolved salt concentration.
The daily maximum and minimum air temperature data for the Johannesburg Botanical Garden station (JHB Bot. Tuin) were obtained from the SAWS. Using the daily stable isotope signature and daily rainfall amount, the amount-weighted monthly stable isotope signatures were determined, from which annual amount-weighted signatures were subsequently calculated. The monthly amount-weighted isotope signature was determined by first calculating the fraction of daily rainfall amount to the total rainfall for that month and multiplying the fraction by the isotope signature (δ2H and δ18O) of rainfall for that day to get the isotopic weight of daily rainfall. Secondly, the daily isotopic weights were summed up for that month to obtain the weighted monthly signature. Similarly, the weighted annual isotopic signatures were determined using the monthly rainfall amount, the annual rainfall amount and the weighted monthly isotopic signature. The estimated annual rainfall signature was compared to the data from Online Isotopes in Precipitation Calculator (OIPC) (Bowen, 2020). The OIPC webpage (http://www.waterisotopes.org) uses an algorithm that was developed by Bowen and Wilkinson (2002) and Bowen and Revenaugh (2003) to calculate the average stable isotope signatures in precipitation at any place using an input of latitude, longitude and elevation.
The traces of temperature and amount effects in rainfall were investigated using the time-series and the regression analysis for the two years. The time-series analysis was done from a plot that has temperature, rainfall amount and stable isotope signature on the Y-axis and time on the X-axis to visualize the temperature and amount effect on each day (Diamond and Harris, 1997). Through regression analysis, the plots of stable isotopes versus temperature and rainfall amount were constructed and the regression lines established. The coefficient of determination (R2) in the temperature plot was compared with that in the rainfall amount plot to assess the predominant effect. In order to rule out the null hypothesis, which suggests the non-existence of a correlation, the probability value (p-value) was calculated for each plot with a targeted significance level of 0.05 (Wang et al., 2008). The slope and d-excess values for rainfall of different amounts were determined to deduce the conditions at the moisture source, along the moisture trajectory and in the sub-cloud.
The Hybrid Single Particle Lagrangian Integrated Trajectory model (HYSPLIT; https://www.ready.noaa.gov/HYSPLIT.php) was used to estimate the origin of moisture that gives rise to rainfall in the Johannesburg region. Using the backward trajectory to identify the origin of air masses is assumed to approximate the moisture trajectory for the rainfall in the study area (Guan et al., 2013). The backward trajectory was calculated for the last 120 h (5 days) prior to the rainfall day for the rainfall samples with the extreme isotopic signatures, i.e., the most depleted and the most enriched in the 2-year period. The air parcels at the heights of 100, 500 and 1 000 m agl were analysed for the stable isotope sampler position at 26.2041°S and 28.0473°E.
RESULTS AND DISCUSSION
Between November 2016 and October 2018, the stable isotope signature of the rainfall ranged from −113.6‰ to +46.3‰ (δ2H) and from −15.51‰ to +4.69‰ (δ18O), while the daily rainfall samples ranged from 0.5 mm to 114 mm. Despite the high variation, the signatures are within the range of −450‰ < δ2H < +100‰ and −50‰ < δ18O < +50‰ provided by Gat (2001) for global precipitation. Compared to Vienna Standard Mean Ocean Water (VSMOW), 61% of the samples are more depleted in δ2H and 82% in δ18O, while 39% of the samples are more enriched in δ2H and 18% in δ18O. The d-excess of the rainfall samples ranges between −9.7‰ and +22.3‰ with 58% of rainfall samples higher than +10‰ and 42% lower than +10‰.
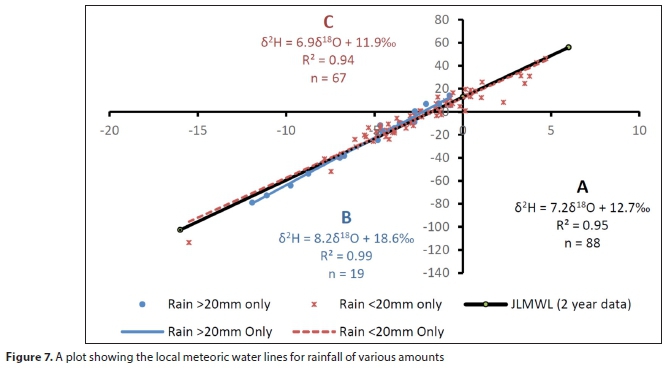
Table 1 shows a summary of the collected data consisting of the monthly weighted isotopic signatures, the total amount of sampled rainfall in each month, monthly average temperatures and the amount-weighted annual isotopic signatures. Additionally, as shown in Table 1, the weighted annual isotopic signatures for the period 2016 to 2017 are −24.9‰ (δ2H) and −5.19‰ (δ18O); as for 2017 to 2018, the signatures are −14.3‰ (δ2H) and −3.95 (δ18O). These annual signatures are comparable with the estimates obtained from the OIPC, which gave annual values of −23‰ (δ2H) and −4.7‰ (δ18O) for Johannesburg precipitation.
Time-series analysis for temperature and amount effect
Figure 3 shows the daily time-series of rainfall amount, rainfall isotope signature and air temperature for the period between November 2016 and October 2018. The vertical arrows indicate the corresponding daily rainfall, air temperature and isotopic signature. The high amount of rainfall observed in arrows b, c, and j correspond well with depletion in δ18O and δ2H. On the other hand, the low rainfall shown by arrows g and h, corresponds well with enrichment in the stable isotopes. Arrow f shows the relationship with temperature in that the day of the lowest air temperature also had rainfall with the most depleted stable isotope signature. Arrows h, k, n and o show a combination of temperature and amount effect.
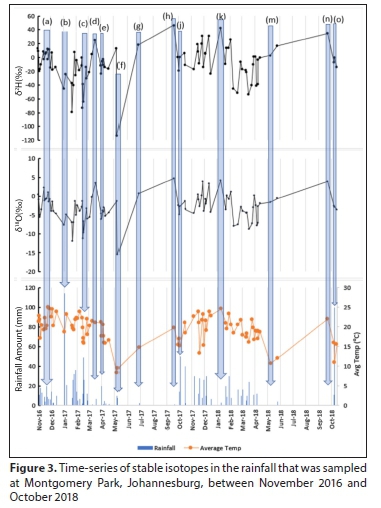
Although it represented the highest temperature record, arrow a does not show the highest enrichment in the year. This could be attributed to contribution from amount effect and heavy isotope rainout in the preceding rainfall events. Arrows d and e clearly show an amount effect in that the temperature is constant but there is a variation in δ18O and δ2H between the two. Low rainfall at arrow d is more enriched compared to e of higher rainfall amount. At m, both temperature and rainfall amount are low, which possibly results in neutralising isotopic signature to average values. This time-series analysis indicates the traces of amount and temperature effects in the individual rainfall events of Johannesburg.
Regression analysis for temperature effect
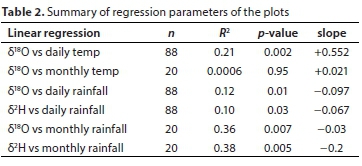
In order to further characterise the temperature effect observed in the time-series analysis, Figs 4a and 4b display the plots of δ18O versus daily air temperature and monthly air temperature, respectively. Compared to the set significance level of 0.05, the p-value for the daily plot is 0.002, which disqualifies the null-hypothesis, while that of the monthly plot is 0.95, agreeing with the null-hypothesis. Table 2 shows regression parameters from Figs 4, 5 and 6.
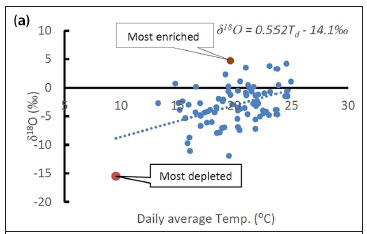
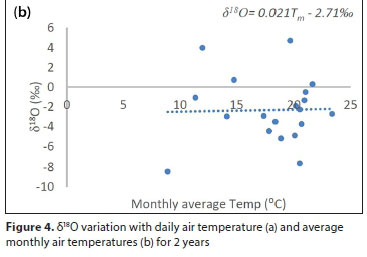
The more enriched samples in Fig. 4a match higher temperatures and the more depleted portion corresponds to cold temperatures. This is also observed for the most depleted rainfall in the period (May 2017; Fig. 3) associated with the lowest temperature, showing agreement with the temperature effect. On the other hand, the monthly plot in Fig. 4b shows scattered points with no clear coherence to the temperature effect. This is also confirmed statistically by the R2, which has a higher value of 0.21 for the daily plot compared to a lower value of 0.0006 in the monthly plot. However, despite the poor correlation in the plots and a high p-value in the monthly plot, the regression equations (temperature-δ18O) have positive slopes. The positive slopes point to an isotopic enrichment with an increase in temperature and isotopic depletion with a decrease in temperature, indicating traces of temperature effect.
The regression lines in Figs 4a and 4b are represented by Eq. 1 and Eq. 2, referred to as the Johannesburg air temperature-δ18O relationships for the daily and monthly periods, respectively, over the 2-year period of study.
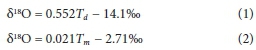
where Td is daily air temperature and Tm is monthly air temperature.
The temperature-δ18O relationship was first observed by Dansgaard (1964) who generated Eq. 3 for mean annual air temperature and δ18O using data from the North Atlantic stations. Gat (2001) also determined the regression line for the monthly air temperature and δ18O (Eq. 4) using data from the European and North Atlantic stations, which compared reasonably well with Eq. 3 by Dansgaard (1964).
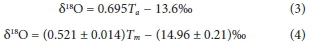
where Ta and Tm are mean annual and mean monthly air temperatures.
Comparing the Johannesburg monthly regression on Eq. 1 with Eq. 4, the slope of the Johannesburg monthly plot (0.021) diverges far below the range presented in Eq. 4, and the δ18O-intecept (−2.71‰) is far above the range provided in Eq. 4. However, the slope and δ18O-intecept obtained in the Johannesburg daily plot (Eq. 1), 0.552 and −14.1‰, respectively, are very close to the monthly ranges proposed by Gat (2001). The higher δ18O-intecept value in the Johannesburg monthly plot could indicate that the rainfall at 0°C air temperature is more enriched in Johannesburg than in the Northern Hemisphere where Gat (2001) undertook the study. This could reasonably be affiliated with the sub-tropical climate in Johannesburg, which is characterised by warmer annual air temperatures compared to the European and North Atlantic stations.
Regression analysis for amount effect
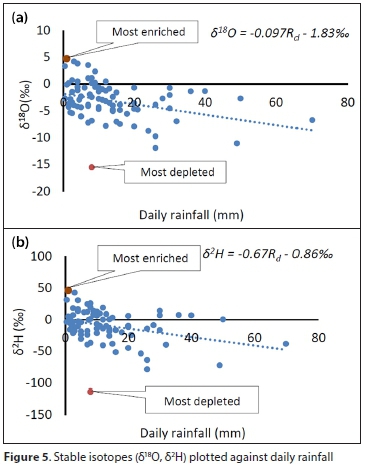
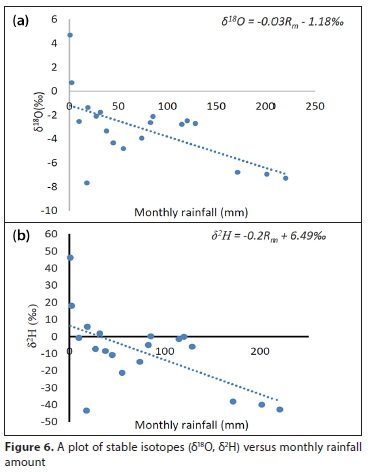
In order to further characterise the amount effect that was observed in the time-series analysis, Figs 5 and 6 show plots of stable isotopes versus rainfall amount for daily and monthly data, respectively, and presents the regression lines for stable isotopes versus rainfall amount, where Rd is daily rainfall and Rm is monthly rainfall. On Fig. 5, a poor correlation is observed with R2 values of 0.12 for δ18O and 0.10 for δ2H (Table 2). The p-values are given as 0.01 for δ18O and 0.03 for δ2H. The monthly data in Fig. 6 show the R2 values of 0.36 for δ18O and 0.38 for δ2H, with p-values of 0.007 for δ18O and 0.005 for δ2H.
The p-values for the daily and monthly plots on Figs 5 and 6, respectively, are below 0.05, indicating that there is a 95% confidence in the relationship between isotopic signature and rainfall amount. In both plots, the highly enriched rainfall is generally of low amount, which indicates the amount effect in both daily and monthly rainfall. On the other hand, there is a high variation in the rainfall amount in the depleted portion of the plots, indicating vague agreement with the amount effect. This can also be observed in the daily plot by the most depleted rainfall sample (May 2017; Fig. 3) in the 2-year period. Being the most depleted, it is expected to have the highest amount of rainfall; instead it falls within the lowest rainfall amount range of the plot. The amount effect that is observed in the enriched part of the plot could be a result of rainfall re-evaporation that occurs post-condensation, a condition that is most effective for light rainfall (Clark and Fritz, 1997).
Despite the diversity and the lack of visual coherence to the amount effect in the depleted portion of the plot and the low R2, the negative slopes of the trend-lines indicate traces of the amount effect. The negative slopes indicate that, generally, the increase in rainfall amount relates to a depletion in heavy isotopes, while the decrease in amount relates to enrichment in heavy isotopes.
The slope and d-excess of Johannesburg rainfall between October 2016 and November 2018
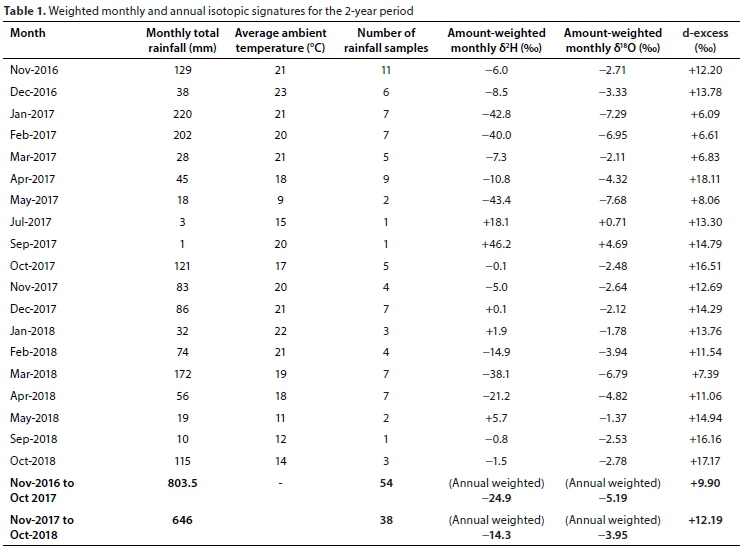
Figure 7 shows the three MWLs established from selected rainfall samples of different amounts over the 2-year period. Regression A represents a MWL with all rainfall samples included (δ2H = 7.2δ18O + 12.7‰), while B and C reflect rainfall events that are ≥20 mm (δ2H = 8.2δ18O + 18.6‰) and <20 mm (δ2H = 6.9δ18O + 11.9‰), respectively. The slope for the MWL of rainfall <20 mm (C) is much lower than +8, showing signs of sub-cloud re-evaporation of light rainfall (fractionation occurring under non-equilibrium conditions). On the contrary, the slope of +8.2 obtained for the MWL with rainfall ≥20 mm (B) is equal to that of Craig (1961), indicating no sign of re-evaporation, deducing that the interaction between the atmosphere and heavy rainfall occurred under equilibrium conditions.
As shown in Fig. 7, the rainfall samples ≥20 mm gave a MWL with the highest d-excess of +18.6‰, the MWL for samples <20 mm gave a d-excess of +11.9‰, while the MWL of all samples gave a value of +12.7‰. The lower d-excess in rainfall of <20 mm as compared to the one of ≥20 mm indicates signs of post-condensation sub-cloud re-evaporation, that preferentially occurs on light rainfall. Considering that the heavy rainfall (≥20 mm) is least susceptible to re-evaporation in the sub-cloud, its slope and d-excess (+8.2 and +18.6‰) have been approximated to those of incoming moisture or in-cloud conditions prior to condensation. Therefore, the high d-excess of +18.6‰ of incoming moisture indicates primary evaporation under warm sea surface temperatures and low relative humidity, conditions that lead to an increase in d-excess (Clark and Fritz, 1997; Pfahl and Wernli, 2008).
Consequently, the d-excess of +12.7‰ from regression A (all rainfall samples), represents an average value, which is a result of the conditions that favour increase in d-excess during primary evaporation, and the conditions that favour a decrease in d-excess during post-condensation re-evaporation. Additionally, the d-excess values of individual rainfall samples in Johannesburg ranges between −9.7‰ and +22.3‰, with an average of +11.1‰. 58% of the rainfall samples have d-excess higher than +10‰, while 42% have d-excess lower than +10‰. The majority of the samples are more depleted than VSMOW. 61% are depleted in δ2H and 82% depleted in δ18O relative to VSMOW. As a result, the observed high d-excess could also be due to the rainout of heavy isotopes from the incoming inland-bound vapour and an addition of vapour that evaporated from continental reservoirs, which lead to depleted raindrops with high d-excess in Johannesburg.
The air particle inverse trajectory modelling for moisture source identification
Figure 8 shows the trajectories over the period of 5 days for the air above Johannesburg at 100, 500 and 1 000 m agl. Figure 8a presents an air trajectory for the most depleted rainfall received on 14 May 2017 and Fig. 8b shows the trajectory for the most enriched rainfall received on 25 September 2017.
The trajectories in Fig. 8 show that both the most enriched and the most depleted rainfall samples in Johannesburg originate in the higher latitudes; however, the difference seems to be the residence time of each in the high cooler latitudes versus the low warmer latitudes. The air parcel for the rainfall on 14 May 2017 at the elevation of 1 000 m agl, seems to have circulated or originated at Antarctica prior to Day 1 (10 May 2017), meaning that it spent a long period in the colder higher latitudes over the Atlantic and Indian Oceans and only reached the coastline on the 5th day, which is also the day on which condensation and precipitation occurred. As for the rainfall of 25 September 2017, Fig. 8b shows that from Day 1, the air parcel at 1 000 m agl was already circulating at lower warmer latitudes along the coastline of South Africa and above the Indian Ocean.
The cold air in the higher latitudes tends to have a high vapour saturation due to its low moisture capacity, while the warm air in the lower latitudes over the coastline with the Indian Ocean tends to have a low vapour saturation due to its high capacity. As the moisture from the high latitudes moves inland, the interaction with the ambient warm air causes enrichment in the moisture that moves further inland. This process is exacerbated by long-term residence, hence the enriched rainfall on 25 September 2017 (Fig. 8b) that was generated from moisture that had a residence time of 5 days in a warm environment. Conversely, the May 2017 rainfall that only reached the coastline on Day 5, having a residence time of less than a day in the warmer environment, is highly depleted. The above analysis indicates the significance of relative humidity of the atmosphere along the air trajectory in determining the isotopic signature of rainfall.
CONCLUSIONS
The Johannesburg rainfall between November 2016 and October 2018 is characterised by a high stable isotope variability with values ranging from −113.6‰ to +49.6‰ for δ2H and from −15.51‰ to +4.69‰ for δ18O. 61% of the samples are more depleted in δ2H and 82% are more depleted in δ18O relative to VSMOW. The time-series and the regression analysis indicate the traces of amount and temperature effects in rainfall. Temperature effect is more significant than amount effect as observed by a higher R2 in the regression of stable isotopes versus air temperature. It was deduced that rainfall sub-cloud re-evaporation preferentially occurs on rainfall <20 mm, as observed by a MWL with a slope of +6.9, which is less than the equilibrium value of +8. The rainfall ≥20 mm yielded a MWL with a slope of +8.2, indicating no signs of sub-cloud re-evaporation post-condensation. The MWL for the rainfall ≥20 mm had a higher d-excess value of +18.6‰ compared to that <20 mm, which had a value of +11.9‰, while the d-excess for a MWL with all rainfall samples was +12.7‰. Additionally, the majority (58%) of rainfall samples have d-excess values higher than 10‰. Since no sign of re-evaporation was observed on heavy rainfall (≥20 mm), it is deduced that its slope and d-excess (slope of +8.2 and d-excess of +18.6‰) resemble the incoming oceanic moisture prior to condensation. Therefore, a high d-excess of +18.6‰ indicates moisture that evaporated under warm sea surface temperatures and low relative humidity. The HYSPLIT air particle back-trajectory model indicated the significance of the moisture trajectory on the isotopic signature of rainfall. While both the most enriched and the most depleted rainfall seem to originate in higher latitudes, their trajectories and residence times in low latitudes seem to greatly differ. The moisture for the most depleted rainfall spent a longer period at higher latitude over the Atlantic and Indian Oceans and only reached the continent on the last day, which is also the day of rainfall. On the contrary, in the last 5 days prior to the day of rainfall, the moisture for the enriched rainfall was already circulating in the lower latitudes along the coastline of the Indian Ocean. It is inferred that during the long-term circulation in the warmer environment, the saturated parcel experienced a loss of light isotopes into the less saturated ambient warm air, thereby enhancing enrichment of moisture that moves further inland. The high stable isotope variability in Johannesburg rainfall is deduced to be a result of temperature and amount effects, which are also affected by combinations of various moisture trajectories and their residence times in the cold versus warm latitudes.
ACKNOWLEDGEMENTS
This study was funded in whole or part by the United States Agency for International Development (USAID) and the National Academies of Sciences, Engineering, and Medicine (NAS) through Partnership for Enhanced Engagement in Research (PEER) under cooperative agreement number AID-OAA-A-11-00012 Sub-Grant Number: 2000006304 and the Department of Science and Technology, South Africa (UID: 101594). This is where the GRECHLIM project entitled 'Understanding recharge in the Limpopo River Basin, South Africa' has been implemented. Any opinions, findings, conclusions, of recommendations expressed in this article are those of the authors alone, and do not necessarily reflect the views of USAID or the NAS, and DST. We would like to thank the South African Weather Service for providing us with climate data. Many thanks to the School of Geosciences, University of the Witwatersrand, for logistic support and the analysis of stable isotopes at the Hydrogeology Laboratory. We are also very grateful to the Science Editor and the anonymous reviewers, whose constructive comments and recommendations helped to improve this work.
ORCID
Khahliso Leketa
https://orcid.org/0000-0003-1999-3981
Tamiru Abiye
https://orcid.org/0000-0002-9327-1955
REFERENCES
ABIYE TA (2011) Provenance of groundwater in the crystalline aquifer of Johannesburg area, South Africa. Int. J. Phys. Sci. 6 98-111. [ Links ]
ABIYE TA, MENGISTU H and DEMLIE MB (2011) Groundwater resource in the crystalline rocks of the Johannesburg Area, South Africa. J. Water Resour. Protect. 03 199-212. https://doi.org/10.4236/jwarp.2011.34026 [ Links ]
ABIYE TA (ed.) (2013) The use of isotope hydrology to characterise and assess water resources in South(ern) Africa. WRC Report No. TT 570/13. Water Research Commission, Pretoria. [ Links ]
ABIYE TA, MENGISTU H, MASINDI K and DEMLIE M (2015) Surface water and groundwater interaction in the Upper Crocodile River Basin, Johannesburg, South Africa: Environmental isotope approach. S. Afr. J. Geol. 118 109-118. https://doi.org/10.2113/gssajg.118.2.109 [ Links ]
ALLISON GB, BARNES CJ, HUGHES MW and LEANEY FWJ (1983) Effect of climate and vegetation on oxygen-18 and deterium profiles in soils. In: Proceedings of a 1983 International Symposium on Isotope Hydrology in Water Resources Development, 12-16 September 1983, Vienna. [ Links ]
ARAGUÁS-ARAGUÁS L, FROEHLICH K and ROZANSKI K (1998) Stable isotope composition of precipitation over southeast Asia. J. Geophys. Res. Atmos. 103 28721-28742. https://doi.org/10.1029/98jd02582 [ Links ]
AYADI Y, MOKADEM N, BESSER H, KHELIFI F, HARABI S, HAMAD A, BOYCE A, LAOUAR R and HAMED Y (2018) Hydrochemistry and stable isotopes (δ18O and δ2H) tools applied to the study of karst aquifers in southern mediterranean basin (Teboursouk area, NW Tunisia). J. Afr. Earth Sci. 137 208-217. https://doi.org/10.1016/j.jafrearsci.2017.10.018 [ Links ]
BLAMEY R and REASON CJC (2007) Relationships between Antarctic sea-ice and South African winter rainfall. Clim. Res. 33 183-193. https://doi.org/10.3354/cr033183 [ Links ]
BOWEN GJ and WILKINSON B (2002) Spatial distribution of δ18O in meteoric precipitation. Geology. 30 315-318. https://doi.org/10.1130/0091-7613(2002)030<0315:sdooim>2.0.co;2 [ Links ]
BOWEN GJ and REVENAUGH J (2003) Interpolating the isotopic composition of modern meteoric precipitation. Water Resour. Res. 39 (10) 1-13. https://doi.org/10.1029/2003wr002086 [ Links ]
BOWEN GJ (2020) The online isotopes in precipitation calculator, version 3.1. http://www.waterisotopes.org (Accessed 2 June 2020). [ Links ]
CLARK ID and FRITZ P (1997) Environmental Isotopes in Hydrogeology. Lewis Publishers, Boca Raton, Fla. 348 pp. [ Links ]
CRAIG H (1961) Isotopic variations in meteoric waters. Science. 133 1702-1703. https://doi.org/10.1126/science.133.3465.1702 [ Links ]
DANSGAARD W (1964) Stable isotopes in precipitation. Tellus. 16 436-468. https://doi.org/10.3402/tellusa.v16i4.8993 [ Links ]
DWAF (Department of Water Affairs and Forestry, South Africa) (2004) Crocodile River (West) and Marico Water Management Area: Internal Strategic Perspective of the Crocodile River (West) catchment. Department of Water Affairs and Forestry, Pretoria, South Africa. [ Links ]
DIAMOND R and HARRIS C (1997) Oxygen and hydrogen isotope composition of Western Cape meteoric water. S. Afr. J. Sci. 93 371-374. [ Links ]
DUROWOJU OS, ODIYO JO and EKOSSE G-IE (2019) Determination of isotopic composition of rainwater to generate local meteoric water line in Thohoyandou, Limpopo Province, South Africa. Water SA. 45 183-189. https://doi.org/10.4314/wsa.v45i2.04 [ Links ]
DYSON LL (2009) Heavy daily-rainfall characteristics over the Gauteng Province. Water SA. 35 (5) 627-638. https://doi.org/10.4314/wsa.v35i5.49188 [ Links ]
EVARISTO J and MCDONNELL JJ (2017) Prevalence and magnitude of groundwater use by vegetation: a global stable isotope meta-analysis. Sci. Rep. 7 44110 EP. https://doi.org/10.1038/srep44110 [ Links ]
FRIEDMAN I, MACHTA L and SOLLER R (1962) Water-vapor exchange between a water droplet and its environment. J. Geophys. Res. 67 2761-2766. https://doi.org/10.1029/jz067i007p02761 [ Links ]
FRITZ P, DRIMMIE RJ, FRAPE SK and O'SHEA K (1987) The Isotope composition of precipitation and groundwater in Canada. In: Proceedings of a symposium-Isotope techniques in water resources development, 30 March-3 April 1987, Vienna. [ Links ]
GAT JR (2001) Environmental Isotopes in the Hydrological Cycle-Principles and Applications. International Atomic Energy Agency, Vienna. 73 pp. [ Links ]
GAT JR (2010) Isotope Hydrology: A Study of the Water Cycle - Series on Environmental Science and Management. Imperial College Press, London. 197 pp. https://doi.org/10.1142/p027 [ Links ]
GUAN H, ZHANG X, SKRZYPEK G, SUN Z and XU X (2013) Deuterium excess variations of rainfall events in a coastal area of South Australia and its relationship with synoptic weather systems and atmospheric moisture sources. J. Geophys. Res. Atmos. 118 1123-1138. https://doi.org/10.1002/jgrd.50137 [ Links ]
HARRIS C, OOM B and DIAMOND R (1998) A preliminary investigation of the oxygen and hydrogen isotope hydrology of the greater Cape Town area and an assessment of the potential for using stable isotopes as tracers. Water SA. 25 (1) 15-24. [ Links ]
HARRIS C, BURGER C, MILLER J and RAWOOT F (2010) O- and H-isotope record of Cape Town rainfall from 1991 to 2008, and its application to recharge studies of Table Mountain groundwater, South Africa. S. Afr. J. Geol. 113 33-56. https://doi.org/10.2113/gssajg.113.1.33 [ Links ]
HEALY RW (2010) Estimating Groundwater Recharge. Cambridge University Press, United Kingdom. 257 pp. [ Links ]
HERCZEG AL, BARNES CJ, MACUMBER PG and OLLEY JM (1992) A stable isotope investigation of groundwater-surface water interactions at Lake Tyrrell, Victoria, Australia. Chem. Geol. 96 19-32. https://doi.org/10.1016/0009-2541(92)90119-p [ Links ]
IAEA/WMO (2018) The Global Network of Isotopes in Precipitation. The GNIP Database. URL: https://nucleus.iaea.org/wiser (Accessed 10 June 2018). [ Links ]
ISOKANGAS E, ROSSI PM, RONKANEN A-K, MARTTILA H, ROZANSKI K and KLØVE B (2017) Quantifying spatial groundwater dependence in peatlands through a distributed isotope mass balance approach. Water Resour. Res. 53 2524-2541. https://doi.org/10.1002/2016wr019661 [ Links ]
KAROLYTĖ R, SERNO S, JOHNSON G and GILFILLAN SMV (2017) The influence of oxygen isotope exchange between CO2 and H2O in natural CO2-rich spring waters: Implications for geothermometry. Appl. Geochem. 84 173-186. https://doi.org/10.1016/j.apgeochem.2017.06.012 [ Links ]
KONG Y, WANG K, LI J and PANG Z (2019) Stable isotopes of precipitation in China: a consideration of moisture sources. Water. 11 1239. https://doi.org/10.3390/w11061239 [ Links ]
LEKETA K, ABIYE T and BUTLER M (2018) Characterisation of groundwater recharge conditions and flow mechanisms in bedrock aquifers of the Johannesburg area, South Africa. Environ. Earth Sci. 77 727. https://doi.org/10.1007/s12665-018-7911-7 [ Links ]
LEKETA K (2019) Holistic approach to groundwater recharge assessment in the Upper Crocodile River Basin, Johannesburg South Africa. PhD thesis, University of the Witwatersrand. [ Links ]
LEKETA K, ABIYE T, ZONDI S and BUTLER M (2019) Assessing groundwater recharge in crystalline and karstic aquifers of the Upper Crocodile River Basin, Johannesburg, South Africa. Groundwater Sustainable Dev. 8 31-40. https://doi.org/10.1016/j.gsd.2018.08.002 [ Links ]
LIU J, FU G, SONG X, CHARLES SP, ZHANG Y, HAN D and WANG S (2010) Stable isotopic compositions in Australian precipitation. J. Geophys. Res. 115 1-16. https://doi.org/10.1029/2010jd014403 [ Links ]
MERLIVAT L and JOUZEL J (1979) Global climatic interpretation of the deuterium-oxygen 18 relationship for precipitation. J. Geophys. Res. Oceans. 84 5029-5033. https://doi.org/10.1029/jc084ic08p05029 [ Links ]
PFAHL S and WERNLI H (2008) Air parcel trajectory analysis of stable isotopes in water vapor in the eastern Mediterranean. J. Geophys. Res. Atmos. 113 1-16. https://doi.org/10.1029/2008jd009839 [ Links ]
RENWICK JA (2002) Southern Hemisphere circulation and relations with sea ice and sea surface temperature. J. Clim. 15 3058-3068. https://doi.org/10.1175/1520-0442(2002)015<3058:shcarw>2.0.co;2 [ Links ]
SAMI K (1992) Recharge mechanisms and geochemical processes in a semi-arid sedimentary basin, Eastern Cape, South Africa. J. Hydrol. 139 27-48. https://doi.org/10.1016/0022-1694(92)90193-y [ Links ]
SCHOCH-FISCHER H, ROZANSKI K, JACOB H, SONNTAG C, JOUZEL I, OSTLUND G and GEYH MA (1984) Hydrometeoro-logical factors controlling the time variation of D, 18O and 3H in atmospheric water vapour and precipitation in the Northern Westwind Belt. In: International Symposium on Isotope Hydrology in Water Resources Development, 12-16 September 1983, Vienna. [ Links ]
SELAOLO ET (1998) Tracer studies and groundwater recharge assessment in the eastern fringe of the Botswana Kalahari: The Letlhakeng-Botlhapatlou area. PhD thesis, Free University (Amsterdam). [ Links ]
SHAKHANE T, FOURIE FD and DU PREEZ PJ (2017) Mapping riparian vegetation and characterising its groundwater dependency at the modder river government water scheme. Groundwater Sustainable Dev. 5 216-228. https://doi.org/10.1016/j.gsd.2017.07.003 [ Links ]
SODERBERG K, GOOD SP, WANG L and CAYLOR K (2012) Stable Isotopes of Water Vapor in the Vadose Zone: A Review of Measurement and Modeling Techniques. Vadose Zone J. 11 (3). https://doi.org/10.2136/vzj2011.0165 [ Links ]
TYSON PD and PRESTON-WHYTE RA (2000) The Weather and Climate of Southern Africa. (2nd edn.) Oxford University Press, Cape Town. 396 pp. [ Links ]
WANG W, CHEN X, SHI P and VAN GELDER PHAJM (2008) Detecting changes in extreme precipitation and extreme streamflow in the Dongjiang River Basin in southern China. Hydrol. Earth Syst. Sci. 12 207-221. https://doi.org/10.5194/hess-12-207-2008. [ Links ]
WHITE WB and PETERSON RG (1996) An Antarctic circumpolar wave in surface pressure, wind, temperature and sea-ice extent. Nature. 380 699-702. https://doi.org/10.1038/380699a0 [ Links ]
 Correspondence:
Khahliso Leketa
Email:kleketa@gmail.com
Received: 26 August 2019
Accepted: 23 June 2020
* Current affiliation: Dept of Geography and Environmental Sciences, Faculty of Science and Technology, National University of Lesotho, PO Roma, Lesotho

