


Services on Demand
Article
 English (pdf)
 Article in xml format
 Article references
Indicators

Related links
-
 Cited by Google
 -
 Similars in Google
Share

 Permalink
Water SA
On-line version ISSN 1816-7950
Print version ISSN 0378-4738
Water SA vol.46 n.3 Pretoria Jul. 2020
http://dx.doi.org/10.17159/wsa/2020.v46.i3.8649
RESEARCH PAPERS
Evaluating the use of iron-coated tubes for wetland delineation in South Africa: A pilot study in the Kruger National Park
CW van Huyssteen; TL Johnson
Department of Soil, Crop and Climate Sciences, Faculty of Natural and Agricultural Sciences, University of the Free State, PO Box 339, Bloemfontein 9300, South Africa
ABSTRACT
The identification of hydric soils is important for wetland delineation and protection. South Africa currently uses the Department of Water Affairs and Forestry (DWAF) wetland delineation guidelines which can be subjective in certain contexts. A robust technical standard that can be legally conclusive is therefore required and should be developed for South African conditions. The National Technical Committee of Hydric Soils (NTCHS, 2007) in the United States of America has accepted the Indicator of Reduction in Soils (IRIS) tube methodology as a technical standard, but this had not yet been tested in South Africa. It is proposed that the NTCHS (2007) be adapted for use in South Africa. These Fe-coated tubes are installed into the soil and if reducing conditions are present, the Fe coating is removed. The aim of this study was to evaluate the use of IRIS tubes as a technical standard for wetland delineation in South Africa. The study took place in three different wetland systems (Malahlapanga, Nshawu and the Tshuthsi spruit) in the Kruger National Park. Piezometers were installed in triplicate in each zone, and the water table, pH and Eh were recorded monthly. Soils were classified, soil wetness indicators identified, and vegetation described. The study took place from September 2012 to August 2013. The areal percentage of paint removed from the top 300 mm of the IRIS tubes was quantified by scanning the tubes and then compared to the DWAF wetland indicators. It was found that the DWAF indicators and the IRIS tube method were mostly in agreement; however, the conditions at the Tshutshi spruit were not favourable for Fe reduction, and hence the use of IRIS tubes, due to the high pH values recorded. The IRIS tubes were therefore a useful tool for wetland delineation in the majority of conditions, but are not recommended in high pH, sodic environments. Further research is recommended over a wider geographical area as well as testing the MIRIS methodology (Manganese Indicators of Reduction in Soils) in wetlands that would inhibit Fe reduction.
Keywords: guidelines, hydric soils, IRIS, reducing conditions, technical standard,wetland indicators
INTRODUCTION
Wetlands are integral in regulating water quantity as well as quality and are hence protected from exploitation under the National Water Act (RSA, 1998). Mining, agriculture, forestry, urban development, and climate change all pose major threats to South African wetlands. The identification, delineation and protection of wetlands is therefore of utmost importance. Wetlands are currently delineated using four wetland indicators: terrain unit, soil form, soil wetness, and vegetation (DWAF, 2005). When determining whether an area is a wetland or not, at least the soil wetness indicator or the vegetation indicator must be present, but the level of confidence increases with the addition of the terrain unit and soil form indicators.
In certain cases, vegetation may not be present or convincing, as it can very easily be destroyed or altered through human activities such as burning and land clearing. In this case a wetland practitioner has to rely on the soil indicators. In most cases, it is quite simple to apply the guidelines, although there may be some exceptions. For example, there have been cases where, despite there being hydrophilic vegetation and a sufficient period of water saturation, evidence of reduction in the soil is absent and the soil morphological features expected are not expressed (such as in recent alluvial deposits and sandy coastal aquifer systems; Pretorius et al., 2016; Mabuza and Van Huyssteen, 2019). Possible reasons for a lack of redoximorphic features can be attributed to low organic carbon levels, high pH, large amounts of Mn-oxides (DWAF, 2005) and high dissolved oxygen levels in the water (Vepraskas, 2001). An anthropogenic factor which contributes to difficulties in delineation, such as ploughing, may also disrupt the soil morphology making it difficult to identify mottling. If the hydrology of an area is altered (through the installation of dams and drains, or the planting of alien species with high water-use demands), it may take several years for the soil morphology to reflect this change. Relic morphological features may further cause confusion by making the soil appear wetter than it really is. Other challenges encountered are soils which are either very red (e.g. dolomite derived) or very grey (e.g. quartzite derived) as seen in the Mpumalanga Province (DWAF, 2005). In red soils, mottles and gleyed morphology may be obscured by the red colour, while in very grey soils there may be insufficient Fe to form mottles. The Department of Water Affairs and Forestry (DWAF, 2005) wetland delineation guidelines can therefore be considered to be qualitative in nature, as opposed to the more quantitative technical standards of the National Technical Committee of Hydric Soils (NTCHS, 2007).
Wetland identification and delineation can therefore pose challenges in unique cases where these guidelines need to be more objective. Currently, wetland practitioners rely heavily on their experience in these cases. However, this means that there is room for individual bias, and experience is required. A more objective method or technical standard, is therefore required - one that can be defended in a court of law. One option may be to quantify the degree and duration of water saturation, Eh and pH. Dyes (α, α dipyridyl), pH/Eh stability diagrams, soil morphology, chemical methods, and Fe nails (Owens et al., 2008) have also all been used to detect reducing conditions; however, each has its individual limitations (USDA-NRCS, 2002).
Reduction is the chemical process that drives the formation of hydromorphic soils that occur in wetlands, under certain conditions. Therefore, wetland identification and delineation hinges on, among other factors, the measurement and characterisation of these reducing conditions. Reducing conditions are, however, the result of four coinciding factors, namely, the presence of microbes, oxidisable organic matter, the availability of electron acceptors and the degree of water saturation (Meek et al., 1968; Bouma 1983). Vepraskas and Faulkner (2001) and Vepraskas (2001) outline the four conditions required for a soil to become anaerobic and support reducing reactions. Firstly, the soil should be inundated or saturated in order to exclude atmospheric oxygen. Secondly, there should be a sufficient source of organic material to be oxidised. Thirdly, a respiring microbial population is required in order to oxidise the organic material. Lastly, the water should be stagnant or moving slowly as moving water contains dissolved oxygen which is difficult to deplete. This retards the onset of reduction and in particular the reduction of Fe. Smith and Van Huyssteen (2011; 2013) have determined, through laboratory trials with soil taken from the Weatherley catchment, in the Eastern Cape, South Africa, that there is an increase in variability of redox potential (pe), pH, Fe2+ and Mn2+ at between 70% and 80% water saturation. Onset of Fe3+ reduction occurred between 72% and 78% water saturation, which confirmed the hypothesis that the onset of reduction can occur from 70% saturation onwards.
However, practical technical standards for application in South Africa have remained elusive. The Indicator of Reduction in Soils (IRIS) method comprises of PVC tubes coated with synthesised Fe-oxide paint, placed into the soil, from which the Fe paint will be removed in reducing conditions (Jenkinson, 2002; Jenkinson and Franzmeier, 2006).
An advantage of the IRIS method is that it is time integrated, because the tubes remain in the soil for approximately 28 days, do not require expertise to install, and can be interpreted quantitatively. This method has, therefore, been accepted in the United States of America as a technical standard by the NTCHS (2007), but had not yet been applied or tested in South Africa. It does, however, provide a promising tool to address atypical cases that may arise and where current guidelines fail. A case in point is the Pan African Parliament wetland assessment and the resulting court ruling that found the wetland practitioner guilty of fraud (North Gauteng Regional Court, 2011).
The Kruger National Park landscape is largely unmodified and in a near-natural state in terms of development, hydrology and vegetation. It also has large variation in terms of lithology, climate, and hydrology, resulting in a number of different wetland types. This presented an opportunity to test the IRIS tube methodology over a wide ecological range and to relate the data to the traditional wetland delineation methods. The purpose of the study was therefore to evaluate the use of IRIS tubes as a technical standard for wetland delineation in the Kruger National Park.
MATERIAL AND METHODS
Three study sites were selected in the Kruger National Park (KNP) based on their differing lithology, available literature and ease of access. These were the Malahlapanga Spring mire complex, the Nshawuvalley-bottom wetland, and the Tshutshi Spruit (in order from north to south in the KNP). These three sites are all situated in the northern region of the KNP (Fig. 1). Measurements were done from 5 September 2012 to 5 August 2013. During this period, an extensive flood occurred in the Shingwedzi region, in January 2013. This resulted in several dams breaching and many access roads becoming impassable, resulting in missing monthly data for January and February of 2013 for the Malahlapanga site.

Study sites
At each study site, the zones were identified to reflect the permanent, seasonal, temporary, and upland zones, using DWAF (2005) guidelines. Three replicates were then laid out in each wetland zone. This setup thus gave twelve measuring sites per wetland.
Malahlapanga
The Malahlapanga system is in the far northern region of the Kruger National Park, near the Park's western boundary, in the Shangoni section. It is situated close to a tributary stream on the southern bank of the Mphongolo river, at 22°53.243'S; 31°02.426'E (Fig. 2), and is one of several thermal springs in the Kruger National Park and is also a peat-forming system. Less than 1% of the wetlands in the Kruger National Park have accumulation of peat to greater than 300 mm. This is because the process of peat formation and accumulation requires a permanent source of water, which is unusual with the erratic rainfall and high evaporation rates characteristic of the region. Water is supplied via a permanent thermal spring in the case of Malahlapanga (Grootjans et al., 2010).
Malahlapanga is used as a water source by game, and is especially heavily utilised in the dry winter months. It is the only permanent water source for quite a distance and is thus frequented by large game, such as elephant, a factor which is thought to be contributing significantly to the system's degradation (Grootjans et al., 2010).
Malahlapanga has a very gentle slope, ranging from 1.3 to 2.7%, and the elevation of the site therefore does not range over more than about 4 m, averaging 369 m amsl. The system (Fig. 2) occupies a low-lying position in the landscape and has an area of about 6 ha (Grootjans et al., 2010). Malahlapanga has 5 peat domes, in various stages of development, from which the thermal waters discharge and then drain down a system of dynamic channels towards the Mphongolo River. The northern-most mire is presumed to be the oldest (it is the largest) and has been severely trampled by elephant. The southern-most feature is a thermal pool which is thought to be the start of a new mire, where vegetation has not yet established and hence is not yet forming peat. It is believed that when the weight of peat exceeds the pressure head of the thermal water, the water will seek a new outlet and begin the formation of a new mire. An alternative theory is that there has been minor geological movement which has caused a shift in the water source (Grootjans et al., 2010).
The area receives between 450 and 500 mm of rainfall per annum (Schulze et al., 2008; Zambatis, 2003). However, Gertenbach (1980 in Grootjans et al., 2010) states the annual precipitation is between 550 and 600 mm per annum. The mean annual temperature for Malahlapanga is 22°C, while the mean annual calculated A-pan evaporation is between 2000 and 2200 mm (Schulze et al., 2008).
Much of the western area of the Kruger National Park consists of granite, gneiss, migmatite, amphibolite, schist, and undifferentiated metamorphic rock (Bristow and Venter, 1986). Malahlapanga lies within this band that runs longitudinally in a north-south direction. The site is underlain by Goudplaats gneiss (Brandl, 1981; Schutte, 1986), which was formed in the Swazianerathem (>3 090 million years BP) and is recognisable by alternating bands of light and dark material (Brandl, 1987). The Goudplaats gneiss consists mainly of tonalite, a plutonic rock with the composition of diorite but with more quartz, with a small portion consisting of granodiorite, a coarse-grained plutonic rock that consists of quartz, oligoclase or andesine, and orthoclase with biotite, hornblende or pyroxene as mafic constituents (Brandl, 1987; Soil Classification Working Group, 1991). Much of the parent material at Malahlapanga, however, appears to be alluvial in nature due to the low-lying cumulative position of the site. There is a zone of faulting 10 km to the north of Malahlapanga, namely the Dzundwini and Nyunani Faults which run in an east-west direction. However, there is an offshoot of the Nyunani Fault that runs from north to south, stopping 2 km short of Malahlapanga (Brandl, 1981). It is this fault that is thought to be the source of the spring complex.
Malahlapanga is in the Tsende Mopaneveld Region which falls under the Mopane Bioregion. This is under the umbrella of the Savanna Biome (Mucina et al., 2005). Locally, there is a sharp boundary between the surrounding veld, dominated by Colophospermum mopane, and the system, which is largely barren with a few patches of heavily grazed grass and small forbs. Protruding from this barren area are the peat domes, which are well vegetated due to the constant water supply. Grootjans et al. (2010) identified numerous species occurring at the bases of the mires, many of which were common hydrophytes such as Phragmites australis and Miscanthus junceus. Vegetation at Malahlapanga had been significantly disturbed by animal trampling, which allowed for the establishment of numerous small opportunistic species. True wetland vegetation indicator species were hence sparse. During this study, the obligate wetland species Phragmites mauritianus was noted in both the permanent and seasonal zones. A sharp boundary between the barren (trampled) area and the Colophospermum mopane served as a boundary between the upland and the temporary wetland zone. Malahlapanga is in the fersiallitic map unit of the Venter (1990) soil map. These soils are described as being coarse fersiallitic sands and loams that are mainly red in colour. The region is also associated with lithosols, described as being fine fersiallitic sands, arenaceous sediments and loams which are also red in colour.
Nshawu
The Nshawu valley-bottom wetland (23°31.326'S; 31°29.165'E; Fig. 3) is one of the largest wetland systems in the Kruger National Park, occupying an area of 570 ha (Grundling, 2010). The wetland was characterised and assessed by Grundling in 2010 because there were concerns relating to a breached dam wall that was influencing the hydrology of the system as well as an old tourist road that was built across the wetland. Nshawu was an attractive site for this study due to its basic igneous rock geology, in contrast to the other two sites which are underlain by acidic parent materials. Nshawu also forms part of a Kruger National Park research supersite where a number of other research efforts are concentrated (Smit et al., 2013).

Nshawu is in the northern region of the Kruger National Park approximately 23 km from the Mopani rest camp and in the Mooiplaas section. The wetland runs in a longitudinal direction (roughly NNE to SSW) and drains into the Tsendze River. A section on the western bank was selected due to the clear permanent, seasonal, temporary and upland zones, as identified through the vegetation indicators. There is also a tourist road that runs along the western edge of the system which aided access. The slope is approximately 1% and the elevation 321 m amsl. Notable features of the site include the breached dam wall to the north and areas of channelisation within the wetland.
Nshawu has a mean annual temperature of 22°C (Schulze et al., 2008) and has a higher mean annual rainfall than Malahlapanga, ranging between 500 and 550 mm with an average of 525 mm (Schulze et al., 2008; Zambatis 2003). The mean annual calculated A-pan evaporation is 2000-2200 mm (Schulze et al., 2008).
Nshawu is underlain by olivine rich basalt, subordinate alkali-basalt and shoshonite which are all part of the Karoo System (Bristow and Venter, 1986). The wetland is located in a broad band of this olivine rich basalt, though it is flanked by olivine poor basalt, granophyres and rhyolite which form the Lebombo mountain range to the east. Grundling (2012) believes that there are alluvial fans that are originating in the Lebombo mountains and are influencing the channelisation of the Nshawu wetland.
There were two clear vegetation indicator species that were present in the permanent, seasonal and temporary zones, namely, Sporobolus pyramidalis and Cyperus sexangularis, which are both facultative positive wetland species. Each zone also had wetland species which were unique to the specific zone. In the permanent zone, Leptochloa fusca was exclusively found, while in the seasonal zone Juncus effuses was solely found, and in the temporary zone cf. Sporobolus ioclados and Cyperusobtusi florus were unique. The dryland zone consisted only of dryland species with the exception of Abultilon rehmannii, an opportunistic species. According to Mucina et al. (2005), the wetland lies within the Mopane basalt shrubland vegetation unit in the Mopane Bioregion under the Savanna Biome and in the Mopane Shrubveld Ecozone (Mucina and Rutherford, 2007). Venter (1990) characterised the soils of this region as being high in smectitic clays, describing them as calcareous, with a mainly brown or black pedocutanic structure.
Tshutshi spruit
The Tshutshi spruit study site (23°57.186'S; 31°10.089'E) was selected due to its proximity to the Phalaborwa Gate (Fig. 4). The Tshutshi spruit is of concern for the Kruger National Park management because it brings with it an abundance of litter and effluent (also sewage) from the upstream town of Phalaborwa and is also a continuous source of alien plant seeds. The Tshutshi spruit is a tributary of the Olifants River and rises outside the Kruger National Park's eastern boundary. It lies in the Phalaborwa section in the north region of the park, with an access road running past it. The average slope is roughly 1% and the average elevation is approximately 403 m amsl. The barren area was identified as a sodic site.
The mean annual temperature for the Tshutshi spruit area is 21°C, the mean annual rainfall is between 500 and 550 mm, with an average of 525 mm, while the mean annual calculated A-pan evaporation is 2000-2200 mm (Schulze et al., 2008; Zambatis, 2003).
The site is underlain by Archean granite of the Swaziland system, consisting of granite, gneiss, migmatite, amphibolite, schist, and undifferentiated metamorphic rocks (Bristow and Venter, 1986).
The site is within the Mopane Bushwillow Woodlands Ecozone (Mucina and Rutherford, 2007) and the vegetation unit is Phalaborwa and Timbavati Mopane Veld, also in the Mopane Bioregion of the Savanna Biome (Mucina et al., 2005). Typha capensis designates the permanently saturated zone while Cyperus sexangularis indicates the seasonally saturated zone. Venter (1990) describes the soils as fersiallitic with coarse fersiallitic sands and loams which are mainly yellow and grey in colour, with associated Lithosols.
All three of the selected wetlands, therefore, have fairly similar climate and vegetation, although they each have unique hydrological and lithological conditions.
IRIS tubes
The Fe-paint was synthesised using Rabenhorst's 'Quick (7-day) IRIS Tube Paint Recipe and Construction Procedure' (NTCHS, 2007). An X-ray diffraction (XRD), performed on the paint, indicated that the main Fe-oxide constituent was goethite. The paint was refrigerated at approximately 5°C to delay mineralogical alteration.
The IRIS tubes were constructed by first cleaning 20 mm diameter PVC conduit piping with acetone to remove dirt, glue, and ink; the piping was then sanded to provide a suitable surface for the paint to adhere to. The prepared tubes were placed on a lathe-like device constructed using a battery-powered hand-drill. A paintbrush was then used to apply two coats of goethite paint to the tube, allowing the paint to dry between coats. After the tubes were air-dried, they were placed in an oven overnight at 70°C to increase the paint's resistance to abrasion (Rabenhorst, 2006; 2008). Most of the tubes were cut to 0.5 m in length, but some were cut shorter, for use where it was impossible to auger to 0.5 m in some of the upland rocky soils and some of the temporary sites. The tubes did not protrude from the soil as in the traditional method, due to the risk of animals damaging them, to avoid them being unsightly, to be more cost effective, and to hide them from inquisitive people. However, this made locating the tubes extremely difficult, especially in areas with thick vegetation cover and during the growing season. It is recommended to use small brightly coloured flags in such instances.
The IRIS tubes were installed using a 20 mm hand-driven wood drill auger. Once the hole was augured the IRIS tubes were pushed down until they were flush with the soil surface, sometimes having to be gently tapped with a hammer, while care was taken not to damage the tube. In the particularly rocky and calcareous soils it was impossible to auger a hole with such a small diameter and a 20 mm diameter metal stake was then hammered into the soil and removed with a vice grip. Five IRIS tubes were installed in a pentagon-shape around the central water monitoring well, all within 1 m2, and in accordance with the protocol outlined by the NTCHS (2007). The IRIS tubes were replaced approximately every 28 days. The same holes were used each time. Care was exercised when removing the tubes to prevent soil from falling back into the holes, through moistening the soil by pouring a small amount of water around the tube before removing it. The tubes were extracted using a pair of narrow long-nose pliers. Care was taken to not damage the tubes or scratch the paint. The tubes at each site were labelled in a clockwise direction (starting from the same point each time) a, b, c, d, e. Once removed, the pipes were placed in plastic bags and taken to the laboratory to be washed, dried and scanned.
The cleaned IRIS tubes were lain out in their batches and a visual assessment was performed. Scratching was visually observed on some tubes as vertical striations, as opposed to the more rounded patches of reduction paint removal. Only tubes which had reduction paint removed were scanned. Using a permanent marker each tube was marked longitudinally with a small dot at 100 mm intervals. The tubes were then scanned on a custom modified flatbed scanner, at 70dpi, on the greyscale setting, with 2 scans per tube to cover the top 300 mm (Rabenhorst, 2008; 2012). The bottom 200 mm was not scanned as this depth is not used in the NTCHSs or Rabenhorst's criteria (NTCHS, 2007; 2015). The images were then cropped to one revolution of the tube using the 100 mm interval dots as guides. The images were then converted into black and white images using Adobe Photoshop CC 2014. Due to differing light conditions and the varying colours of the tubes, a threshold value had to be set for each individual tube, which was as close to the actual tube as possible. The areal percentage paint removal from the top 300 mm was then calculated. The IRIS tubes from Malahlapanga's permanent zone had to be treated differently as the organic matter from the peat stained the white PVC of the tubes black. The scans, therefore, did not differentiate the reduced and un-reduced areas. In these cases, paint removal was estimated using visual inspection. IRIS tubes with >30% paint removal were considered to be indicative of wetland conditions (NTCHS, 2007).
Water levels and measurements
Monitoring wells were constructed according to the procedure described by Sprecher (2008) and the WRP Technical Note (1993), by drilling holes, approximately 50 mm apart, along the length of a 1.5 m, 50 mm diameter PVC waste pipe. The wells were installed using a Thompson bucket auger. Wells were sunk 50-100 mm below the soil surface and were covered with grass and dung to limit animal (especially elephant) vandalism. The well holes were back-filled with river sand, with a layer of bentonite near the surface to prevent water flow along the sides of the pipe. The tops of the well pipes were sealed with waste pipe end caps. Wells were installed to a shallower depth where restricting layers impeded auguring.
The water table depth was measured from the soil surface, every 28 days, using a tape measure. A small torch was used in poor light conditions to see whether there was water present or not. When the wells were dry it was noted that the water table was not reached. Hydroperiod was calculated by multiplying the number of positive observations of water within 30 cm by the number of days between measurements.
A water sample was taken from the well using a bailer, after the water level measurement had been recorded, and poured into a small clean glass beaker. The pH was then measured in the field with a portable pH/Eh meter (HANNA HI8314 instrument and a HI3230 pH electrode). The pH meter was calibrated with 4.00 and 7.00 buffers at the beginning of each fieldwork trip.
Eh was measured in the same water sample, but with a Pt electrode (HI3230) and a HANNA HI8314 instrument. The sample was then discarded. The Eh electrode was also calibrated at the beginning of each field trip against a 230 mV standard solution. The rH (potential redox) was calculated using:

All rH values <20 were considered to indicate reducing conditions (Clark 1923; Vepraskas and Faulkner, 2001).
Vegetation
The vegetation was assessed during the summer growing season. At each of the monitoring points, 25 random sampling points were selected within a 5 m radius from the monitoring well. At each of the 25 random sampling points, the nearest species were identified. Species which were not easily identifiable in the field were given a temporary name and detailed photographs were taken. All species were classified as either being present (occurring) or dominant (>50% occurrence) in terms of their abundance at the monitoring point. The species were also classified as being one of the following: dryland, opportunistic/dryland, obligate wetland, facultative wetland, and facultative negative or facultative positive plants. An obligate wetland plant is a plant that occurs for >99% of the time in a wetland or water-saturated area. A facultative wetland plant is a plant that occurs 50% of the time in wetland or water-saturated areas, a facultative positive wetland plant occurs 67-99% of the time in a wetland or water-saturated area, and a facultative negative plant occurs <25% of the time in a wetland or water-saturated area (Van Ginkel et al., 2011).
Wetland identification
The terrain unit was based on MacVicar et al. (1977), and if units of valley bottom (5) or lower foot slope (4L) were noted the indicator was assumed to be met. Soil forms were identified (Soil Classification Working Group, 1991) to determine whether the soil form was classified as a wetland soil according to the DWAF (2005) guidelines. The soil morphology was described in the top 0.3 m (one would usually look at the top 0.5 m but because the bottom 0.2 m of the IRIS tubes are disregarded the table only shows the top 0.3 m for comparative purposes). The wetland vegetation species were listed and if the plants were classified as obligate, facultative positive or facultative negative it was assumed that the vegetation indicator was met. The duration (months) of water saturation were calculated but assumptions were made due to the water table only being recorded monthly and thus the figures listed can only be used as estimated duration of water saturation.
RESULTS AND DISCUSSION
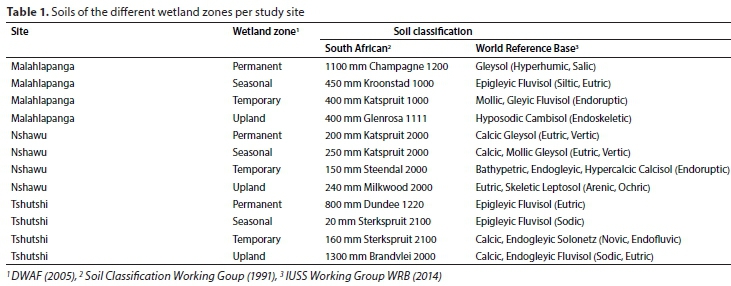
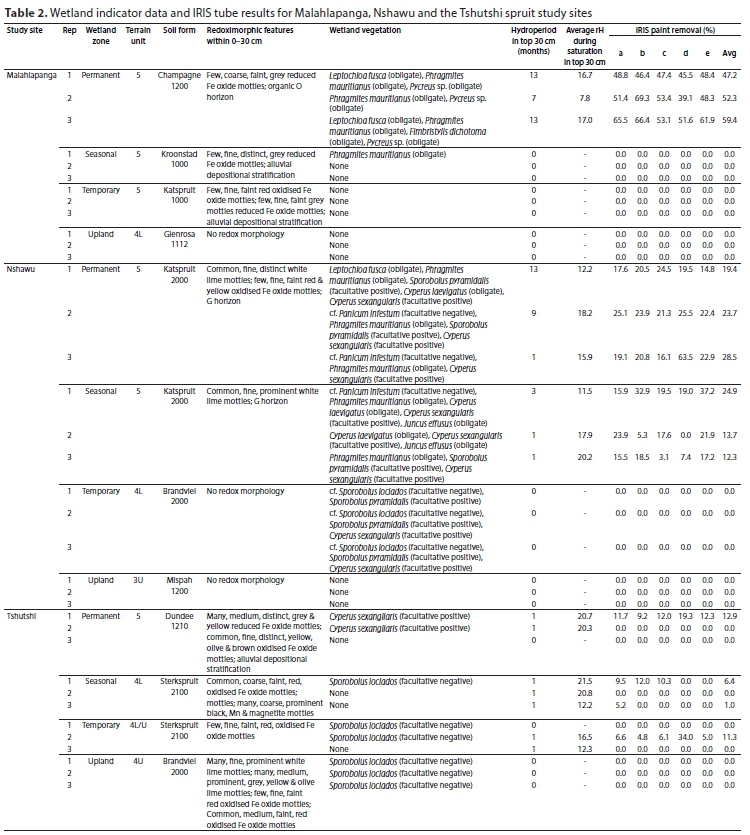
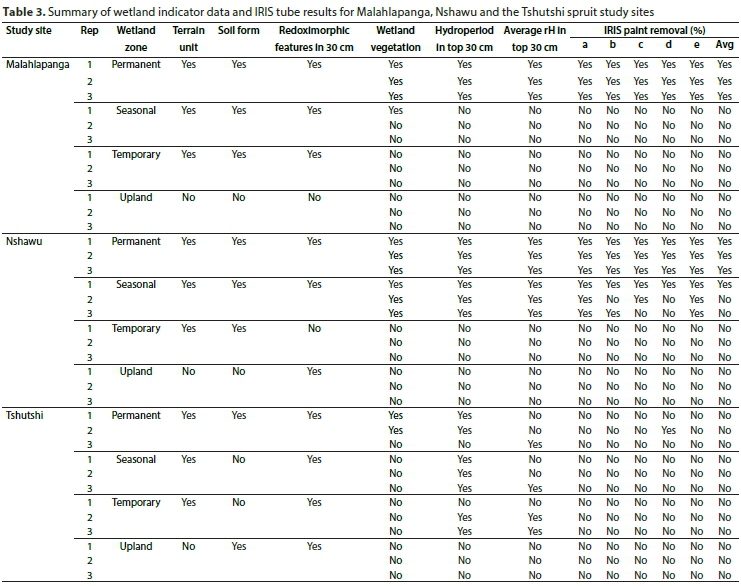
Brief descriptions of the soils for each wetland zone at each site are given in Table 1. Detailed profile descriptions and analyses are given by Johnson (2014). Tables 2 and 3 compare the DWAF (2005) wetland indicators with the IRIS tube data collected - Table 2 gives the raw data while Table 3 summarises whether each particular indicator was met or not.
Malahlapanga
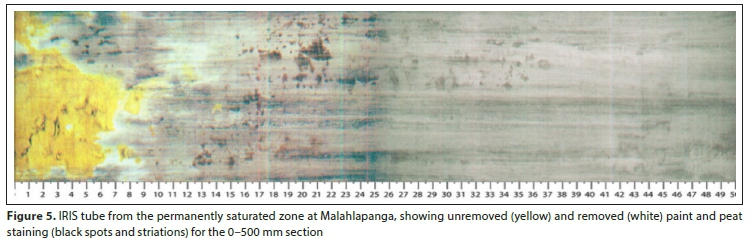
There was a strong agreement (100%) between the DWAF (2005) indicators and the IRIS data in the permanently saturated zone for Malahlapanga (Table 2). The terrain unit, soil form indicator, soil wetness indicator, vegetation indicator, as well as the hydrology and rH of the water confirm that the zone is indeed permanently saturated. Figure 5 shows an example of a typical IRIS tube that was installed within this zone. It can be clearly seen that the Fe paint was stripped entirely from the tube. However, grey staining from the organic matter can also be noted. This had implications when analysing the tubes using the flatbed scanner in greyscale. While it is very obvious where there was paint removal when examining the tube by eye, it was a challenge for the scanner to distinguish between the grey tone of the orange paint and the grey staining on the tube from the organic material. These tubes were treated differently from the rest of the IRIS tubes during the analysis phase, as a higher degree of accuracy was achieved via visual estimation of paint removal.
There was no paint removal from the tubes in the seasonal and temporary zones (Table 2), because the water did not rise within the top 0.5 m of the soil profile during the study period. The terrain unit, soil form indicator and soil wetness indicators did, however, indicate that wetland conditions had occurred within these zones. The soil indicators could have been relict, or the year of the study may not have been wet enough. However, even with the occurrence of the January 2013 floods, no reduction was recorded within these zones. The vegetation was misleading due to the severe trampling from animals, which prevented the establishment of certain plant species.
In the upland zone there was a lack of wetland indicators as well as no paint removal recorded from the IRIS tubes, implying that there was also a strong agreement between the methods at the dry end of this transect.
Nshawu
There was a fair agreement between the IRIS data and the DWAF (2005) indicators in the permanent and seasonal zones with less paint removal occurring in the seasonal zone (Table 2). While the terrain unit, soil form, soil wetness and vegetation indicators were met for the zones, along with the presence of the water table and reducing rH, there was a decrease in paint removal in the seasonal zone. In the seasonal zone, only one of the three repetitions would classify as a wetland, while the other two repetitions would not have met the criteria of both Castenson and Rabenhorst (2006) and the NTCHS (2007; 2015).
In the temporary zone, no paint removal was recorded via reduction, only via scratching from the carbonate nodules. The coarse size fraction, consisting of carbonate nodules and stones, was as high as 70%. Because of the high percentage of coarse fragments in this zone, abrasion and scratching was responsible for removing the IRIS tube paint. In the temporary zone only the terrain unit, soil form and vegetation wetland indicators were met. This means that in this zone the soil wetness indicator and IRIS tubes were in agreement as the water table did not reach the 0.5 m depth for a long enough period during the study for reduction to occur. This observation might also be due to the high pH in these soils (Johnson, 2014), due to the occurrence of lime that might suppress reduction.
In the upland zone there was a lack of wetland indicators as well as no paint removal recorded from the IRIS tubes, implying that there was also a strong agreement between the methods at the dry end of the transect.
Interestingly, reduction from the IRIS tubes was also recorded in months where 100% water saturation was not documented. While the purpose of this study was not to relate the degree of water saturation to the onset of reduction, this is an interesting result, which corroborates the finding of Smith and Van Huyssteen (2011; 2013). These authors found that the onset of reduction typically occurs at 70% water saturation but can be influenced by factors such as temperature, bulk density and organic carbon content. Further explanation for this is that the soils, being derived from a basic parent material, are higher in clays, which have a greater bulk density and higher capillary fringe than sandy soils.
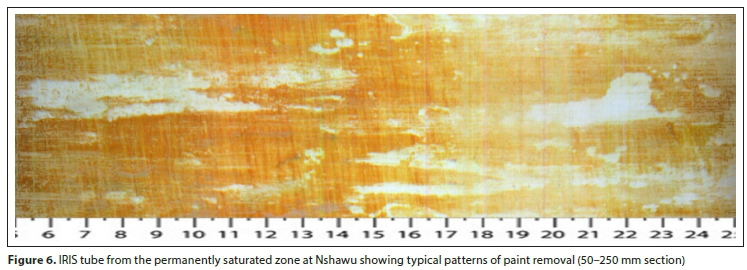
The patterns caused by paint removal from the tubes at Nshawu were also interesting (Fig. 6). Paint removal often followed root channels where the microbes utilised the organic material during respiration, as opposed to vertical striations caused by scratching (Fig. 7).
Carbonate nodules, observed in the temporary zone (Johnson, 2014), are not currently defined as a wetness indicator (DWAF, 2005), since the focus is primarily on Fe, Mn, and organic carbon. However, in this study the carbonates did indicate a change in hydrology and wetland conditions, and are therefore recommended for further investigation.
Tshutshi spruit
No reduction was recorded in any of the zones at the Tshutshi spruit, despite the presence of wetland indicators and the inundation that occurred during the January 2013 flood. The terrain unit, soil wetness indicator and hydrological criteria were met for all of the zones, while the vegetation and soil form indicators were also met in the permanent zone. This suggests that perhaps the chemistry of the system was not favourable for the reduction of Fe. This wetland is associated with a sodic site and the measured pH water was extremely high (the maximum value recorded was 11.36 in the seasonally saturated zone). The implication of this is that the area would have to be inundated with water for longer periods of time before Fe would be reduced. Because the system is not reducing in terms of Fe, more sensitive measurements, such as Manganese Indicators of Reduction In Soils (MIRIS; Stiles et al., 2010), should be explored.
The soils of Tshutshi spruit are very sandy, which led to paint being easily scratched off the IRIS tubes during installation and extraction. Paint removal through abrasion was therefore problematic and the paint mineralogy could possibly have been refined by determining the optimum goethite content for the paint to resist abrasion, but still be easily reduced. A more sensitive XRD analysis is required, because the one that was undertaken only detected goethite and no other Fe oxide minerals.
CONCLUSIONS
IRIS tubes offer a temporally integrated measurement methodology, measuring the prevailing redox conditions over a 3- to 4-week period, as opposed to point hydroperiod measurements. There was generally a strong agreement between the DWAF (2005) indicators and the IRIS data. However, at the Tshutshi spruit, the high pH inhibited the reduction of Fe and so the wetland indicators were not in agreement with the IRIS results. The use of MIRIS tubes should be explored in order to find an element that is reducing in the system. It would seem that acceptable results would be obtained from the IRIS tubes in the rainy season, but that systems such as Malahlapanga, which have permanent groundwater saturation, and are not governed by seasonal rainfall within the catchment, warrant the installation of IRIS tubes throughout the year. Thus, an understanding of the nature of the hydrology of the system is important for knowing when to install the tubes - i.e., installing IRIS tubes in the summer months in the winter rainfall region would be superfluous. One must also take the climate and hydrology of the system into account (NTCHS, 2007; Rabenhorst, 2008). Another example would be pans, which only flood every 50-100 years, and would be impossible to delineate during the dry years unless they are solely groundwater fed. There are both advantages and disadvantages of the method. The IRIS tubes did not perform well in sodic, high pH environments. Scratching and staining of the tubes were problematic for the analysis phase and could be overcome by refining the paint mineralogy as well as visually estimating paint removal or using mylar grids in cases where tubes are badly stained by organic matter. It is not feasible in terms of time and expense to use the method for every wetland delineation, but in problematic cases such as described in the literature review, IRIS tubes offer a useful tool for wetland practitioners to definitively determine whether reducing conditions are actively occurring within a wetland during the period of study. Further studies to test the IRIS tube methodology in different geographical areas within South Africa, and determination of technical standards to delineate sodic and ephemeral wetlands, are therefore warranted. Based on the results presented here, it also seems warranted and feasible that quantitative wetland delineation guidelines should be developed for South Africa. Care should, however, be taken during excessively dry or wet years, to not under- or overestimate wetland occurrence.
ACKNOWLEDGEMENTS
SAEON, Inkaba ye Afrika (Publication No 248), and the University of the Free State are acknowledged for partially funding this project.
REFERENCES
BOUMA J (1983) Hydrology and soil genesis of soils with aquic moisture regimes. In: Wilding LP, Smeck NE and Hall GF (eds) Pedogenesis and Soil Taxonomy. I. Concepts and Interactions. Elsevier Science Publishers, Amsterdam. https://doi.org/10.1016/S0166-2481(08)70604-4 [ Links ]
BRANDL G (1981) Geological Map 2230 Messina. 1:250 000 Geological Map Series. Council for Geoscience, Pretoria. [ Links ]
BRANDL G (1987) Explanation: Sheet 2330 Tzaneen. 1:250 000 Geological Map Series. Council for Geoscience, Pretoria. [ Links ]
BRISTOW JW and VENTER FJ (1986) Notes on the Permian to Recent geology of the Kruger National Park. Koedoe 29 85-104. https://doi.org/10.4102/koedoe.v29i1.522 [ Links ]
CASTENSON KL and RABENHORST MC (2006) Indicator of reduction in soils (IRIS): Evaluation of a new approach for assessing reduced conditions in soil. Soil Sci. Soc. Am. J. 70 1222-1226. https://doi.org/10.2136/sssaj2005.0130 [ Links ]
CLARK WM (1923) Studies on oxidation-reduction. I. Introduction: Public Health Rep. 38 443-455. [ Links ]
DWAF (Department of Water Affairs and Forestry, South Africa) (2005) A practical field procedure for the identification and delineation of wetlands and riparian areas. Department of Water Affairs and Forestry, Pretoria. [ Links ]
GROOTJANS AP, GRUNDLING P-L, GRUNDLING A, LINSTRŐM A, ENGELBRECHT J and PRICE JS (2010) Spring mires fed by hot artesian water in Kruger National Park, South Africa. Mires Peat 6 1-10. [ Links ]
GRUNDLING P-L (2010) Nshawuwetland (B83C-005) assessment. In: Agenbag G (ed.) Rehabilitation plan for Kruger National Park, B90E, B90H, B83C, Limpopo. SANBI Report No. 5267/105782 South African National Biodiversity Institute, Pretoria. [ Links ]
GRUNDLING P-L (2012) Personal communication, 26 June 2012. Dr Piet-Louis Grundling, affiliated researcher, University of the Free State. [ Links ]
IUSS WORKING GROUP WRB (2014) World Reference Base for Soil Resources 2014. International soil classification system for naming soils and creating legends for soil maps. World Soil Resources Reports No. 106. Food and Agriculture Organization, Rome. [ Links ]
JENKINSON BJ and FRANZMEIER DP (2006) Development and evaluation of Fe coated tubes that indicate reduction in soils. Soil Sci. Soc. Am. J. 70 183-191. https://doi.org/10.2136/sssaj2004.0323 [ Links ]
JENKINSON BJ (2002) Hydrology of sandy soils in northwest Indiana and iron oxide indicators to identify hydric soils. PhD thesis, Purdue University. [ Links ]
JOHNSON TL (2014) Evaluation of iron-coated tubes to detect reduction in soils for wetland identification in the Kruger National Park. MSc thesis, University of the Free State. [ Links ]
MABUZA BB and VAN HUYSSTEEN CW (2019) Effect of degree and duration of water saturation on iron, manganese, and exchangeable cations in wetland soils of Maputaland, KwaZulu-Natal, South Africa. S. Afr. J. Plant Soil 36 279-287. https://doi.org/10.1080/02571862.2018.1562112 [ Links ]
MACVICAR CN, DE VILLIERS JM, LOXTON RF, VERSTER E, LAMBRECHTS JJN, MERRYWEATHER FR, LE ROUX J, VAN ROOYEN TH and VON M. HARMSE HJ (1977) Soil Classification: A Binomial System for South Africa. Department of Agriculture, Pretoria. [ Links ]
MEEK BD, MCKENZIE AJ and GROSS LB (1968) Effects of organic matter, flooding time and temperature on the dissolution of iron and manganese from soil in situ. Soil Sci. Soc. Am. 32 634-638. https://doi.org/10.2136/sssaj1968.03615995003200050018x [ Links ]
MUCINA L, RUTHERFORD MC and POWRIE LW (2005) Vegetation Map of South Africa, Lesotho and Swaziland, 1:1 000 000 scale sheet maps. South Africa National Biodiversity Institute, Pretoria. [ Links ]
MUCINA L and RUTHERFORD MC (2007) The Vegetation Map of South Africa, Lesotho and Swaziland. South African National Biodiversity Institute, Pretoria. [ Links ]
NORTH GAUTENG REGIONAL COURT (2011) State vs Stefan Frylink and Mpofu Environmental Solutions CC, Regional Division of North Gauteng. Judgment on 6 April 2011. https://cer.org.za/wp-content/uploads/2011/04/S-v-Stefan-Frylinck-2011.pdf (Accessed 20 September 2019). [ Links ]
NTCHS (National Technical Committee of Hydric Soils) (2007) The hydric soil technical standard. Deliberations of the national technical committee for hydric soils. https://www.nrcs.usda.gov/internet/fse_documents/nrcs142p2_052089.pdf (Accessed 20 September 2019). [ Links ]
NTCHS (National Technical Committee of Hydric Soils) (2015) Hydric Soils Technical Notes11: Hydric soils technical standard and data submission requirements for field indicators of hydric soils. URL: https://www.nrcs.usda.gov/internet/fse_documents/nrcs142p2_051608.pdf (Accessed 20 September 2019). [ Links ]
OWENS PR, WILDING LP, MILLER WM and GRIFFIN RW (2008) Using iron metal rods to infer oxygen status in seasonally saturated soils. Catena 73 197-203. https://doi.org/10.1016/j.catena.2007.07.009 [ Links ]
PRETORIUS ML, BROWN LR, BREDENKAMP GJ AND VAN HUYSSTEEN CW (2016) The ecology and classification of wetland vegetation in the Maputaland Coastal Plain, South Africa. Phytocoenologia 46 125-139. https://doi.org/10.1127/phyto/2016/0057 [ Links ]
RABENHORST MC (2008) Protocol for using and interpreting IRIS tubes. Soil Surv. Horiz. 49 74-77. https://doi.org/10.2136/sh2008.3.0074 [ Links ]
RABENHORST MC (2012) Simple and reliable approach for quantifying IRIS tube data. Soil Sci. Soc. Am. J. 76 307-308. https://doi.org/10.2136/sssaj2011.0267n [ Links ]
RSA (Republic of South Africa) (1998) National Water Act (Act No. 36 of 1998). Government Gazette 19182. Government Printer, Cape Town. [ Links ]
SCHULZE RE, MAHARAJ M, WARBURTON ML, GERS CJ, HORAN MJC, KUNZ RP and CLARK DJ (2008) South African Atlas of Climatology and Agrohydrology. WRC Report No. 1489/1/08. Water Research Commission, Pretoria. [ Links ]
SCHUTTE IC (1986) The general geology of the Kruger National Park. Koedoe 29 13-36. https://doi.org/10.4102/koedoe.v29i1.517 [ Links ]
SMIT IPJ, RIDDELL ES, CULLUM C and PETERSEN R (2013) Kruger National Park research supersites: Establishing long-term research sites for cross-disciplinary, multiscaled learning. Koedoe 55(1) 7 pages. http://dx.doi.org/10.4102/koedoe.v55i1.1107 [ Links ]
SMITH K and VAN HUYSSTEEN CW (2011) The effect of degree and duration of water saturation on selected redox indicator: pe, Fe2+ and Mn2+. S. Afr. J. Plant Soil 28 119-126. https://doi.org/10.1080/02571862.2011.10640022 [ Links ]
SMITH K and VAN HUYSSTEEN CW(2013) Relating the onset of reduction to degree of soil water saturation. S. Afr. J. Plant Soil 30 157-161. https://doi.org/10.1080/02571862.2013.843029 [ Links ]
SOIL CLASSIFICATION WORKING GROUP (1991) Soil Classification - A Taxonomic System for South Africa. Memoirs on the Agricultural Natural Resources of South Africa No. 15. Department of Agricultural Development, Pretoria. [ Links ]
SPRECHER SW (2008) Installing monitoring wells in soils (Version 1.0). USDA -National Resources Conservation Service, Lincoln. [ Links ]
STILES CA, DUNKINSON ET, PING C and KIDD J (2010) Initial field installation of manganese indicators of reduction in soils, Brooks Range, Alaska. Soil Surv. Horiz. 51 102-107. https://doi.org/10.2136/sh2010.4.0102 [ Links ]
USDA-NRCS (United States Department of Agriculture - Natural Resources Conservation Service) (2006) Field Indicators of hydric soils in the United States. A guide for identifying and delineating hydric soils, Version 6.0, USDA, NRCS, Lincoln. [ Links ]
VAN GINKEL CE, GLEN RP, GORDON-GRAY KD, CILLIERS CJ, MUASYA M and VAN DEVENTER PP (2011) Easy identification of some South African wetland plants (grasses, restios, sedges, rushes, bulrushes, eriocaulons and yellow-eyed grasses). WRC Report No. TT 479/10. Water Research Commission, Pretoria. [ Links ]
VENTER FJ (1990) A classification of land for management planning in the Kruger National Park. PhD thesis, University of South Africa. [ Links ]
VEPRASKAS MJ and FAULKNER SP (2001) Redox chemistry of hydric soils. In: Richardson JL and Vepraskas MJ (eds) Wetland Soils: Genesis, Hydrology, Landscapes and Classification. Lewis Publishers, Boca Raton. https://doi.org/10.1201/9781420026238.ch4 [ Links ]
VEPRASKAS MJ (2001) Morphological features of seasonally reduced soils. In: Richardson JL and Vepraskas MJ (eds) Wetland Soils: Genesis, Hydrology, Landscapes and Classification. Lewis Publishers, Boca Raton. https://doi.org/10.1201/9781420026238.ch7 [ Links ]
WRP (Wetlands Research Programme) (1993) Installing monitoring wells/piezometers in wetlands. WRP Technical Note HY-IA-3.1. https://apps.dtic.mil/dtic/tr/fulltext/u2/a434496.pdf (Accessed 20 September 2019). [ Links ]
ZAMBATIS N (2003) Determinants of grass production and composition in the Kruger National Park. MSc Agric thesis, University of KwaZulu-Natal. [ Links ]
 Correspondence:
CW van Huyssteen
Email: vanhuyssteencw@ufs.ac.za
Received: 24 September 2019
Accepted: 19 May 2020

