


Servicios Personalizados
Articulo
 Inglés (pdf)
 Articulo en XML
 Referencias del artículo
Indicadores

Links relacionados
-
 Citado por Google
 -
 Similares en Google
Compartir

 Permalink
Water SA
versión On-line ISSN 1816-7950
versión impresa ISSN 0378-4738
Water SA vol.46 no.3 Pretoria jul. 2020
http://dx.doi.org/10.17159/wsa/2020.v46.i3.8648
RESEARCH PAPERS
A regional flow type classification for South African perennial rivers
NA Rivers-MooreI, II; RE SchulzeI; NS DavisI
ICentre for Water Resources Research, University of KwaZulu-Natal, Private Bag X01, Scottsville 3209, South Africa
IIFreshwater Research Centre, Cape Town, South Africa
ABSTRACT
Flow classification provides a statistically robust method of defining an expected range of variability for flow metrics describing frequency, magnitude, duration and timing of events. Here, we characterised reference mean daily flows for 1950-1999 for all 5838 quinary catchments of South Africa based on 150 metrics. Using a two-tiered approach, where sub-catchments were classified into similar flow types using principal components and cluster analyses, we defined 6 to 12 flow types for each of 8 hydrological regions reflecting rainfall seasonality. Redundancy between variables was 87% on average, so that site variability could be accounted for using 8-28 metrics. In general, flow volume metrics accounted for Axis 1 variability, while coefficients of dispersion had 1.8 times less leverage in Axis 2. With the incorporation into a spatial product and an associated database, this study provides a basis for defining statistically robust reference flow conditions for multiple flow metrics, against which current observed flows at specific sites may be compared.
Keywords: environmental flows, flow metrics, flow variation, regional flow assessments, spatial heterogeneity
INTRODUCTION
Flow classification is 'a statistical process of stratifying natural variation in measured characteristics among a population of streams and rivers to delineate river types that are similar in terms of hydrologic...features' (Poff et al., 2010 p. 153). The degree of deviation is best represented by measuring statistical departure from reference condition sensu Stoddard et al. (2006). Since flow regimes vary geographically in response to climate and catchment characteristics (geology, stream order, topography, land cover) (Poff and Zimmerman, 2010), flow classifications are appropriate at a regional scale, and are useful because they integrate landscape features into a single measurable index (Gordon et al., 1994). Unlike agglomerative approaches that make use of techniques such as duration curves, reductionist classification approaches make use of indices (= metrics) that focus on state and threshold values using descriptive statistics, and attempt to understand the links between timing, duration and magnitudes of different system states. Numerous metrics of flow types can be readily calculated (for example; coefficient of intra-annual variation; number of zero-flow days per year; and Colwell's (1974) indices of predictability and constancy), which provide an indication of predictability and perenniality, while average monthly flows provide a measure of seasonality (Haines et al., 1988; Poff and Ward, 1989). Olden and Poff (2003) assessed and grouped 171 hydrologic indices into 5 categories representing biologically relevant streamflow attributes, based on the work of Richter et al. (1996) who developed the 'Indicators of Hydrological Alteration', an approach which analyses flow time-series for ecologically relevant flow measures, based on 32 parameters which are divided into 5 groups relating to magnitude, timing, duration and frequency of ecologically significant events. Examples of the use of flow metrics to classify flow types include streamflow indices to classify Victorian (Australia) streams, where 16 variables were used to classify streams into 5 groups (Hughes and James, 1989); 78 streams in the United States were classified into 9 types based on 15 variables (based on, inter alia, floods, predictability, zero flows and seasonality) (Poff and Ward, 1989); and the use of 120 metrics and a classification undertaken for Australian rivers (Kennard et al., 2010).
Increasingly over the past few decades, the detrimental impacts of changes to flow regimes have been recognised. Causes of this are multifarious and include, inter alia, flow reductions due to surface water abstractions or changes in baseflow due to abstractions of groundwater, changes in runoff due to inappropriate catchment land use (increases or decreases), fundamental changes to downstream river hydrographs as a result of upstream impoundments (Palmer and O'Keeffe, 1989), and impacts to donor systems (reductions) and receiving system (increases) due to inter-basin transfer schemes (Snaddon and Davies, 1998).
Changes to flows are typically reflected in biological responses (Jackson et al., 2007). Flow patterns fundamentally impact the types and distributions of aquatic species within river systems (De Moor, 2002; Bunn and Arthington, 2010; Poff and Zimmerman, 2010), with streamflow perceived as a 'master variable' shaping many fundamental ecological characteristics of riverine ecosystems (Poff and Zimmerman, 2010). This occurs both through direct impacts on species based on their hydraulic preferences and tolerances, as well as indirectly because of the impacts of flows on geomorphology that create the abiotic habitat templates for species (Statzner and Higler, 1986; Poff et al., 2010). For example, in South Africa, this has been studied over the past 30 years in relation to blackfly problems on the Great Fish River (O'Keeffe and De Moor, 1988; Rivers-Moore et al., 2007, 2008), and may even translate into considerable economic losses, as evidenced by similar issues, albeit on a greater scale, along the middle and lower reaches of the Orange River (Rivers-Moore et al., 2014). Not only is too little flow deleterious to river health, but too much flow is also problematic, and the Great Fish River in South Africa's Eastern Cape Province is cited as a classical example of a permanently altered system as a consequence of this (O'Keeffe and De Moor, 1988). Poff and Zimmerman (2010) highlight that 92% of a total of 165 papers which they reviewed reported negative impacts on ecological metrics based on flow alteration. An explicit spatial product resulting from regional flow type classifications could enable researchers developing generalisations about hydrology-ecology interactions on the basis that responses to natural flow regime characteristics are likely to vary between flow types (Kennard et al., 2010).
Flow classification serves two important purposes in the environ-mental flows determination process: firstly, relationships between ecological metrics and flow alteration can be developed for an entire river type based on data from a limited set of rivers within each region; and secondly, it facilitates more efficient biological monitoring and research design (Poff et al., 2010). In South Africa, broad-scale aquatic biodiversity patterns are already well recognised: Harrison's (1959, cited in De Moor, 2006) 12 hydro-biological regions; distinct upland versus lowland aquatic macro-invertebrate assemblages as shown by Dallas (2004); and aquatic zones (such as Level I Ecoregions; Kleynhans et al., 2005).Streamflow classifications are a logical extension of such regional perspectives, and are useful because they integrate landscape features into a single measurable index (Gordon et al., 1994). Underpinning any regional environmental flow assessment is a hydrological classification based explicitly on flow data (Kennard et al., 2010; Olden et al., 2012).
The need to classify rivers in South Africa first arose in the 1960s, and re-emerged as an issue in the mid-1980s (Eekhout, 1997). Joubert and Hurly (1994) classified South African rivers into three broad flow categories based on seasonality, variability and perenniality. Ten flow classes incorporating this logic were subsequently included into a multi-criteria analysis framework for defining environmental flows (Brown and Joubert, 2003) within an environmental flow holistic framework that has been extensively used in multiple countries (Tharme, 2003). Hughes and Hannart (2003) classified flows into classes according to a hydrological index (HI) developed for South African rivers and applied at a quaternary catchment scale. The HI is based on the ratio of monthly coefficients of variation for flows to a baseflow index, to provide a unitless value that reflects seasonality and perenniality of rivers at a quaternary catchment scale. Monthly coefficients of variability typically reflect rainfall patterns, and give some indication of seasonality, while the baseflow coefficient is the proportion of total flow that occurs as baseflow, and provides a measure of short-term variability by reflecting how peak flows are concentrated or spread throughout the year. This approach has been used as a desktop approach for regional environmental flow assessment. In spite of such a body of applied research and progress in defining environmental flows, gaps nevertheless exist in terms of a national database of accessible reference flow metrics that also have ecological applications. In this study, our aim was to develop a regional flow type classification using regionally specific metrics, as a spatial tool to assist in defining reference flows.
METHODS
Our flow type classification process followed equivalent steps to those described by Poff et al. (2010): viz. obtain flow data; describe the flow time-series in terms of metrics; undertake regional redundancy analyses; classify flow types per quinary sub-catchment, and assign to a spatial framework. For South African flow conditions, Taylor et al. (2003) recommends using time-series of either observed or estimated daily natural flows with at least 20 years of reasonably complete time-series of mean daily flow rates for reliable conclusions to be drawn. For the flow data, we used simulated data based on Acock's veld types for baseline current conditions (1950-1999) from 5838 quinary catchments. These data were selected as the basis for defining 'reference' flow types, and form part of a database developed in previous studies (Schulze, 2010; Maherry et al., 2013), based on widely verified simulated flows using the process-based agro-hydrological daily time step ACRU model developed for South African hydrological conditions (Schulze, 1995; Smithers and Schulze, 2004). The first 2 years of model output were deleted in order to obtain realistic baseflow and soil water stores, as per the recommendations of Taylor (2006), so that time-series data spanned the period 1 October 1952-31 December 1999.
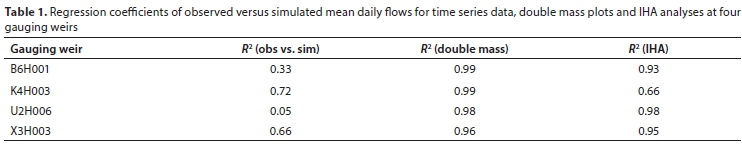
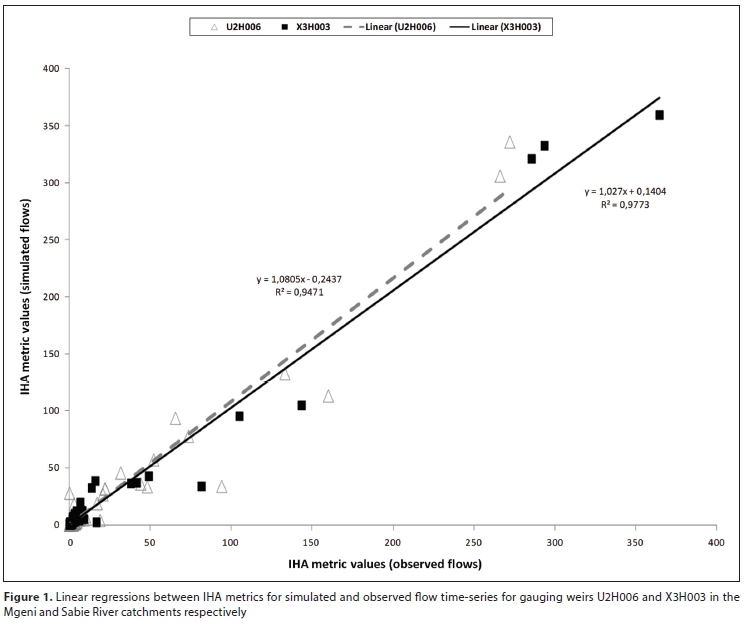
Next, flow time-series were described in terms of metrics. Each flow data file was analysed using non-parametric statistics, using the IHA approach (Indicators of Hydrologic Alteration; Richter et al., 1996; Mathews and Richter, 2007), and following a classification undertaken for Australian rivers using 120 metrics (Kennard et al., 2010) that is relevant because of the known similarities in hydrological regimes between Australia and South Africa (Chiew et al., 1995). To test the validity of using the simulated flows to define reference flow types, we compared simulated flows and their associated metrics with reliable concurrent flow data. We selected 4 gauging weirs previously confirmed as having reliable, long-term data, i.e. > 35 years of data tested for stationarity, consistency, homogeneity and absence of trend and characterised as 'reasonably natural' streamflow by Taylor (2006). The verification process involved visual assessments of concurrent observed and simulated mean daily flow data using time-series plots; correlations using linear regression analyses of observed versus simulated mean daily flows; double mass plots of cumulative observed versus simulated mean daily flows; and correlations between IHA metrics for observed versus daily flows, using simple linear regression.
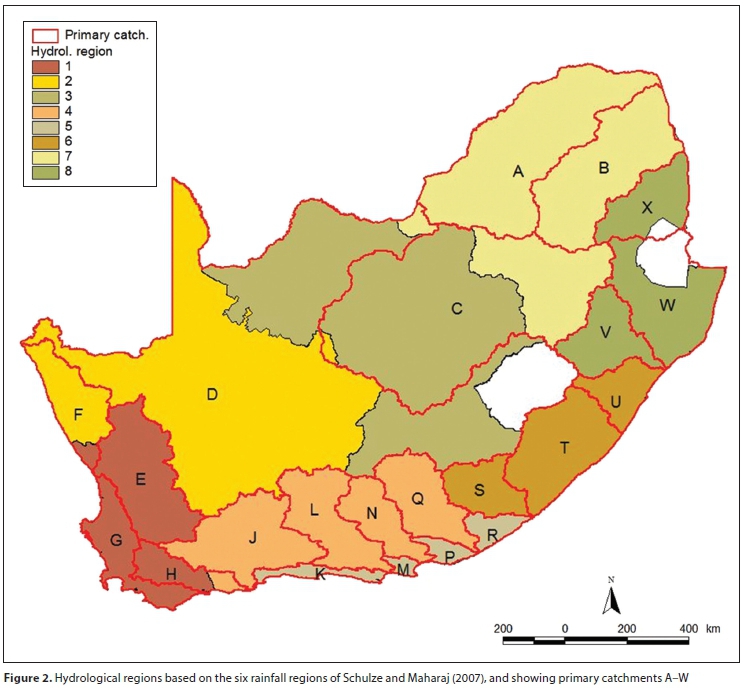
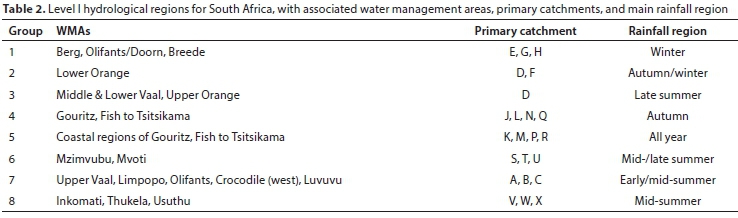
To account for regional differences in flow metric redundancies that were highlighted by Taylor (2006), and which would be due to spatio-temporal variation in orographic rainfall patterns, we adopted a two-tiered approach to regional flow type classification. For the first level, we defined hydrological regions using the rainfall regions of Schulze and Maharaj (2007) to account for ecological similarity at a biogeographical scale, and water management areas (WMAs) for South Africa for ease of applicability.
For the next step, flow metrics were iteratively screened for multi-collinearity for each region to reduce data redundancy (Olden and Poff, 2003). The maximal variable set per region was refined using a combination of principal component (PC) analysis (PCA) (McCune and Mefford, 2011) and spreadsheet correlations to eliminate variables with either no or poor correlations with PC Axes 1 and 2, or where variables with an R2 correlation of <50% (Pearson test) for PC Axes 1 and 2 were eliminated. A further PCA iteration was run, with variables used in this step compared in a spreadsheet using a correlation matrix. Variables that showed a high degree of collinearity were identified, and the variable with the highest eigenvalue from the PCA was selected for inclusion in the optimal variable matrix. Variables with high correlations but lower eigenvalues were deleted, as these did not add to the explanatory power of the PCA. The final PCA was run using the optimal matrix of variables. The cumulative variance accounted for in the first three PC axes was noted for successive iterations, with the expectation that the cumulative variation accounted for in the PCA based on the maximal dataset would be less than successive iterations. However, too much pruning of variables was also to be avoided, and this was indicated by a decline in the explained variance.
Site groups and river types for each region were defined using the optimal dataset resulting from the redundancy analysis. Principal component (correlation matrix method) and cluster (Euclidean distance measure; group averaging technique) analyses (McCune and Mefford, 2011) were used to define flow type groups per hydrological region. The quinary vector coverage was attributed by flow type classes, with an associated database file for annual, median and coefficient of dispersion metrics linking to each quinary catchment.
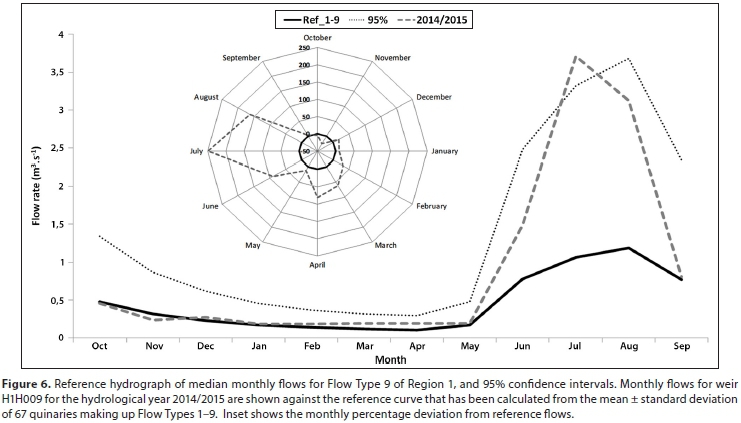
By way of examples in the use of the spatial database of metrics and flow types, we applied the metrics for different flow types in three different ways. Firstly, expected reference seasonal variation was calculated for the Thukela catchment, with monthly median flows shown using box-and-whisker plots. Secondly, the range of predictability in flows across all flow types within Region 1 (Western Cape winter rainfall) was calculated using box-and-whisker plots. Finally, we used mean monthly flow data from a gauging weir (H1H009) downstream of the Stettynskloof Dam on the Holsloot River, a tributary of the Breede River in the Western Cape. Mean monthly flows for the hydrological year 2014/15 were plotted against a reference curve for the corresponding flow type that included a 95% confidence envelope.
RESULTS
Validity of using simulated flows to define reference flow types
A total of 150 metrics were derived for each quinary catchment: 7 metrics for annual flows; 69 metrics for median values describing the full time-series including monthly statistics, and 74 associated metrics for coefficients of dispersion. Whereas comparisons of observed and simulated flow data showed agreement in terms of pulses when compared as visual plots, correlations between observed and simulated mean daily flows ranged from poor to fairly strong (R2 of 0.05-0.72; Table 1). It is most likely that these differences are primarily a consequence of changes in timing and magnitude of flow events in response to degrees of departure from 'natural' land cover, which did not always show an ideal homogenous relationship. Such inconsistencies became less apparent in the comparison of IHA metrics based on more than 40 years of observed versus simulated flows, with all R2 values being in excess of 0.66 (Fig. 1; Table 1).
Definition of hydrological regions and classification of flow types
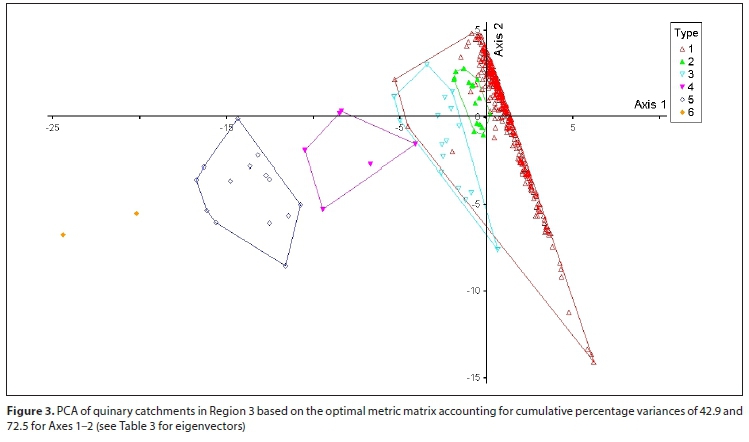
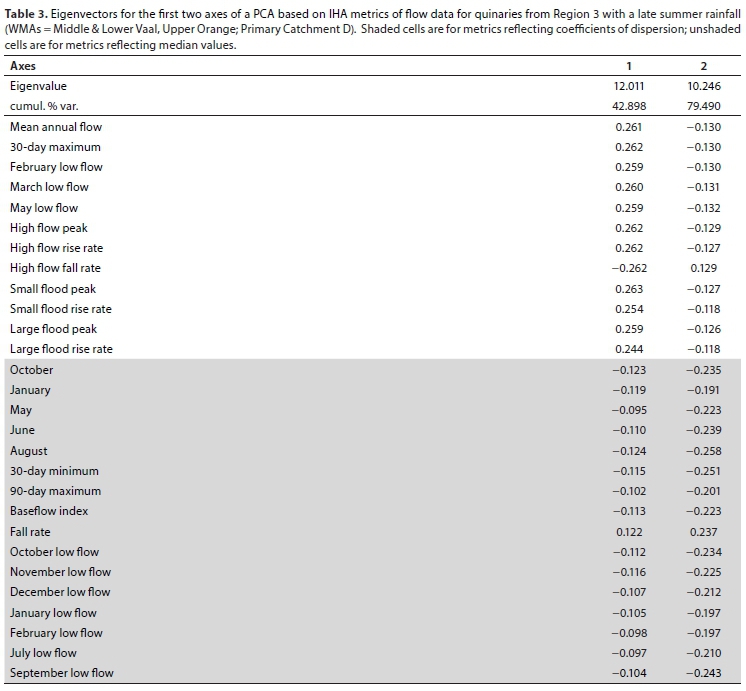
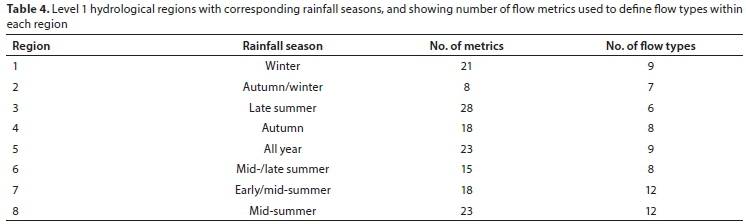
Eight hydrological regions were defined (Fig. 2), based on agglomerations of primary catchments, WMAs and rainfall regions (Table 2). A region typically defines a spatial area of homogeneity based on a set of characteristics, and defined for a particular purpose. This provided the platform for undertaking regional redundancy analyses of flow metrics. Scree plots showed that the first two principal component axes accounted for the majority of the site variation. Many of the remaining IHA metrics showed a high degree of correlation which, after elimination based on correlations between variables and eigenvalues, provided the basis for the final PCAs based on 8-28 variables, and an average redundancy in metrics of 87%. Flow type groups were derived using PCAs in tandem with cluster classifications. In the example selected and shown here, 6 distinct flow types were defined for Flow Region 3 (late summer rainfall; middle and lower Vaal and Upper Orange River catchments). Flow types were distinguished on the basis of 28 metrics, with PC Axis 1 separating types based on flow volumes, while PC Axis 2 separated flows in terms of flow variability (Fig. 3; Table 3). Thus, flow types showed increases in median flow volume metrics from right to left, while variability increased from top to bottom.
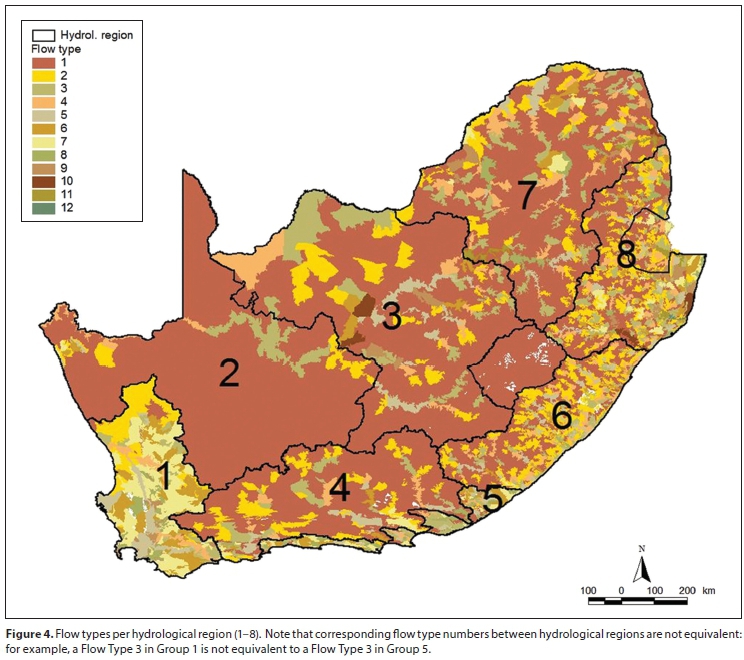
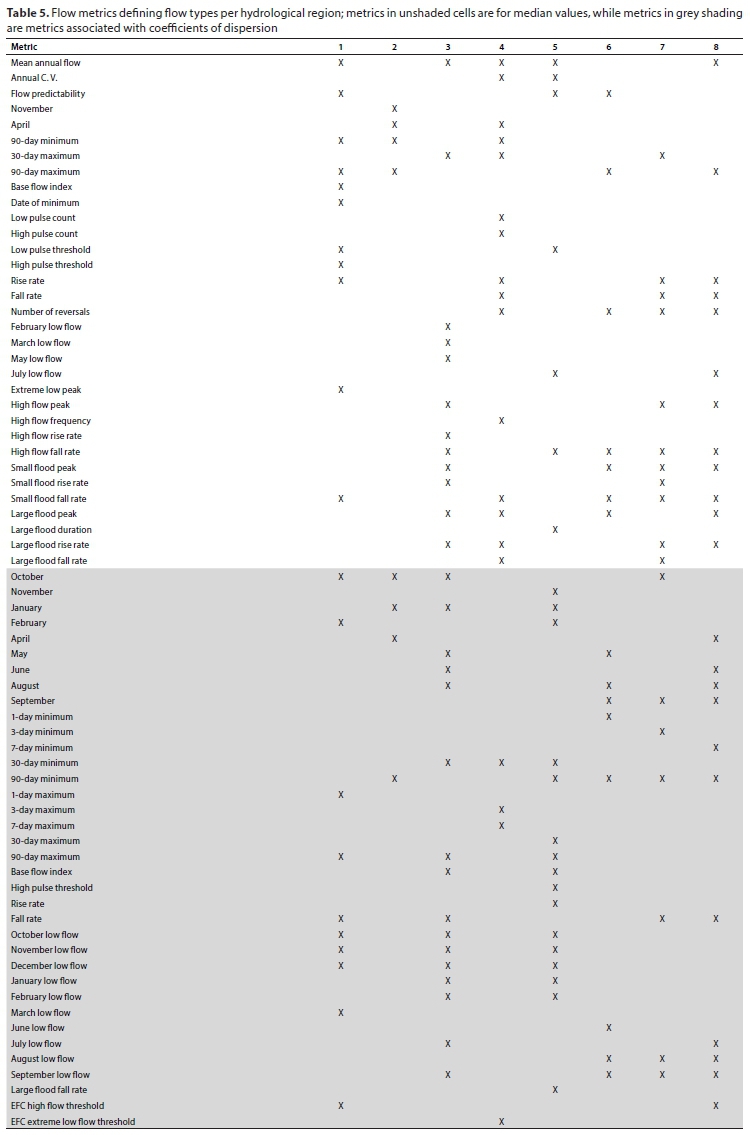
Based on the cluster classifications, 6 to 12 flow types were defined for each of the 8 hydrological regions, with flow pattern variation explained by an optimal combination of 8-28 metrics (Fig. 4; Table 4), and yielding a total of 71 flow types nationally. While the spatial database includes all metrics for each quinary sub-catchment, the optimal metric combination for each hydrological region was different (Table 5). Cumulative percentage variation between sites was 65-89% for PC Axes 1 and 2, and an average cumulative variation of 81.25%. Axis 1 accounted for 42-71% of this variation, while Axis 2 accounted for 16-39% of the variation in flow patterns between sites. On average, metrics describing flow volumes were 1.8 times more important than metrics describing variability, although both in combination were necessary for defining flow types. In general, quinary catchments further downstream were more efficiently described by flow volume metrics, while tributary catchments and upstream catchments were more efficiently described by coefficient of dispersion metrics.
Flow types exhibited considerably more spatial heterogeneity in the higher rainfall regions of South Africa (Groups 1, 6, 8) versus those in the lower rainfall regions (Group 2). Regional differences in metrics explaining flow patterns were clearly apparent, where different combinations of metrics emerged. Each flow type represents a statistically different cluster of sub-catchments based on a combination of flow volume and dispersion metrics along a gradient of high to low values for PC Axes 1 and 2.
Examples of application
By way of illustration of how this spatial database may be used, the range of values for particular metrics plotted using box-and-whisker graphs reflects the range of variation within a selected flow type (monthly median flows across a reference hydrological year); and between flow type within a region (range of flow predictabilities; Fig. 5). For a site-specific application, we selected the appropriate quinary sub-catchment to identify the corresponding region and flow type: n = 67 for Flow Type 9 from Region 1. Flows downstream of Stettynskloof Dam for the hydrological year 2014/2015 were shown to be within reference conditions, despite being elevated above median values, for all months of the year except July (Fig. 6).
DISCUSSION
With a classification process, the key problems with using such a large number of variables relate to statistical (multi-collinearity) and logistical (time and resources in processing) challenges. Both problems are addressed by reducing the number of variables using a range of redundancy analysis techniques that included correlation matrices and PCA. However, these data can be summarized more elegantly to between 2 and 4 indices (i.e. first index for each PC axis), but also such an approach provides a framework for flow regime classification (Olden and Poff, 2003).Furthermore, results indicated that the IHA method adequately represented the majority of variation explained by 171 variables assimilated from global flow assessment literature, and provides a balance between objective selection of high-level information indices and ease of computation.
In terms of number of flow type classes, the number of our groups per hydrological region conforms to recommendations from international best practice. Our flow regions are defined at a 1:500 000 scale, and are groupings of primary catchments where broad hydrological regimes are likely to be similar based on rainfall seasonality. Cognisance is also taken of administrative practicalities, by also considering water management areas (WMAs). While the number of river types in a region should reflect the region's heterogeneity, there remains a trade-off between detail and interpretability, with 4-12 classes recommended (Poff et al., 2010, and citing others). Thus, Kennard et al. (2010) used 120 hydrologic metrics applied to 15-30 years of flow time-series data from 830 gauging weirs across Australia to develop 12 flow type classes. Numerous approaches may be used to define classes; these have included the use of principal component analysis (Hughes and James, 1989) and cluster analysis (Poff and Ward, 1989).
Attributing a spatial database with metrics and flow types provides considerable utility value in terms of interrogating sub-catchments for baseline hydrological metrics, and rapidly defining statistically robust reference ranges for selected flow metrics. While the geographical distribution of flow types may show varying degrees of spatial cohesion, or non-contiguous distribution, an explicit spatial product resulting from regional flow type classifications could facilitate researchers developing generalisations about interactions between hydrology and ecology, on the basis that response to natural flow regime characteristics is likely to vary between flow types (Kennard et al., 2010). The regional approach has application in smaller-scale regional planning purposes as a framework for better understanding the hydrological nature of South Africa's rivers. Beyond this, site-specific assessments would be required that take into account each river system's unique attributes, for individual, project-level assessments (for example, individual dam or other water resource projects).
The flow type classification provides a platform for comparing flow patterns between primary catchments within the same flow region. The classification encapsulates both magnitudes and variability, and has the potential to be applied at a 'Sustainability Boundary Approach' level (Richter, 2010), or to be prescriptive in relation to specific metrics. This product has considerable utility value through the linking of the spatial product of flow types and the associated metrics databases. Our classification could be applied in a range of arenas - including land-use change scenarios, definitions of reference flow conditions, impacts of in-channel impoundments, impacts of inter-basin transfer schemes (both donor and receiving systems), climate change impacts, and regional conservation planning and species recovery plans - and could be applied by a wide range of users and organisations required to make recommendations on flow requirements, including government departments, conservation agencies and research organisations. Scenario testing and risk analyses based on future flow scenarios can be applied to the different flow types, on the basis that these types differ in flow variability and predictability (Kennard et al., 2010).
Future research areas could include the development of scripts in the statistical software R (R Development Core Team, 2014) to automate future iterations, such as for regional refinement of the simulated data time-series. Developing biological response curves would improve the predictive power of the flow type classification through an understanding of the probable responses of key aquatic species to changes in flow metrics, where a promising approach is the use of multi-metric logistic regression models (Rivers-Moore et al., 2007; McManamay et al., 2013). This provides the basis for calculating odds ratios, thereby providing the capacity to make more informed decisions based on likelihoods, which can be taken to stakeholders for choosing the most societally acceptable regional option. Given the potential of this approach, and taking cognisance of the above points, the ultimate potential of this approach would be to work towards an online spatial database available for interrogation. Over time, and with sustained inputs, there is scope for building up a range of biological response curves that could act as hypothesis of system change that could be tested through ongoing adaptive management approaches.
ACKNOWLEDGEMENTS
The Water Research Commission of South Africa (WRC) is gratefully acknowledged for funding this research (WRC Project K5/2315). We thank Mr Wandile Nomquphu of the WRC for supporting the project. Bruce Paxton and Jarryd Gilham are thanked for their assistance in data processing.
REFERENCES
BROWN CA and JOUBERT A (2003) Using multicriteria analysis to develop environmental flow scenarios for rivers targeted for water resource management. Water SA 29 365-374. https://doi.org/10.4314/wsa.v29i4.5041 [ Links ]
BUNN SE and ARTHINGTON AH (2010) Basic principles and ecological consequences of altered flow regimes for aquatic biodiversity. Environ. Manage. 30 492-507. https://doi.org/10.1007/s00267-002-2737-0 [ Links ]
CHIEW FHS, MCMAHON TA and PEEL MC (1995) Some issues of relevance to South African streamflow hydrology. Proc. 7th S.Afr. Hydrol. Symp., 4-6 September 1995, Grahamstown, South Africa. [ Links ]
COLWELL RK (1974) Predictability, constancy, and contingency of periodic phenomena. Ecology 55 1148-1153. https://doi.org/10.2307/1940366 [ Links ]
DALLAS HF (2004) Spatial variability in macroinvertebrate assemblages: comparing regional and multivariate approaches for classifying reference sites in South Africa. Afr. J. Aquat. Sci. 29 161-171. https://doi.org/10.2989/16085910409503807 [ Links ]
DE MOOR FC (2002) Shortcomings and advantages of using rapid biological assessment techniques for the purpose of characterising rivers in South Africa. Verh. Int. Verein. Limnol. 28 651-662. https://doi.org/10.1080/03680770.2001.11901795 [ Links ]
DE MOOR FC (2006) Regional biogeographical differences in Trichoptera diversity in South Africa: Observed patterns and processes. In: Bueno-Soria J, Barba-Álvarez R and Armitage B (eds) Proceedings of the XIIth International Symposium on Trichoptera, 18-22 June 2006. 211-218. [ Links ]
EEKHOUT S, KING JM AND WACKERNAGEL A (1997) Classification of South African rivers, Volume 1. Department of Environmental Affairs and Tourism, Pretoria. [ Links ]
GORDON ND, MCMAHON TA and FINLAYSON BL (1994) Stream Hydrology: An Introduction for Ecologists. Wiley, Chichester. [ Links ]
HAINES AT, FINLAYSON BL and MCMAHON TA (1988) A global classification of river regimes. Appl. Geogr. 8 255-272. https://doi.org/10.1016/0143-6228(88)90035-5 [ Links ]
HARRISON AD (1959) General statement on South African Hydrobiological Regions. Report No. 1, project 6.8H. Internal Report, National Institute for Water Research, Council for Scientific and Industrial Research, Pretoria. 12 pp. [ Links ]
HUGHES DA and HANNART P (2003) A desktop model used to provide an initial estimate of the ecological instream flow requirements of rivers in South Africa. J. Hydrol. 270 167-181. https://doi.org/10.1016/S0022-1694(02)00290-1 [ Links ]
HUGHES JM and JAMES B (1989) A hydrological regionalisation of streams in Victoria, Australia, with implications for stream ecology. Aus. J. Mar. Freshwater Res. 40 303-326. https://doi.org/10.1071/MF9890303 [ Links ]
JACKSON HM, GIBBINS CN and SOULSBY C (2007) Role of discharge and temperature variation in determining invertebrate community structure in a regulated river. River Res. Appl. 23 651-669. https://doi.org/10.1002/rra.1006 [ Links ]
JOUBERT AR and HURLY PR (1994) The use of daily flow data to classify South African rivers. Chapter 11. In: King JM, Tharme RE (eds) Assessment of the instream flow incremental methodology and initial development of alternative instream flow methodologies for South Africa. WRC Report No. 295/1/94. Water Research Commission, Pretoria. 286-359. [ Links ]
KENNARD MJ, PUSEY BJ, OLDEN JD, MACKAY SJ, STEIN JL and MARSH N (2010) Classification of natural flow regimes in Australia to support environmental flow management. Freshwater Biol. 55 171-193. https://doi.org/10.1111/j.1365-2427.2009.02307.x [ Links ]
KLEYNHANS CJ, THIRION C and MOOLMAN J (2005) A Level I river ecoregion classification system for South Africa, Lesotho and Swaziland. Report No. N/0000/00/REQ0104. Resource Quality Services, Department of Water Affairs and Forestry, Pretoria. [ Links ]
MAHERRY AM, HORAN MJC, SMITH-ADAO LB, VAN DEVENTER H, NEL JL, SCHULZE RE and KUNZ RP (2013) Delineating river network quinary catchments for South Africa and allocating associated daily hydrological information. WRC Report No. 2020/1/12. Water Research Commission, Pretoria. [ Links ]
MATHEWS R and RICHTER BD (2007) Application of the indicators of hydrologic alteration software in environmental flow setting. J. Am. Water Resour. Assoc. 43 1400-1413. https://doi.org/10.1111/j.1752-1688.2007.00099.x [ Links ]
MCCUNE B and MEFFORD MJ (2011) PC-ORD. Multivariate Analysis of Ecological Data. Version 6.16. MjM Software, Gleneden Beach, Oregon, U.S.A. [ Links ]
MCMANAMAY RA, ORTH DJ, DOLLOFF CA and MATHEWS DC (2013) Application of the ELOHA framework to regulated rivers in the upper Tennessee River Basin: A case study. Environ. Manage. 51 1210-1235. https://doi.org/10.1007/s00267-013-0055-3 [ Links ]
O'KEEFFE JH and DE MOOR FC (1988) Changes in the physico-chemistry and benthic invertebrates of the Great Fish River, South Africa, following an interbasin transfer of water. Regul. Rivers: Res. Manage. 2 39-55. https://doi.org/10.1002/rrr.3450020105 [ Links ]
OLDEN JD and POFF NL (2003) Redundancy and the choice of hydrologic indices for characterizing streamflow regimes. River Res. Appl. 19 101-121. https://doi.org/10.1002/rra.700 [ Links ]
OLDEN JD, KENNARD MJ and PUSEY BJ (2012) A framework for hydrologic classification with a review of methodologies and applications in ecohydrology. Ecohydrology 5 503-518. https://doi.org/10.1002/eco.251 [ Links ]
PALMER RW and O'KEEFFE J (1989) Temperature characteristics of an impounded river. Arch. Hydrobiol. 116 471-485. [ Links ]
POFF NL, RICHTER BD, ARTHINGTON AH, BUNN S, NAIMAN RJ, KENDY E, ACREMAN M, APSE C, BLEDSOE B, FREEMAN MC and co-authors (2010) The ecological limits of hydrologic alteration (ELOHA): a new framework for developing regional environmental flow standards. Freshwater Biol. 55 147-170. https://doi.org/10.1111/j.1365-2427.2009.02204.x [ Links ]
POFF NL and WARD JV (1989) Implications of streamflow variability and predictability for lotic community structure: a regional analysis of streamflow patterns. Can. J. Fish. Aquat. Sci. 46 1805-1818. https://doi.org/10.1139/f89-228 [ Links ]
POFF NL and ZIMMERMAN JKH (2010) Ecological responses to altered flow regimes: a literature review to inform the science and management of environmental flows. Freshwater Biol. 55 194-205. https://doi.org/10.1111/j.1365-2427.2009.02272.x [ Links ]
R DEVELOPMENT CORE TEAM (2014) R: A language and environ-ment for statistical computing, v. 3.1.2. R Foundation for Statistical Computing, Vienna, Austria. ISBN 3-900051-07-0. http://www.R-project.org [ Links ]
RICHTER BD (2010) Re-thinking environmental flows: From allocations and reserves to sustainability boundaries. River Res. Appl. 26 1052-1063. https://doi.org/10.1002/rra.1320 [ Links ]
RICHTER BD, BAUMGARTNER JV, POWELL J and BRAUN DP (1996) A method for assessing hydrologic alteration within ecosystems. Conserv. Biol. 10 1163-1174. https://doi.org/10.1046/j.1523-1739.1996.10041163.x [ Links ]
RIVERS-MOORE NA, DE MOOR FC, MORRIS C and O'KEEFFE J (2007) Effect of flow variability modification and hydraulics on invertebrate communities in the Great Fish River (Eastern Cape Province, South Africa), with particular reference to critical hydraulic thresholds limiting larval densities of Simulium chutteri Lewis (Diptera, Simuliidae). River Res. Appl. 23 201-222. https://doi.org/10.1002/rra.976 [ Links ]
RIVERS-MOORE NA, HUGHES DA and DE MOOR FC (2008) A model to predict outbreak periods of the pest blackfly Simulium chutteri Lewis (Simuliidae, Diptera) in the Great Fish River, Eastern Cape province, South Africa. River Res. Appl. 24 132-147. https://doi.org/10.1002/rra.1055 [ Links ]
RIVERS-MOORE NA, PALMER RW and DALLAS HF (2014) Assessing the relative culpability of Simulium (Diptera: Simuliidae) species in recent blackfly outbreaks along the middle Orange River, South Africa. Can. J. Zool. 92 505-513. https://doi.org/10.1139/cjz-2014-0008 [ Links ]
SCHULZE RE (1995) Hydrology and Agrohydrology: A text to accompany the ACRU 3.00 agrohydrological modelling system. WRC Report No. TT 69/95. Water Research Commission, Pretoria. [ Links ]
SCHULZE RE (2010) Atlas of climate change and the South African agricultural sector: a 2010 perspective. WRC Report No. 1843/1/10. Water Research Commission, Pretoria. 387 pp. [ Links ]
SCHULZE RE and MAHARAJ M (2007) Rainfall seasonality. In: Schulze RE (ed) (2007) South African Atlas of Climatology and Agrohydrology. WRC Report No. 1489/1/06. Water Research Commission, Pretoria. [ Links ]
SMITHERS JC and SCHULZE RE (2004) ACRU agrohydrological modelling system: User manual version 4.00. School of Bioresources Engineering and Environmental Hydrology, University of KwaZulu-Natal, Pietermaritzburg. [ Links ]
SNADDON CD and DAVIES BR (1998) A preliminary assessment of the effects of a small South African inter-basin water transfer on discharge and invertebrate community structure. Regulated Rivers: Res. Manage. 14 421-441. https://doi.org/10.1002/(SICI)1099-1646 (1998090)14:5<421::AID-RRR509>3.0.CO;2-L [ Links ]
STATZNER B and HIGLER B (1986) Stream hydraulics as a major determinant of benthic invertebrate zonation patterns. Freshwater Biol. 16 127-139. https://doi.org/10.1111/j.1365-2427.1986.tb00954.x [ Links ]
STODDARD JL, LARSEN DP, HAWKINS CP, JOHNSON RK and NORRIS RH (2006) Setting expectations for the ecological condition of streams: The concept of reference condition. Ecol. Appl. 16 1267-1276. https://doi.org/10.1890/1051-0761(2006)016[1267:SEFTEC]2.0.CO;2 [ Links ]
TAYLOR V (2006) The hydrological basis for the protection of water resources to meet environmental and societal requirements. PhD thesis, University of KwaZulu-Natal, Pietermaritzburg. [ Links ]
TAYLOR V, SCHULZE R and JEWITT G (2003) Application of the Indicators of Hydrological Alteration method to the Mkomazi River, KwaZulu-Natal, South Africa. Afr. J. Aquat. Sci. 28 1-11. https://doi.org/10.2989/16085914.2003.9626593 [ Links ]
THARME RE (2003) A global perspective on environmental flow assessment: emerging trends in the development and application of environmental flow methodologies for rivers. River Res. Appl. 19 397-441. https://doi.org/10.1002/rra.736 [ Links ]
 Correspondence:
NA Rivers-Moore
Email: blackfly1@vodamail.co.za
Received: 24 September 2017
Accepted: 2 June 2020

