


Servicios Personalizados
Articulo
 Inglés (pdf)
 Articulo en XML
 Referencias del artículo
Indicadores

Links relacionados
-
 Citado por Google
 -
 Similares en Google
Compartir

 Permalink
Water SA
versión On-line ISSN 1816-7950
versión impresa ISSN 0378-4738
Water SA vol.46 no.3 Pretoria jul. 2020
http://dx.doi.org/10.17159/wsa/2020.v46.i3.8647
RESEARCH PAPERS
A preliminary fish survey of the estuaries on the south-east coast of South Africa, Kei Estuary to Mdumbi: A comparative study
NC JamesI, III; TD HarrisonII, I
ISouth African Institute for Aquatic Biodiversity, Private Bag 1015, Grahamstown, 6140, South Africa
IIMarine and Fisheries Division, Department of Agriculture, Environment and Rural Affairs, 17 Antrim Rd, Lisburn, BT28 3AL, Northern Ireland
IIIDepartment of Ichthyology and Fisheries Science, Rhodes University, Grahamstown, 6140, South Africa
ABSTRACT
A preliminary ichthyofaunal and physico-chemical survey of estuaries on the south-east coast of South Africa from the Kei Estuary to the Mdumbi Estuary was undertaken between October and November 1997. Twenty-seven (27) estuaries were surveyed along this stretch of coastline and these were grouped into three estuary types: small (< 10 ha) predominantly closed estuaries, moderate to large (> 10 ha) predominantly closed estuaries and predominantly open estuaries. Multivariate analyses revealed significant differences between predominantly closed estuaries and predominantly open estuaries in terms of both their physico-chemical characteristics and their fish communities. There was no difference between small and moderate to large predominantly closed estuaries. A significant relationship was also observed between the physico-chemical characteristics of the estuaries and their fish communities. The estuaries in the study area fall within the warm-temperate biogeographic region; temperate species dominated the fish communities of all the estuaries. This survey represents one of the few fish surveys undertaken along this little-studied section of the coastline.
Keywords: ichthyofauna, estuarine survey, fish habitat, southern Transke
INTRODUCTION
Research into fish communities in the Eastern Cape Province of South Africa has excluded to a large extent the former Transkei region of the province (Mbande et al., 2005), such that information on most systems along this coastline is classified as poor or non-existent (Whitfield and Baliwe, 2013). This paper focuses on the southern Transkei, which is regarded as falling within the warm-temperate biogeographic region; the boundary between the warm-temperate and subtropical regions is situated at the Mdumbi Estuary (Harrison, 2002). The fish species diversity in South African estuaries increases from west to east (Harrison, 2002) and, as such, the southern Transkei estuaries are expected to have more species than the estuaries further south/southwest (e.g. James and Harrison 2010a; 2010b; 2011; 2016). As the southern Transkei estuaries are situated south of the biogeographic boundary, estuaries in this region are likely dominated by temperate species with moderate numbers of tropical species.
The overall ecology, including the fish assemblage, of the large predominantly open Kei (Plumstead, 1984; Plumstead et al., 1985), Mbhashe (Plumstead, 1984b; Plumstead, 1990; Plumstead et al., 1989) and Mthatha (Plumstead, 1984; Plumstead et al., 1989) estuaries was studied in the 1970s and 1980s. Limited information has been published on the fish fauna of the temporarily open/closed Nqabara (Marais and Prinsloo, 1980), Ngoma/Kobule (Van der Elst, 1978) and Ngqusi/Inxaxo (Wasserman et al., 2010) estuaries. As part of a national assessment of South African estuaries, a fish survey was undertaken along the south-east coastline between the Kei Estuary and the Mdumbi Estuary; basic physico-chemical variables, fish community data and a comparative analysis are provided. Although this survey was conducted more than 20 years ago, this data provides useful baseline information on the fish fauna of this poorly studied region, particularly in the light of climate change related distribution shifts.
STUDY AREA
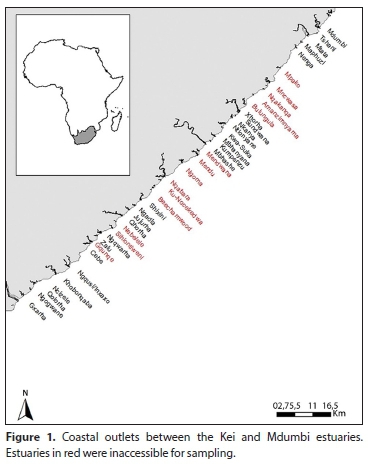
The section of coastline between the Kei Estuary and Mdumbi extends some 117 km and is intersected by 40 river outlets (Fig. 1). Along this section of the coastline, although rain falls all year, most falls in summer from November to January, with a minimum in July (Emmerson, 2005). Extreme rainfall events are common and are not only restricted to the summer rainfall season but may also occur in winter and early spring (Plumstead et al., 1985). The coastline is influenced by the south-flowing Agulhas Current (Shannon, 1989; Heydorn, 1991). Being tropical in origin, the waters of this current are relatively warm; however, as it flows south it tends to cool, with inshore water temperatures along the Eastern Cape coast varying between 17 and 20°C (Smit et al., 2013).
MATERIALS AND METHODS
The estuaries between the Kei and Mdumbi were sampled between October and November 1997. Each system was sampled once and took 1-3 days to survey, depending on the size of the system. Twenty-six of the forty estuaries were accessible for sampling.
Physico-chemical
During each survey, selected physico-chemical parameters were measured at various sites within each system, ranging from the mouth area (Site 1) upstream; the number of sites varied depending on the size of each system. Water depth and transparency were measured using a 20 cm diameter Secchi disc attached to a weighted shot line graduated at 10 cm intervals. Temperature (°C), salinity (psu), pH, dissolved oxygen (mg∙L-1), and turbidity (NTU) were measured using a Horiba U-10 Water Quality Checker. Where water depth permitted (usually >0.5 m), both surface and bottom waters were measured. The mouth state of each system at the time of sampling was also noted.
Ichthyofauna
The ichthyofauna of each estuary was sampled using a 30 m long x 1.7 m deep x 15 mm bar mesh seine net fitted with a 5 mm bar mesh purse, and a fleet of multi-mesh gill nets. The gill nets were either 10 m or 20 m in length and 1.7 m in depth and consisted of three equal sections of 45 mm, 75 mm and 100 mm stretch meshes. Seine netting was carried out during daylight hours in shallow (< 1.5 m deep), unobstructed areas with gently sloping banks. Fish caught were identified and measured to the nearest millimetre standard length (SL) before being released. Where large catches of a species were made, a sub-sample was kept and returned to the laboratory where the fish were identified, measured and weighed to the nearest 1.0 g; specimens that could not be identified in the field were also kept and processed in the laboratory. All fishes were identified by reference to Smith and Heemstra (1991) and Skelton (1993); taxonomic identities of certain species were adjusted using information provided in Whitfield (2019). The total fish species composition, by number and mass, was calculated for each system. The relative biomass contribution of each species was calculated using actual recorded masses as well as masses derived from length-mass relationships provided in Harrison (2001). Fishes were also classified according to their biogeographic affinity (endemic/temperate, temperate, tropical, widespread) and the contribution of each group calculated for each estuary based on the number of species, abundance, and biomass.
Estuary classification
Estuaries were divided into two main groups on the basis of predominant mouth condition, according to the classification given in Harrison and Whitfield (2006a). The two main groups were predominantly open estuaries and predominantly closed estuaries. Predominantly closed estuaries were further sub-divided into two groups based on surface area: small closed estuaries with a surface area below 10 ha and moderate to large closed estuaries with a surface area above 10 ha.
Multivariate analyses
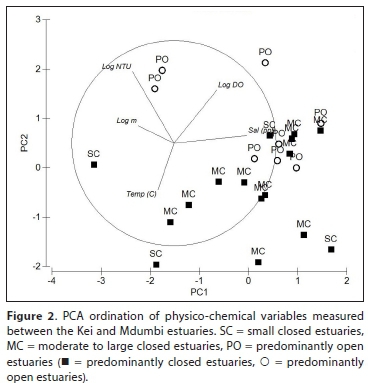
Data were analysed using the Plymouth Routines in Multivariate Ecological Research (PRIMER) package (version 6.0) with PERMANOVA+ add-on (PRIMER-E, Plymouth Marine Lab-oratory, UK). A principal component analysis (PCA) was undertaken on the overall mean (surface and bottom) values of the physico-chemical variables recorded in each system. Each parameter was first examined for normality; turbidity, depth and dissolved oxygen required log-transformation (ln[1 + x]). The data were also examined for any inter-correlations (Pearson r); pH exhibited significant correlations with both dissolved oxygen and salinity and was omitted from the analysis. Temperature and depth also showed a significant correlation; however, these parameters were retained in the analysis. A PCA was performed based on the following normalised parameters: depth, temperature, salinity, dissolved oxygen, and turbidity. An analysis of similarities (ANOSIM) was also undertaken (using the normalised Euclidean distance similarity measure) to test for significant differences between estuarine types.
Specimens not identified to species level (e.g. Mugilidae) as well as exotic species (e.g. Micropterus spp.) were excluded from the analysis. Abundance and biomass data were first standardised and then square-root transformed before calculating a Bray-Curtis similarity matrix. Standardisation removed the effect of variable sampling while transformation scales down the importance of dominant species (Field et al., 1982; Clarke and Warwick, 2001). A non-parametric multivariate analysis of variance (PERMANOVA) (Anderson, 2001) was applied to both the abundance and biomass data to examine differences in fish communities between estuary types. A similarity percentages analyses (SIMPER) was also undertaken to identify species that characterise estuary types as well as those that discriminate between estuary types. Relationships between physico-chemical and biotic resemblance matrices were also investigated using the RELATE routine; the measure of agreement is the Spearman rank correlation coefficient (Rho) between the corresponding elements of the two similarity matrices.
RESULTS
A total of 26 systems were sampled between Kei Estuary and the Mdumbi Estuary. Two systems, (Sundwana and Thsani) comprised small coastal streams and were not considered further. Of the remaining systems, 8 were predominantly open estuaries and 16 were predominantly closed estuaries. Of the predominantly closed estuaries, 12 were moderate to large (>10 ha) systems and 4 were small (<10 ha) systems.
Physico-chemical
Small predominantly closed estuaries
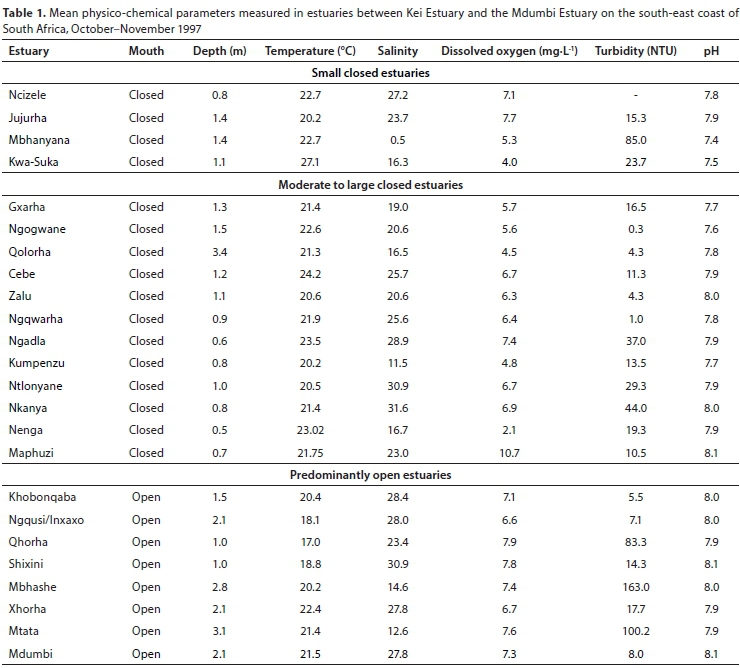
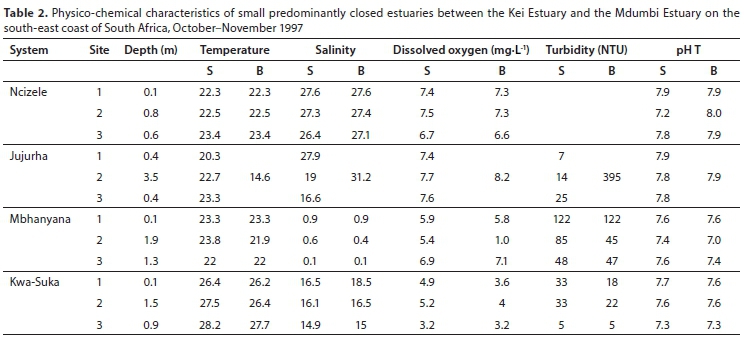
The four small predominantly closed systems were all closed at the time of sampling. All estuaries were relatively shallow, with average water depths generally not exceeding 1.4 m (Table 1). Mean water temperatures ranged between 20.2°C (Jujurha) and 22.7°C (Ncizele and Mbhanyana). Mean salinities were almost fresh (0.5) in the Mbhanyana and averaged from 16.3 (Kwa-Suka) to 27.2 in the Ncizele. Salinities were fairly uniform throughout most of the systems with no clear horizontal or vertical gradients. Only the Jujurha exhibited a horizontal decrease in salinity from 27.9 in the lower reaches to 16.6 in the upper reaches. A vertical salinity and temperature gradient was also recorded in the Jujurha in a 3.5 m deep site in the otherwise very shallow system (Table 2). Average dissolved oxygen values ranged between 4.0 mg∙L-1 (Kwa-Suka) and 7.7 mg∙L-1 (Jujurha). Mean turbidity values were highly variable and ranged from 15.3 NTU (Jujurha) to 85 NTU (Mbhanyana). Average pH values were between 7.4 and 7.9 (Table 1).
Moderate to large predominantly closed estuaries
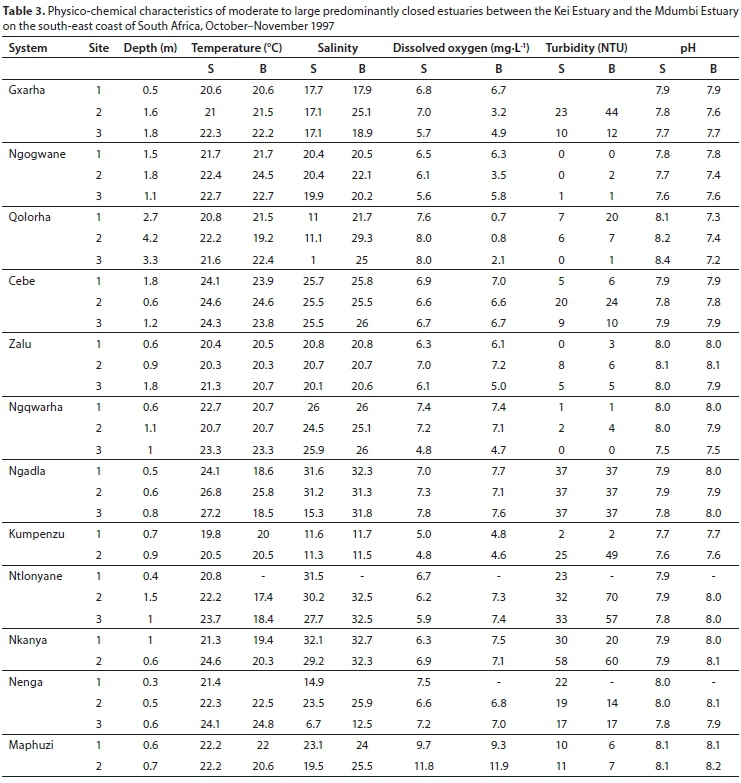
All 12 of the moderate to large predominantly closed estuaries were closed to the sea at the time of this survey. Mean water depths ranged from 0.5 m (Nenga) to 3.4 m (Qolorha) (Table 1). Water temperatures averaged between 20.2 (Kumpenzu) and 24.2°C (Cebe). Water temperatures increased from the lower to the upper reaches of the estuaries. Vertical temperature stratification, with a 1°C or more decrease in temperature from the surface to the bottom, was only evident in the Ngadla, Ntlonyane and Nkanya estuaries (Table 3). Mean salinities ranged from 16.5 (Qolorha) to 31.6 (Nkanya) (Table 1). A pronounced horizontal salinity gradient was present in the Qolorha, Ngqwara, Ngadla, Ntlonyane and Nenga estuaries, with salinities decreasing upstream from the mouth. These estuaries received marine water from overwash events. Pronounced vertical salinity stratification was observed in the Gxara, Qolorha, Ntlonyane, Nenga and Maphuzi estuaries (Table 3). Mean dissolved oxygen values ranged from 4.5 mg∙L-1 (Qolorha) to 10.7 mg∙L-1 (Mapuzi), with most values exceeding 5.0 mg∙L-1. The water column in these estuaries was clear (<10 NTU) to moderately turbid (<50 NTU). Mean pH values ranged from 7.6 (Ngogwane) to 8.1 (Maphuzi) (Table 1).
Predominantly open estuaries
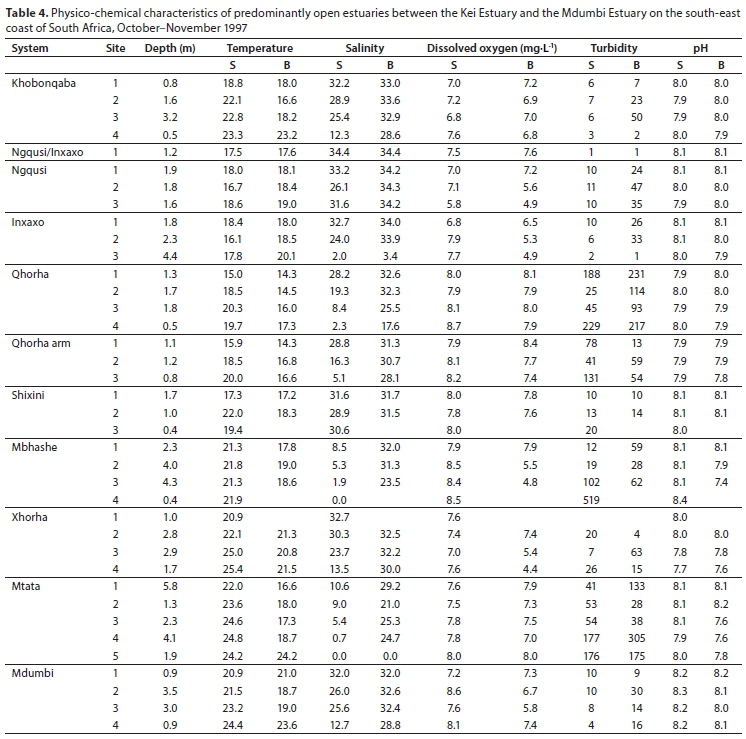
The predominantly open estuaries were all open at the time of sampling. Mean water depths recorded in the eight predominantly open estuaries ranged from 1 m (Qhorha and Shixini) to 3.1 m (Mtata) (Table 1). Water temperatures averaged between 17.0°C (Qhorha) and 22.4°C (Xhorha). Water temperatures in most systems increased upstream of the mouth, except for the Inxaxo arm of the Ngqusi/Inxaxo Estuary, where water temperatures decreased upstream (Table 4). The Mbhashe and Mtata estuaries were freshwater-dominated with mean salinities of 14.6 and 12.6 recorded in these systems, respectively (Table 1). In these systems the surface water was predominantly fresh, with pronounced vertical salinity stratification (Table 4). In contrast, mean salinities in the other six predominantly open estuaries were all above 21 (Table 1) and very little vertical salinity stratification was evident (Table 4). Mean dissolved oxygen values ranged between 6.6 and 7.9 mg∙L-1. The Qhorha, Mbhashe and Mtata estuaries were very turbid (> 80 NTU), whereas the other estuaries were fairly clear (<23 NTU). The mean pH in all estuaries was similar to seawater (7.9-8.1) (Table 1).
Multivariate analysis
The PCA classification (Fig. 2) divided the estuaries based on salinity (Axis 1) and depth, temperature and turbidity (Axis 2). The first two axes accounted for approximately 64% of the variation between the samples. Large predominantly open systems (Mbhashe, Mtata, Qhorha) were situated towards the upper right section of the plot associated with high turbidities, depth and dissolved oxygen (Fig. 2). The predominantly open Qhorha, Ngqusi/Inxaxo, Shixini, Khobonqaba, Xhorha and Mdumbi were situated towards the middle right associated with high salinities and low turbidities. The predominantly closed estuaries showed a gradation from estuaries with low salinities to estuaries with high salinities situated towards the right of the plot (Fig. 2). Although there was overlap between estuary types, the marine-dominated predominantly open estuaries were all situated towards the right of the plot. The ANOSIM test revealed a weak but significant difference between estuary types (Global R: 0.25; p < 0.05). Pairwise tests showed that there was no significant difference between small predominantly closed estuaries and moderate to large predominantly closed estuaries (R: 0.26; p > 0.05), however, significant differences were observed between predominantly open estuaries and both small and moderate to large predominantly closed estuaries (R: 0.24-0.35; p > 0.05).
Fish communities
Small predominantly closed estuaries
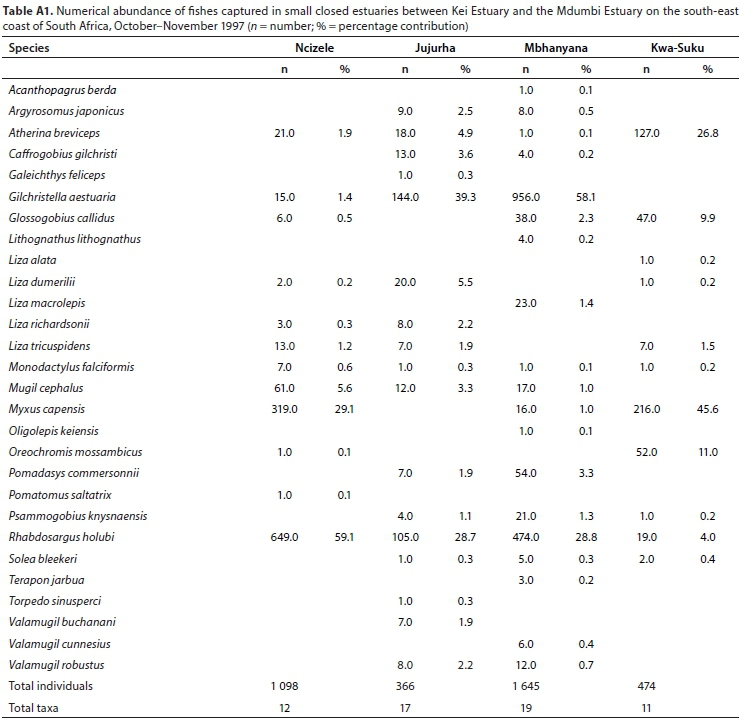
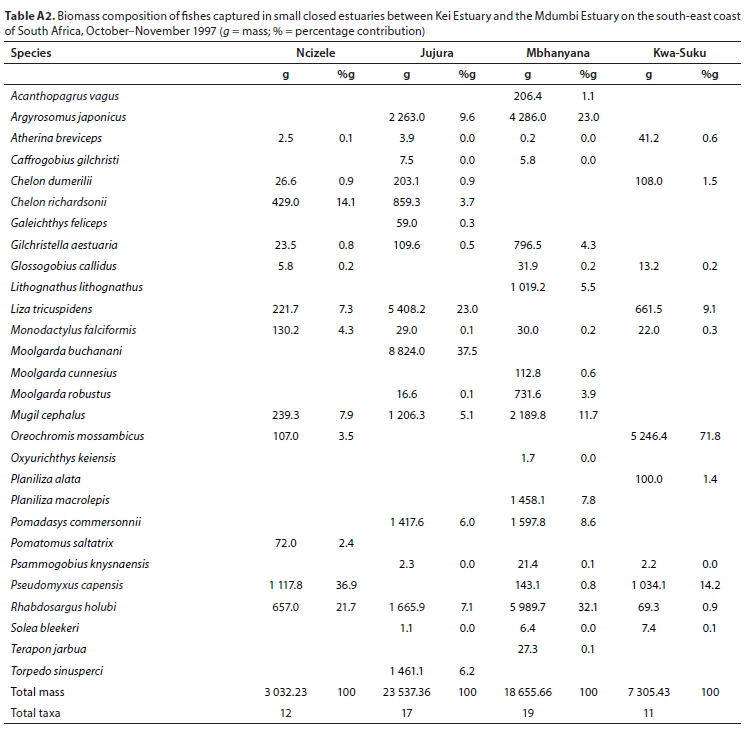
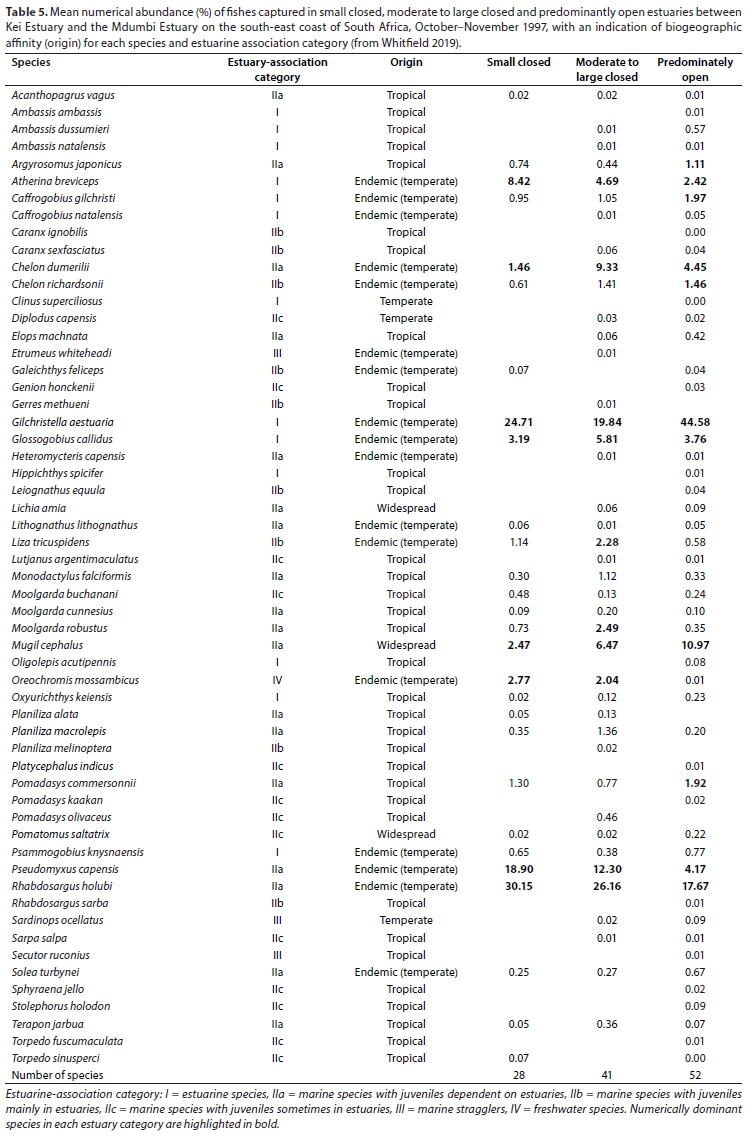
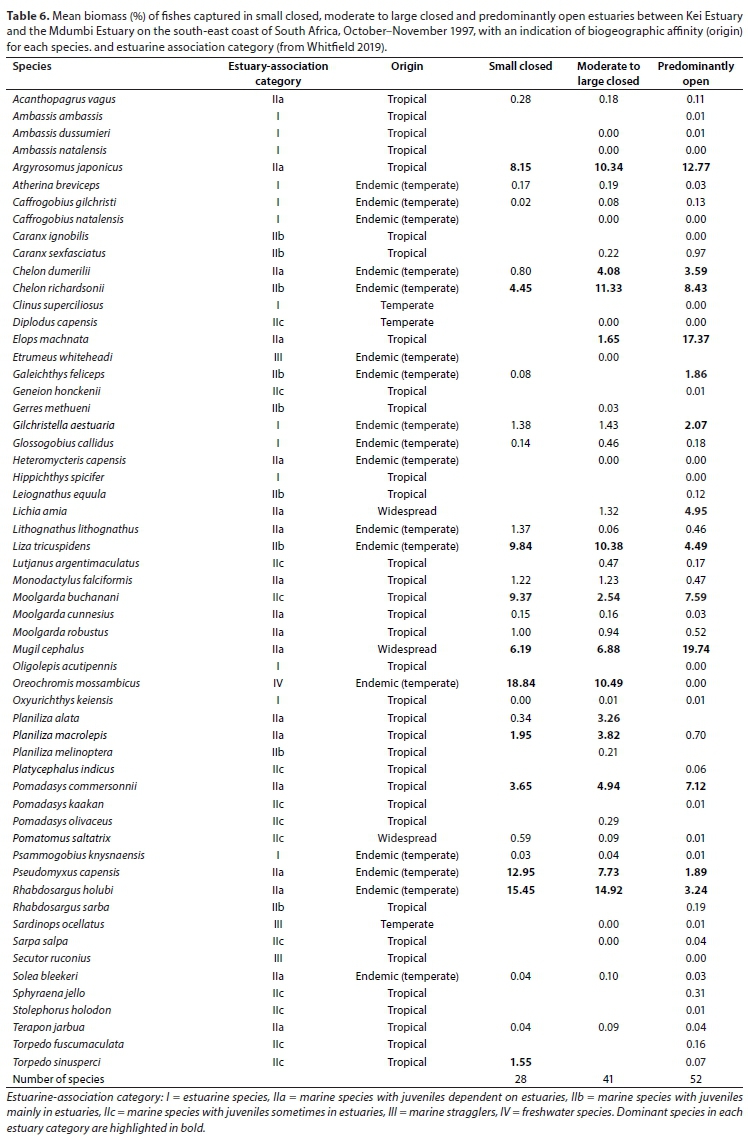
A total of 28 species were captured in small predominantly closed estuaries with between 11 (Kwa-Suka) and 19 (Mbhanyana) species captured per estuary. Numerically important species captured within this group of estuaries were Rhabdosargus holubi (mean = 30.2%), Gilchristella aestuaria (mean = 24.7%), Pseudomyxus capensis (mean = 18.9%), Atherina breviceps (mean = 8.4%), Glossogobius callidus (mean = 3.2%), Oreochromis mossambicus (mean = 2.8%), Mugil cephalus (mean = 2.5%), and Chelon dumerili (mean = 1.5%) (Table 5). Estuarine-associated marine species (Category II) dominated catches, numerically comprising 59% of the catch, followed by estuarine species (Category I), comprising 38% of the catch, and freshwater species (Category IV - 3%). Numerical abundance per estuary is given in Table A1 (Appendix). In terms of biomass, important species included Oreochromis mossambiccus (mean = 18.8%), R. holubi (mean = 15.5%), P. capensis (mean = 12.9%), Moolgarda buchanani (mean = 9.4%), Liza tricuspidens (mean = 9.8%), Argyrosomus japonicus (mean = 8.2%), M. cephalus (mean = 6.2%), Chelon richardsonii (mean = 4.5%), Pomadasys commersonii (mean = 3.7%), Planiliza macrolepis (mean = 2.0%), and Torpedo sinusperci (mean = 1.6%) (Table 6). In terms of biomass, estuary-associated marine species comprised 79% of the catch, followed by freshwater species (19%) and estuarine species (2%). Biomass of fishes per estuary is given in Table A2 (Appendix). Endemic (temperate) and temperate species dominated the catches and accounted for 50.0% of the taxa, 65.6% of the biomass, and 93.3% of the overall abundance.
Moderate to large predominantly closed estuaries
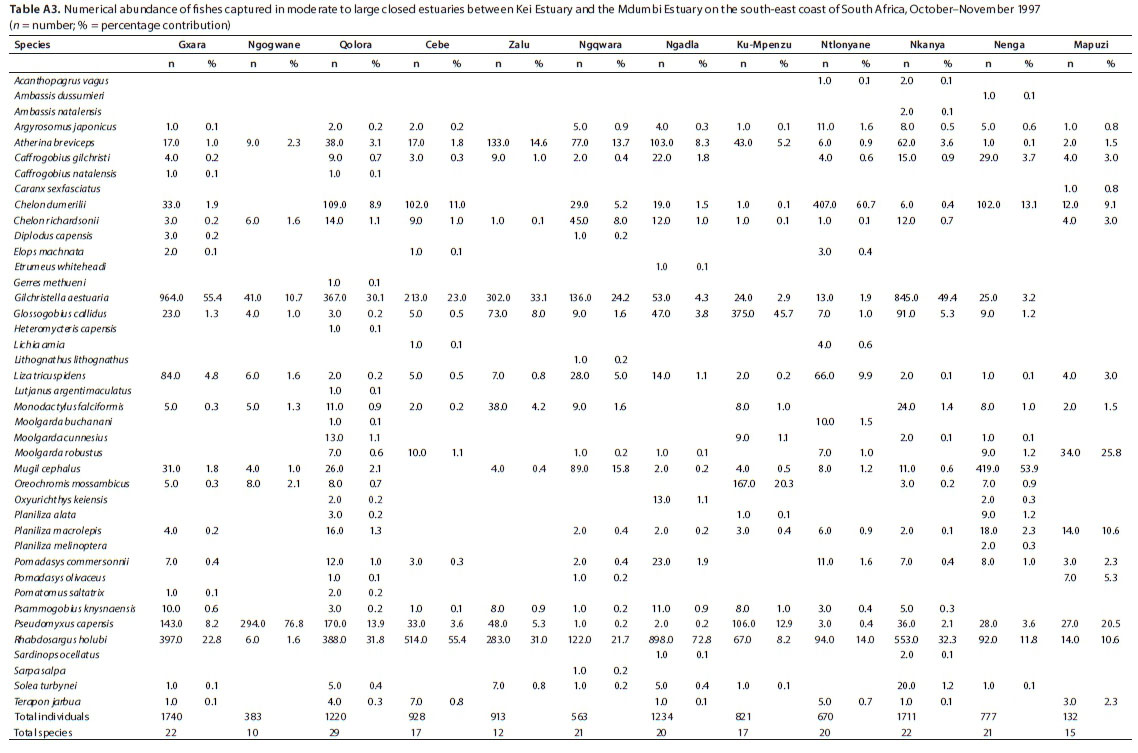
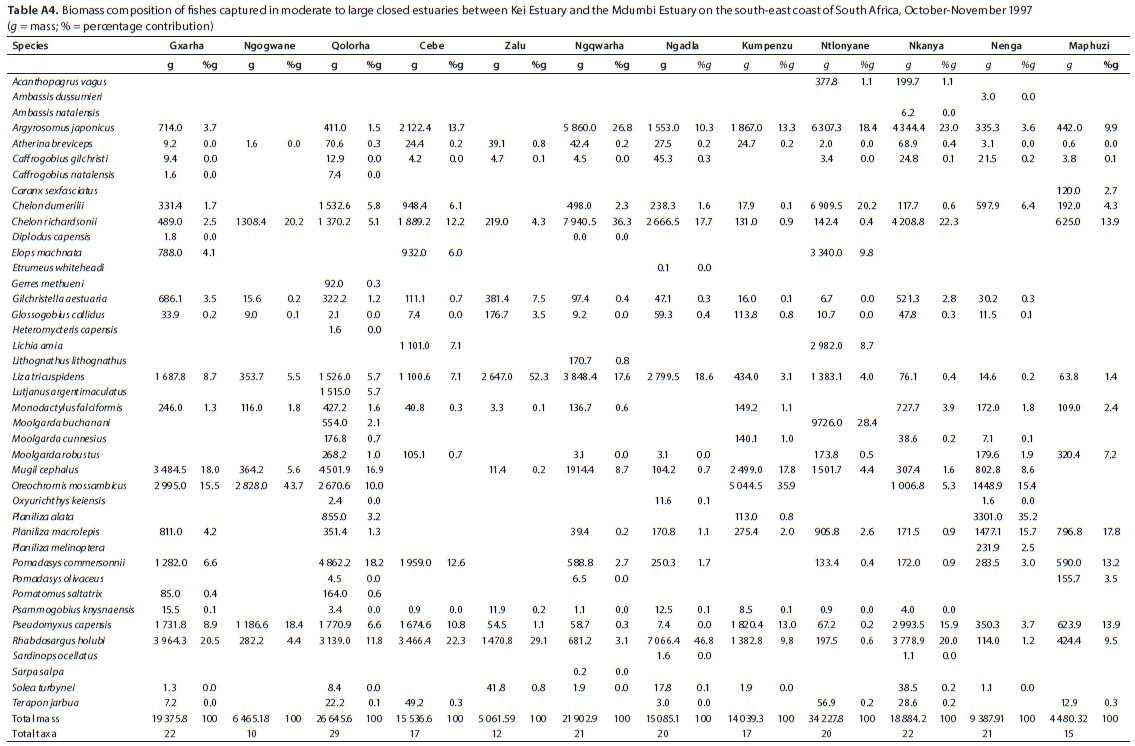
A total of 41 species were captured in moderate to large predominantly closed estuaries, with between 10 (Ngogwane) and 29 (Qolora) species captured per estuary. The most abundant species within this group of estuaries overall were R. holubi (mean = 26.2%), G. aestuaria (mean = 19.8%), P. capensis (mean = 12.3%), C. dumerili (mean = 9.3%), M. cephalus (mean = 6.5%), G. callidus (mean = 5.8%), Atherina breviceps (mean = 4.7%), Moolgarda robustus (mean = 2.5%), L. tricuspidens (mean = 2.3%), and O. mossambicus (mean = 2.0%) (Table 5). Estuarine-associated marine species comprised 66% of the catch, followed by estuarine species (32%) and freshwater species (2%). Numerical abundances per estuary are given in Table A3 (Appendix). Dominant species overall in terms of biomass included R. holubi (mean = 14.9%), C. richardsonii (mean = 11.3%), O. mossambicus (mean = 10.5%), L. tricuspidens (mean = 10.4%), A. japonicus (mean = 10.3%), P. capensis (mean = 7.7%), M. cephalus (mean = 6.9%), P. commersonnii (mean = 4.9%), C. dumerili (mean = 4.1%), Planiliza macrolepis (mean = 3.8%), Planiliza alata (mean = 3.3%), Moolgarda buchanani (mean = 2.5) and Elops machnata (mean = 1.7%) (Table 6). In terms of biomass, estuary-associated marine species comprised 87% of the catch, followed by freshwater species (11%) and estuarine species (2%). Biomass of fishes per estuary is given in Table A4 (Appendix). Endemic (temperate) and temperate species dominated the catches both numerically (85.7%) and in terms of biomass (61.3%). In terms of taxa, tropical species comprised 48.8% of the overall catches and endemic (temperate) and temperate species comprised 43.9%.
Predominantly open estuaries
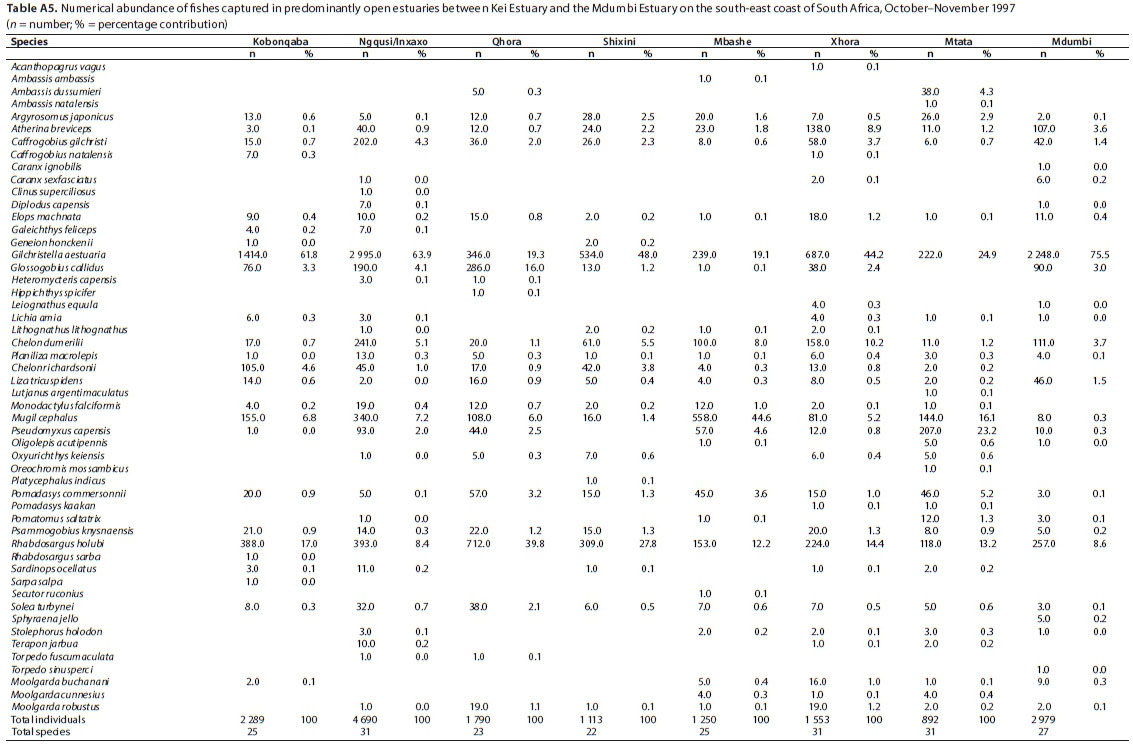
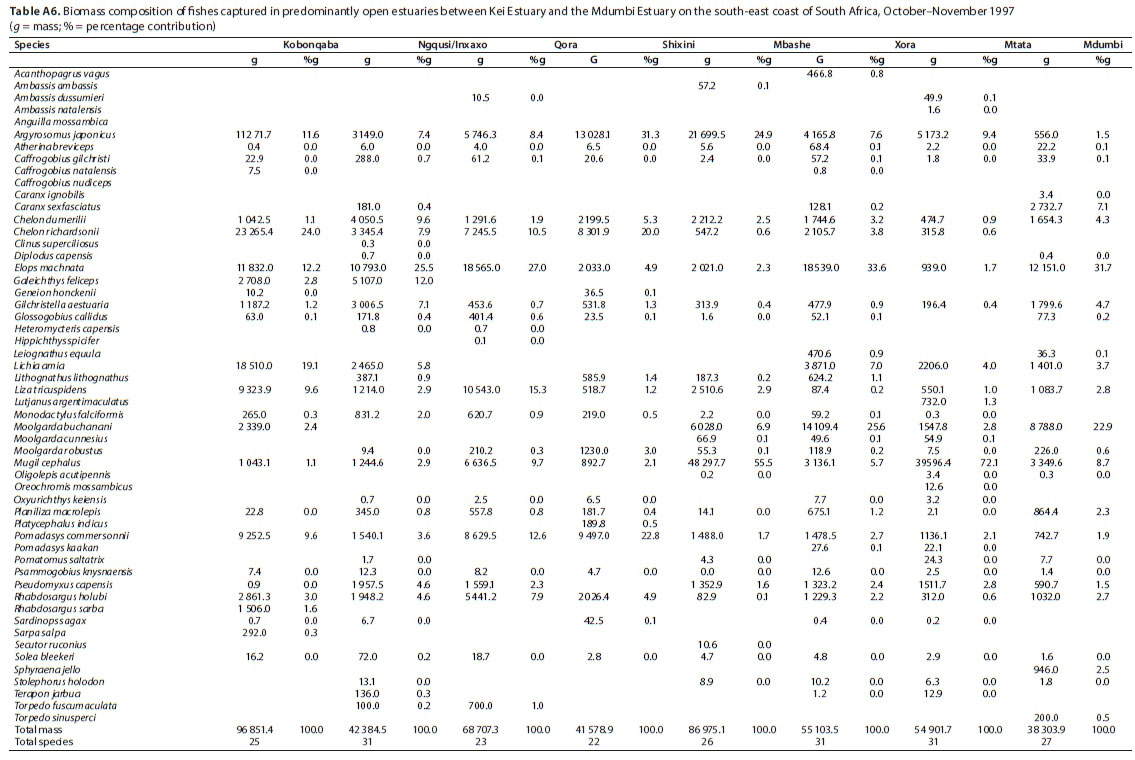
A total of 52 species were captured in the predominantly open estuaries, with between 22 (Shixini) and 31 (Ngqusi, Xhorha and Mtata) species captured per estuary. In terms of numbers, catches were dominated by G. aestuaria (mean = 44.6%), R. holubi (mean = 17.7%), M. cephalus (mean = 11.0%), C. dumerili (mean = 4.5%), P. capensis (mean = 4.2%), G. callidus (mean = 3.8%), A. breviceps (mean = 2.4%), Caffrogobius gilchristi (mean = 2.0%), P. commersonnii (mean = 1.9%), C. richardsonii (mean = 1.5%) and A. japonicus (mean = 1.1%) (Table 5). Estuarine species dominated catches numerically, comprising 54% of the catch, followed by estuarine-associated marine species (45%). Freshwater species and marine stragglers (Category III) together comprised 1% of the catch. Numerical abundances per estuary are given in Table A5 (Appendix). The fish species mass in predominantly open estuaries was dominated by M. cephalus (mean = 19.7%), Elops machnata (mean = 17.4%), A. japonicus (mean = 12.8%), C. richardsonii (mean = 8.4%), P. commersonnii (mean = 7.1%), M. buchanani (mean = 7.6%), Lichia amia (mean = 5.0%), L. tricuspidens (mean = 4.5%), C. dumerili (mean = 3.6%), R. holubi (mean = 3.2%), G. aestuaria (mean = 2.1%), P. capensis (mean = 1.9%) and Galeichthys feliceps (mean = 1.9%) (Table 6). In terms of biomass, estuary-associated marine species comprised 98% of the catch, followed by estuarine species (2%). Biomass of fishes per estuary is given in Table A6 (Appendix). Endemic (temperate) and temperate species dominated the catches numerically (82.8%); however, tropical species dominated in terms of biomass (48.8%) and taxa (57.7%).
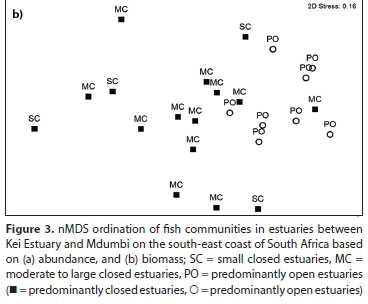
Multivariate analyses
The nMDS plot based on abundance produced a pattern where predominantly open estuaries clustered together and separated from predominantly closed estuaries, which were situated to the left of the plot. There was no separation between small and moderate to large predominantly closed estuaries (Fig. 3a). In terms of biomass, the separation between predominantly closed and open systems was less distinct, with one medium to large predominantly open estuary (Ntlonyane) clustering together with the predominantly open estuaries (Fig. 3b). The PERMANOVA test based on abundance data revealed significant differences between predominantly closed and open estuaries (Pseudo F = 3.1048, p = 0.006). Biomass yielded similar results, with the two estuary types being significantly different (Pseudo F = 4.0978, p = 0.003).

SIMPER analysis based on abundance showed that predominantly closed and open estuaries had an average dissimilarity of 39.12%. Species such as G.aestuaria, M. cephalus, C. dumerili, E. machnata, P. commersonnii and M. robustus, which collectively accounted for 24.2% of the overall dissimilarity, were more abundant in predominantly open than closed estuaries. Species such as R. holubi, M. capensis, G. callidus and O. mossambicus (which collectively accounted for 12.1% of the overall dissimilarity) were more abundant in predominantly closed systems. In terms of biomass there was a 45.4% dissimilarity between predominantly open and closed estuaries. Elops machnata, M. buchanani, L. amia, M. cephalus, C. richardsonii, P. commersonii and A. japonicus comprised a greater proportion of the biomass in predominantly open estuaries (collectively comprised 34.8% of the dissimilarity). Oreochromis mossambiccus and P. capensis comprised a greater proportion of the biomass in predominantly closed estuaries (accounting for 9.3% of the dissimilarity). The results of the RELATE analysis revealed significant relationships between the physico-chemical similarity matrix and both the fish abundance and biomass similarity matrices (Rho > 0.30, p < 0.05).
DISCUSSION
This survey provides baseline information on the estuaries and fish assemblages found along a poorly studied section of the South African coastline. Of the 26 estuaries considered in this study, 8 were predominantly open estuaries and 16 predominantly closed estuaries. Only four of the predominantly closed estuaries were small systems. Multivariate analyses suggested that predominantly open and predominantly closed estuaries had distinctive physico-chemical characteristics. The eight predominately open systems comprised of two freshwater-dominated systems (Mbhashe and Mtata) characterised by high turbidities and relatively low salinities. The Mbhashe and Mtata estuaries are typically highly turbid systems, with the high turbidity of the Mbhashe attributed to highly erodible sediments present in the extensive catchment, which extends from the southern Drakensberg to the coast. Poor catchment management (e.g. overgrazing, bad farming practices) has further increased the rate of soil erosion, also resulting in elevated sediment to these estuaries (O'Keeffe, 1989; Plumstead, 1990; Le Roux et al., 2008). The other six predominantly open estuaries were characterised by high salinities and low to moderate turbidities.
The predominantly closed estuaries formed a gradation from small estuaries with low salinities to small to moderate and large closed estuaries with higher salinities. Closed estuaries usually breach during periods of high fluvial discharge, particularly after rainfall in the catchment (Perissinotto et al., 2000; Cowley and Whitfield, 2001). Although sampling was conducted during October and November, with November normally representing the onset of the high flow period (James et al., 2020), all the predominantly closed estuaries were closed at the time of sampling, following a period of low rainfall. Elevated salinities in many of these closed estuaries may be due to wave overwash events, which introduce seawater into these systems (Cowley and Whitfield, 2001).
Estuaries in this region are close to the warm-temperate/subtropical biogeographic boundary (Harrison, 2002). Transition zones are typically areas of rapid environmental variability (Attrill and Rundle, 2002) and species turnover, resulting in increased levels of species richness (Spector, 2002; Konar et al., 2010). Furthermore, many tropical and temperate species reach their southern and northern distributional limit, respectively, within South African estuaries in the subtropical/warm-temperate transition-zone (e.g. Maree et al., 2000; Harrison and Whitfield, 2006b). Indicative of the high species richness in this region was the fact that 28 species were recorded in the four small predominantly closed estuaries, 41 species in the moderate to large predominantly closed estuaries and 52 species in the predominantly open estuaries. A comparable survey along the East London and surrounding coastline documented 26, 34 and 44 fish species from small predominately closed, moderate to large predominantly closed and predominantly open estuaries, respectively (James and Harrison, 2016). Many of the species recorded in southern Transkei estuaries and not in previous studies of south-east coast estuaries (James and Harrison 2010a; 2010b; 2011; 2016) were tropical species that are mainly confined to subtropical estuaries and whose distribution is strongly linked to temperature (Harrison and Whitfield, 2006). The southern Transkei coastline is located south of the break between the warm-temperate and subtropical region (Harrison, 2002). Maree et al. (2000) suggested that the subtropical and warm-temperate transition-zone for estuaries incorporates an area where the contribution of tropical and temperate species is roughly equal, i.e., 50%. In this study tropical species comprised between 43 and 58% of the number of species recorded and temperate species (including endemic species) comprised 37-50% of the species. Temperate species dominated all estuaries numerically (>80%), while in terms of biomass, tropical species comprised 28-49% and temperate species composed 26-66%. These findings are indicative of the estuaries occurring within the subtropical/warm-temperate transition-zone.
The nMDS plot based on abundance and biomass showed that predominantly open estuaries clustered together and separated from predominantly closed estuaries, which were situated to the left of the plot. There was no separation between small and moderate to large predominantly closed estuaries. Overall, dominant species numerically in the predominantly closed estuaries were Rhabdosargus holubi, Gilchristella aestuaria, Myxus capensis, Atherina breviceps, Chelon dumerili, Glossogobius callidus and Oreochromis mossambicus. Dominant species by mass were R. holubi, Argyrosomus japonicus, Pseudomyxus capensis, Mugil cephalus, Chelon richardsonii, Liza tricuspidens, Moolgarda buchanani, O. mossambicus and Pomadasys commersonii. Although species assemblages were similar between small and moderate to large predominantly open estuaries, the number of species recorded in the moderate to large estuaries (41) was much greater than in the small estuaries (28 species). Species only recorded in moderate to large and not in small predominantly closed estuaries included Ambassis ambassis, Ambassis natalensis, Caffrogobius natalensis, Caranx sexfasciatus, Diplodus capensis, Elops machnata, Etremeus whiteheadi, Gerres methueni, Heteromycteris capensis, Lichia amia, Planiliza melinoptera, Lutjanus argentimaculatus, Pomadasys olivaceus and Sardinops ocellatus. Only two species, Galeichthys feliceps and Torpedo sinusperci, were only found in small predominantly closed estuaries and not in moderate to large predominantly closed estuaries.
The greatest species richness was recorded in the predominantly open estuaries. Species only recorded in predominantly open estuaries included Ambassis dussumieri, Amblyrhynchotes honckenii, Anguila mossambica, Caffrogobius nudiceps, Caranx ignobilis, Clinus superciliosus, Hippichththys spicifer, Leiognathus equula, Oligolepis acutipennis, Platycephalus indicus, Pomadasys kaakan, Rhabdosargus sarba and Secutor ruconius. Many of these species are stenohaline marine species that are not dependent on estuaries (marine stragglers) (Whitfield, 2019). An increase in the number of marine stragglers recorded in the lower reaches of predominantly open estuaries often accounts for the greater species richness in predominantly open estuaries compared to predominantly closed estuaries (e.g. Bennett, 1989; Whitfield and Kok, 1992; Vorwerk et al., 2003; James and Harrison, 2016). Dominant species numerically in the predominantly open estuaries were G. aestuaria, R. holubi, Mugil cephalus, C. dumerili, P. capensis, G. callidus, A. breviceps, Caffrogobius gilchristi and P. commersonnii. Dominant species by biomass were M. cephalus, Elops machnata, A. japonicus, Chelon richardsonii, Moolgarda buchanani, Lichia amia, L. tricuspidens, C. dumerili, R. holubi, G. aestuaria, P. capensis and Galeichthys feliceps.
Although similar species were found to dominate catches in estuaries of East London and the surrounding coastline (James and Harrison, 2016), estuarine species such as Atherina breviceps, Gilchristella aestuaria and Glossogobius callidus comprised a greater proportion of the catch numerically in predominantly closed estuaries in the later study compared to this study. Overall, G. aestuaria and A. breviceps often represent a larger percentage of the catch, numerically, in predominantly closed estuaries than in predominantly open estuaries (James et al., 2007; Vorwerk et al., 2003; James and Harrison, 2016). The lower numbers of estuarine species recorded during this survey may be due to prolonged closed conditions. During extended closed periods fish populations in predominantly closed estuaries can decrease considerably due to predation (James et al., 2007).
This study found a significant link between estuary typology (and physico-chemical characteristics) and the fish communities present. Predominantly open estuaries have a near-permanent connection with the sea and are characterised by moderate to high salinities and high species richness. Predominantly closed systems have an intermittent connection with the sea and are characterised by shallow, warmer waters. Species richness in these systems is typically lower than predominantly open estuaries, although marine species may be introduced into these systems via barrier overwash. This study represents a unique survey of multiple estuaries along a little-studied section of the South African coastline.
ACKNOWLEDGEMENTS
This project was undertaken by the CSIR (Durban) and funded by the Department of Environmental Affairs. The authors would also like to thank the Walter Sisulu University for logistical and operational support during field sampling operations.
AUTHOR CONTRIBUTIONS
Conceptualisation, field work and sample analysis was done by TH. Interpretation of the results and writing of the first draft was done mainly by NJ.
ORCID
NC James
https://orcid.org/0000-0002-9472-5314
REFERENCES
ANDERSON MJ (2001) A new method for non-parametric multivariate analysis of variance. Aust. Ecol. 26 32-46. [ Links ]
ATTRILL MJ and RUNDLE SD (2002) Ecotone or ecocline: Ecological boundaries in estuaries. Estuar. Coast. Shelf Sci. 55 929-936. https://doi.org/10.1006/ecss.2002.1036 [ Links ]
BENNETT BA (1989) A comparison of the fish communities in nearby permanently open, seasonally open and normally closed estuaries in the South-Western Cape, South Africa. S. Afr. J. Mar. Sci. 8 43-55. https://doi.org/10.2989/02577618909504550 [ Links ]
CLARKE KR and WARWICK RM (2001) Change in Marine Com-munities: An Approach to Statistical Analysis and Interpretation. PRIMER-E, Plymouth. [ Links ]
COWLEY PD and WHITFIELD AK (2001) Ichthyofaunal characteristics of a typical temporarily open/closed estuary on the southeast coast of South Africa. Ichthyol. Bull. JLB Smith Inst. Ichthyol. 71 1-19. [ Links ]
EMMERSON W (2005) The nutrient status of Mgazana, a warm temperate mangrove estuary in the Transkei, Eastern Cape, South Africa. Wetlands Ecol. Manage. 13 405-418. https://doi.org/10.1007/s11273-004-0411-4 [ Links ]
FIELD JG, CLARKE KR and WARWICK RM (1982) A practical strategy for analysing multispecies distribution patterns. Mar. Ecol. Prog. Ser. 8 37-52. https://doi.org/10.3354/meps008037 [ Links ]
HARRISON TD (2001) Length-weight relationships of fishes from South African estuaries. J. Appl. Ichthyol. 17 46-48. https://doi.org/10.1046/j.1439-0426.2001.00277.x [ Links ]
HARRISON TD (2002) Preliminary assessment of the biogeography of fishes in South African estuaries. Mar. Freshwater Res. 53 479-490. https://doi.org/10.1071/MF01121 [ Links ]
HARRISON TD and WHITFIELD AK (2006a) Estuarine typology and the structuring of fish communities in South Africa. Environ. Biol. Fishes. 75 269-293. https://doi.org/10.1007/s10641-006-0028-y [ Links ]
HARRISON TD and WHITFIELD AK (2006b) Temperature and salinity as primary determinants influencing the biogeography of fishes in South African estuaries. Estuar. Coast. Shelf Sci. 66 335-345. https://doi.org/10.1016/j.ecss.2005.09.010 [ Links ]
HEYDORN AEF (1991) The conservation status of southern African estuaries. In: Huntley BJ (ed.) Biotic Diversity in Southern Africa. Concepts and Conservation. Oxford University Press, Cape Town. [ Links ]
HEYDORN AEF (1991) The conservation status of southern African estuaries. In: Huntley BJ (ed.) Biotic Diversity in Southern Africa. Concepts and Conservation. Oxford University Press, Cape Town. [ Links ]
JAMES NC and HARRISON TD (2010a) A preliminary survey of the estuaries on the southeast coast of South Africa, Cape St Francis - Cape Padrone, with particular reference to the fish fauna Trans. R. Soc. S. Afr. 65 69-84. https://doi.org/10.1080/00359191003652116 [ Links ]
JAMES NC and HARRISON TD (2010b) A preliminary survey of the estuaries on the southeast coast of South Africa, Cape Padrone - Great Fish River, with particular reference to the fish fauna Trans. R. Soc. S. Afr. 65 149-164. https://doi.org/10.1080/00359191003652165 [ Links ]
JAMES NC and HARRISON TD (2011) A preliminary survey of the estuaries on the southeast coast of South Africa, Old Woman's Tyolomnqa, with particular reference to the fish fauna Trans. R. Soc. S. Afr. 66 59-77. https://doi.org/10.1080/0035919X.2011.580018 [ Links ]
JAMES NC and HARRISON TD (2016) A preliminary fish survey of the estuaries on the southeast coast of South Africa, Kayser's Beach - Kei Mouth: a comparative study. Water SA. 42 82-101. https://doi.org/10.4314/wsa.v42i1.10 [ Links ]
JAMES NC, WHITFIELD AK, COWLEY PD and LAMBERTH S (2007) Fish communities in temporarily open/closed estuaries from the warm- and cool-temperate regions of South Africa - A review. Rev. Fish Biol. Fish. 17 565-580. https://doi.org/10.1007/s11160-007-9057-7 [ Links ]
JAMES NC, ADAMS JB, CONNELL AD, LAMBERTH SJ, MACKAY CF, SNOW G, VAN NIEKERK L and WHITFIELD AK (2020) High flow variability and storm events shape the ecology of the Mbhashe Estuary, South Africa. Afr. J. Aquat. Sci. 45 131-151. https://doi.org/10.2989/16085914.2020.1733472 [ Links ]
KONAR B, IKEN K, POHLE G, MILOSLAVICH P, CRUZ-MOTTA JJ, BENEDETTI-CECCHI L, KIMANI E, KNOWLTON A, TROTT T, ISETO T and SHIRAYAMA (2010) Surveying nearshore biodiversity. ln: McIntyre AD (ed.) Life in the World's Oceans Diversity, Distribution, and Abundance. Wiley-Blackwell: Blackwell Publishing Ltd., Oxford. 27-41. https://doi.org/10.1002/9781444325508.ch2 [ Links ]
LE ROUX JJ, MORGENTHAL TL, MALHERBE J, PRETORIUS DJ and SUMNER PD (2008) Water erosion prediction at a national scale in South Africa. Water SA. 34 305-314. https://doi.org/10.4314/wsa.v34i3.180623 [ Links ]
MARAIS JFK and PRINSLOO JF (1980) Species composition and catch per unit effort of fishes in four Transkeian estuaries. Unpublished Report, Zoology Department, University of Transkei, Umtata. [ Links ]
MAREE RC, WHITFIELD AK and BOOTH AJ (2000) Effect of water temperature on the biogeography of South African estuarine fishes associated with the subtropical/warm temperate subtraction zone. S. Afr. J. Sci. 96 184-188. [ Links ]
MBANDE S, WHITFIELD AK and COWLEY PD (2005) The ichthyofaunal composition of the Mngazi and Mngazana estuaries: a comparative study. Smithiana Bull. 4 1-20. [ Links ]
MUCINA L, SCOTT-SHAW R, RUTHERFORD MC, CAMP KGT, MATTHEWS WS, POWRIE LW and HOARE DB (2006) Indian Ocean Coastal Belt. 569-583. In: Mucina L and Rutherford MC (eds) The Vegetation of South Africa, Lesotho and Swaziland. SANBI, Pretoria. 568-583. [ Links ]
O'KEEFFE JH (1989) Conserving rivers in southern Africa. Biol. Conserv. 49 255-274. https://doi.org/10.1016/0006-3207(89)90047-5 [ Links ]
PERISSINOTTO R, WALKER DR, WEBB P, WOOLDRIDGE TH and BALLY R (2000) Relationships between zoo- and phytoplankton in a warm-temperate, semi-permanently closed estuary, South Africa. Estuar. Coast. Shelf Sci. 51 1-11. https://doi.org/10.1006/ecss.2000.0613 [ Links ]
PLUMSTEAD EE, PRINSLOO JF and SCHOONBEE HJ (1985) A survey of the fish fauna of Transkei estuaries. Part 1. The Kei River estuary. S. Afr. J. Zool. 20 231-220. https://doi.org/10.1080/02541858.1985.11447938 [ Links ]
PLUMSTEAD EE, PRINSLOO JF and SCHOONBEE HJ (1989) A survey of the fish fauna of Transkei estuaries. Part Two: The Mbashe estuary. S. Afr. J. Zool. 24 273-281. https://doi.org/10.1080/02541858.1989.11448165 [ Links ]
PLUMSTEAD EE (1990) Changes in ichthyofaunal diversity and abundance within the Mbashe Estuary, Transkei, following construction of a river barrage. S. Afr. J. Mar. Sci. 9 399-407. https://doi.org/10.2989/025776190784378817 [ Links ]
PLUMSTEAD EE (1984) The occurrence and distribution of fish in selected Transkei estuaries. MSc thesis, University of Transkei, Umtata. [ Links ]
SHANNON LV (1989) The physical environment. In: Payne AL and Crawford RJM (eds) Oceans of Life off Southern Africa. Vlaeberg Publishers, Johannesburg. [ Links ]
SKELTON PH (1993) A Complete Guide to the Freshwater Fishes of Southern Africa. Southern Book Publishers, Halfway House. 388 pp. [ Links ]
SMITH MM and HEEMSTRA PC (1991) Smiths' Sea Fishes. Southern Book Publishers, Johannesburg. 1 048 pp. [ Links ]
SMIT AJ, ROBERTS M, ANDERSON RJ, DUFOIS F, DUDLEY SFJ, BORNMAN TG, OBLERS J and BOLTON JJ (2013) A coastal seawater temperature dataset for biogeographical studies: larges biases between in situ and remotely-sensed data sets around the coast of South Africa. PLoS ONE. 8 e81944. https://doi.org/10.1371/journal.pone.0081944 [ Links ]
SPECTOR S (2002) Biogeographic crossroads as priority areas for biodiversity conservation. Conserv. Biol. 16 1480-1487. https://doi.org/10.1046/j.1523-1739.2002.00573.x [ Links ]
VORWERK PD, WHITFIELD AK, COWLEY PD and PATERSON AW (2003) The influence of selected environmental variables on fish assemblage structure in a range of southeast African estuaries. Environ. Biol. Fish. 66 237-247. [ Links ]
VAN DER ELST RP (1978) Notes on the teleost fauna of the Kobole estuary, Transkei. S. Afr. J. Wildlife Res. 8 83-85. [ Links ]
WASSERMAN RJ, STRYDOM NA and WOOLDRIDGE TH (2010) Larval fish dynamics in the Nxaxo-Ngqusi Estuary complex in the warm temperate - subtropical transition zone of South Africa. Afr. Zool. 45 63-77. https://doi.org/10.1080/15627020.2010.11657255 [ Links ]
WHITFIELD AK and KOK HM (1992) Recruitment of juvenile marine fishes into permanently open and seasonally open estuarine systems on the southern coast of South Africa. Ichth. Bull. 57 1-39. [ Links ]
WHITFIELD AK (2019) Fishes of Southern African Estuaries: From Species to Systems: Smithiana Monograph No. 4. 495 pp. [ Links ]
 Correspondence:
NC James
Email: n.james@saiab.ac.za
Received: 10 February 2020
Accepted: 2 July 2020
APPENDIX

