


![ERRATUM:Water quality in non-perennial rivers [Water SA 45 (3) 487-500]](/img/en/next.gif)


Services on Demand
Article
 English (pdf)
 Article in xml format
 Article references
Indicators

Related links
-
 Cited by Google
 -
 Similars in Google
Share

 Permalink
Water SA
On-line version ISSN 1816-7950
Print version ISSN 0378-4738
Water SA vol.46 n.2 Pretoria Apr. 2020
http://dx.doi.org/10.17159/wsa/2020.v46.i2.8248
RESEARCH PAPER
Biosorption of phenol by modified dead leaves of Posidonia oceânica immobilized in calcium alginate beads: Optimal experimental parameters using central composite design
Wassila Lazli; Amina Hellal
Ecole Nationale Polytechnique, Département de Génie de l'Environnement, Laboratoire des Sciences et Techniques de l'Environnement, 10 Avenue Hacen Badi BP 182, El Harrach, 16200 Algiers, Algeria
ABSTRACT
This study reports the biosorption of phenol using dead leaves of Posidonia oceanica (PO), an endemic seagrass in the Mediterranean Sea. The PO dead leaves were pre-treated with sulfuric acid and carbonized at 500°C for 2 h to increase their adsorptive capacity. Leaves were then immobilized in calcium alginate beads to address problems that arise when free particulate biosorbents are used. Response surface methodology (RSM) based on central composite design (CCD) was carried out to optimize key variables, viz., initial phenol concentration (100-500 mg/L), biosorbent dosage (0.05-0.1 g/50 mL), and alginate beads to solution ratio (1/10-2/10). The effect of the operating variables on phenol biosorption capacity was studied in a batch system and a mathematical model showing the influence of each variable and their interactions was obtained. The predicted second-order quadratic model for the response variable was significant (p < 0.01). Further, an adjusted squared correlation coefficient, R2 (adj) of 97.7% indicated a satisfactory fit of the model. The results of CCD showed maximum biosorption capacity of about 127 mg/g at 500 mg/L initial phenol concentration, 1 g/L biosorbent dosage, and at 1.85/10 composite beads to solution ratio. This work demonstrates the suitability of using PO dead leaves as an effective low-cost biosorbent for the removal of phenol.
Keywords: biosorption, central composite design, immobilization, phenol, Posidonia oceanica
INTRODUCTION
Phenol is a toxic organic compound commonly present in industrial effluents from synthetic chemical plants, petroleum refineries (Wang et al., 2014), coking operations, coal processing (Kazemi et al., 2014), resin manufacturing, dye factories, plastic industries (Arinjay et al., 2005), petrochemicals, pharmaceuticals and paint factories (Víctor-Ortega et al., 2016), paper making (Vaianoa et al., 2018), textile industries, ceramic plants, leather processing units, insecticide production units, steel plants (Karri et al., 2017), etc. It is frequently found at concentrations ranging from 50 to 2 000 mg/L (Hussain et al., 2015) but this can rise to 6 800 mg/L depending on the specific industrial activity (Dotto et al., 2013).
Since phenol is highly toxic, carcinogenic and potentially mutagenic (Salim et al., 2018; Razzaghi et al., 2018; Zhou et al., 2012), it has been classified as a major pollutant by the United States Environmental Protection Agency (USEPA) (Dotto et al., 2013). The leaching of phenol into surface water may introduce severe changes in food webs and reduce biodegradation levels, even at low concentrations (Salim et al., 2018). According to the recommendation of the World Health Organization, the permissible concentration of phenolic compounds in drinking water is 1 ug/L (Pigatto et al., 2013), and the USEPA has set a water purification standard of less than 1 part per billion (ppb) for phenol in surface water (Kazemi et al., 2014). Therefore, careful treatment of wastewater containing phenol is required before final discharge, to protect humans and wildlife (Tziotzios et al., 2007). For this purpose, many technologies have been employed, such as distillation, extraction (Dotto et al., 2013; Pigatto et al., 2013), membrane processes, adsorption, oxidation processes (Zhou et al., 2012; Loh et al., 2016), biological treatment (Razzaghi et al., 2018; Lazli et al., 2016; Nowee et al., 2017), ion exchange (Víctor-Ortega et al., 2016; Pigatto et al., 2013), chemical precipitation (Pigatto et al., 2013) and chemical coagulation (Víctor-Ortega et al., 2016).
Adsorption onto activated carbons is the most frequently used method because it has significant advantages over the other methods: high efficiency, easy handling, high selectivity, minimal production of chemical or biological sludge, etc. (Pigatto et al., 2013). But the high cost of activated carbon has led to the investigation of alternative, cheaper materials (Hank et al., 2014). Recently attention has turned to the use of biosorbents as viable alternatives, which include naturally occurring polymers and agricultural by-products, as they are cheap, renewable and abundantly available (Guo et al., 2014). Various biosorbents have been investigated to remove phenol from aqueous solutions, including orange peels (Romero-Cano et al., 2016), rice husk, tendu leaf, chitin (Tran et al., 2015), coconut shell, banana peel, avocado kernel seeds, olive pomace (Rangabhashiyam et al., 2014), chitosan, fungal mycelia, marine seaweeds and others (Dotto et al., 2013).
In the Mediterranean Sea, Posidonia oceanica is the dominant seagrass, which loses it leaves seasonally (Khiari et al., 2010). The dead leaves accumulate on the beaches in huge quantities as waste material and must be removed to clean beaches used for tourism (Cavas et al., 2011; Coletti et al., 2013). In the present study, dead leaves of PO, which are lignocellulosic biomass (Khiari et al., 2010), were used as an alternative low-cost biosorbent to remove phenol from aqueous solution. The PO dead leaves were pre-treated to increase their adsorptive properties and immobilized in calcium alginate beads to overcome the many problems resulting from their small particle size (Copello et al., 2008) and to facilitate separation of biosorbent from solution (Kumar et al., 2011).
MATERIALS AND METHODS
Materials
The raw material, PO dead leaves, was collected from the Tipaza beach (Algeria). They were washed several times with tap and distilled water to remove salt and impurities, and then dried in an oven at 60°C for 72 h. The dried leaves were crushed, suspended in distilled water and autoclaved at 120°C for 30 min. Finally, they were dried at 105°C for 24 h. The dried material was ground with a grinder and then screened to obtain particles of size less than 50 μm. Phenol and chemical reagents used in this study were all of analytical grade.
Pre-treatment of PO biosorbent
The chemical treatment of the biosorbent was performed using 10 g of PO dead leaf powder previously prepared in 100 mL of 10% H„SO, solution. The mixture was stirred at 150 r/min for 60 min to ensure proper penetration of H2SO4 in the raw material and heated at 130°C for 24 h. Treated PO leaves were washed with distilled water until the pH of the filtrate was higher than 4 and dried at 105°C for 24 h. Finally, the H2SO4-impregnated particles were placed in a ceramic crucible and carbonized in a muffle furnace. The carbonization was carried out at 500°C for 2 h at a heating rate of 10°C/min. The cooled carbonized biosorbent was stored in airtight containers.
Preparation of calcium alginate biosorbent beads
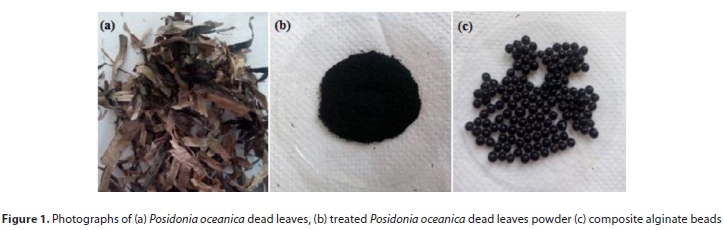
A known amount of PO biosorbent was added to 3% (w/v) sodium alginate solution; the mixture was homogenized and extruded as drops into a magnetically stirred 0.1 M CaCl2 aqueous solution. Beads about 3.0 mm of diameter were formed by extrusion through a 0.8 mm pipette tip, and left to harden in a CaCl2 solution for 30 min for complete replacement of sodium ions by calcium ions. Finally, the calcium alginate biosorbent beads were collected carefully and washed 3 times with distilled water to eliminate CaCl2 residues. The composite beads were stored at 4°C. Figure 1 shows the morphology of PO dead leaves, the appearance of the powder biosorbent and the composite beads.
Characterization of the biosorbent by FTIR
To qualitatively characterize the major functional groups present on the surface of PO dead leaves before and after pre-treatment, the FTIR (Fourier transform infrared spectroscopy) transmission spectrum was obtained using the KBr disk technique. The transmission FTIR spectra were recorded between 4 000 and 500 cm-1 using a Perkin-Elmer Fourier Transform 310.
Batch experiments
Batch biosorption experiments were carried out using 100 mL conical flasks containing 50 mL ofthe phenol solutions at different initial concentrations. Calcium alginate beads containing a desired amount of PO biosorbent were added to the phenol solution at a suitable volume ratio. The flasks were agitated at 175 r/min to guarantee a good dispersion of the composite beads for a period of 24 h to allow complete equilibration. Experiments were carried out at 20±2°C and at pH=4 which corresponded to the initial pH of phenol solutions supplemented with the pre-treated PO biosorbent. The biosorption capacity (Qe), which is the amount of phenol adsorbed per unit mass of the biosorbent (mg/g), was evaluated by using Eq. 1:

where C0 and Ce are the initial and final phenol concentration (mg/L) in solution, respectively, V is the volume of solution in mL and w is the weight of biosorbent in g.
The phenol content was analysed using a spectrophotometric method based on rapid condensation of 4-aminoantipyrine with phenol in the presence of potassium ferricyanide, to form a coloured product under alkaline conditions (Bandhyopadhyay et al., 2001). The absorbance was read at a 510 nm wavelength using Shimadzu UV-VIS 1240 spectrophotometer.
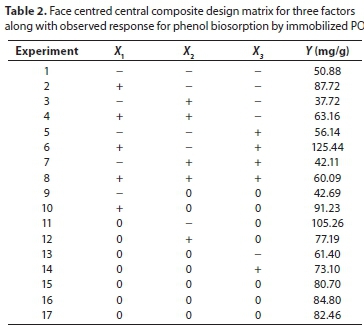
Experimental design
A three factor, face centred, central composite design (FC-CCD) was applied to investigate the influence of the effective factors (initial phenol concentration (X1), biosorbent dosage (X2) and composite beads to solution ratio (X3)) on the biosorption capacity. CCD is one of the frequently used response surface methodology (RSM) designs (Aksoy and Sagol, 2016); this method helps to optimize the considered parameters using a minimum number of experiments, and also to examine the effect of individual and interactions of input parameters (Mukherjee et al., 2018). A total of 16 experiments were used, including 8 (23) factorial points, 6 (2 x 3) axial points and one triplicate at the centre point. For statistical calculations, the highest, lowest and central values of the independent variables were coded as +1, -1 and 0, respectively, according to the following relationship:

where x0 is the value at the centre point and Δx represents the step change. The low and high levels for the factors were selected according to some preliminary experiments. The variables and levels of the design model are given in Table 1.
The JMP release 8 software was used for generating the statistical experimental design and analysing the observed data.
RESULTS AND DISCUSSION
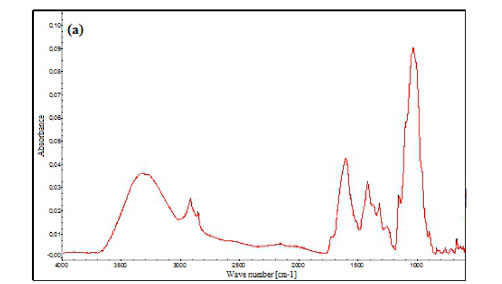
FTIR analysis
FTIR spectra in the range of 4 000-500 cm-1 for the PO dead leaves before and after pre-treatment are shown in Fig. 2a and 2b, respectively. Clear differences can be detected in the FTIR spectra corresponding to the different absorbance values, location and shapes of the bands. It was previously reported that PO dead leaves are mainly composed of lignin and cellulose (Cengiz et al., 2012). The FTIR spectrum of untreated PO dead leaves in Fig. 2a indicates the presence of a broad and strong band at 3 334 cm-1 representing stretching vibration of O-H in hydroxyl groups, and well-defined peaks at 2 918 and 2 851 cm-1, which are characteristic of the C-H bond stretch vibration (Fortunati et al., 2015). The peaks at 1 604 and 1 420 cm-1 are assigned to C-C stretching vibrations in the aromatic ring present in lignin (Zhang et al., 2016; Shamsuddin et al., 2016). The observed bands at 1 320 and 1 261 cm-1 are assigned to C-O vibration in methoxy groups present in lignin (Benyoucef and Harrache, 2015), while the signal at 1 155 cm-1 is assigned to C-C ring stretching band (Fortunati et al., 2015). The strong band at 1 034 cm-1 confirmed the C-O-C functional group of the cellulose and lignin structures (Guo et al., 2014), and the signal at 898 cm-1 is assigned to C-H deformation of cellulose (Benyoucef and Harrache, 2015), while the peak at 663 cm-1 is due to -NH2 wagging vibration peak (Soni et al., 2017). The spectrum of the treated PO dead leaves shown in Fig. 2b is different from that of the raw material. It was observed that there is a decrease in the intensity of the O-H absorption band at 3 334 cm-1, which then shifted to a higher wave number at 3 392 cm-1. A similar trend may be observed for the next pair of peaks (from 2 918 and 2 851 cm-1 to 2 988 and 2 902 cm-1) attributed to CH2 group vibration. The peak at 1 588 cm-1 is attributed to C=C stretching vibration. Elimination of peaks at 1 604, 1 420, 1 320, 1 260, 1 155 and 1 034 cm-1 indicates the alteration of lignin structure after the treatment. However, introduction of a new peak at 1 698 cm-1 (stretching vibration of C=O in carbonyl groups) indicates the formation of carbonyl-containing groups and the carbonization of the PO dead leaves (Aravindhan et al., 2009). It should also be underlined that the signals at 2 548 cm-1 (S-H stretching vibration), 1 394 and 1 149 cm-1 (C=S stretching vibration) and 1 123 cm-1 (S=O stretching vibration) appeared after sulfuric acid modification proved impregnation of sulfur functional groups on the biosorbent surface. In the low frequency region of the spectrum, very weak bands between 877 and 743 cm-1 could be due to Liaison Csp2-H/ N-H.
Experimental results
The design matrix of all the factors and the response of each run are presented in Table 2. The order in which the experiments were conducted was randomized to avoid systematic errors. The results were analysed and the main effects and interactions between factors determined. The main effects represent deviations of the average between the high and low levels for each factor. The adsorption capacity of phenol on PO biosorbent immobilized in calcium alginate beads was analysed using the second-order polynomial quadratic regression model equation as follows:
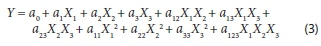
where Y is the predicted response, XpX2 and X3 are the independent variables; is the intercept term; aÝand are the linear coefficients, a a and are the second-order coefficients; a , and are the quadratic coefficients and a represents the interacting effect of all three variables.
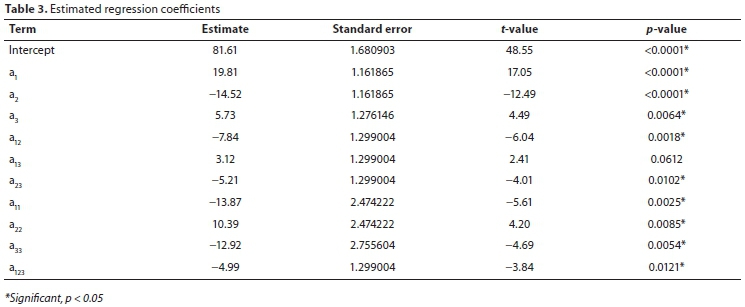
The values of regression coefficients, standard errors, f-values, and p-values appear in Table 3. By substituting the regression coefficients in Eq. 3 by their values from Table 3, the adsorption capacity (Y) can be expressed as:
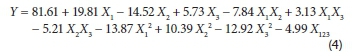
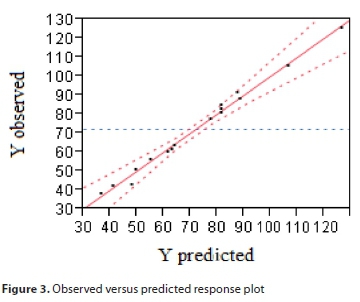
Figure 3 illustrates a comparison between the experimental and the model prediction for the response. The predicted model presents an adjusted square correlation coefficient R2 (adj) of 97.7%; this value indicates a high degree of correlation between the experimental and the predicted values.
Student's f-test
A student's f-test was carried out to determine whether the calculated effects were significantly different from zero. With a 95% confidence level and 6 degrees of freedom, the value of f-critic is equal to 2.447. The coefficient of the regression is statistically significant if the corresponding f-value is higher than 2.447. The results indicated in Table 3 revealed that the main effects (X1, X2and X3), the 2-way interactive effects (X1X2 and X2X3), the 3-way interactive effect (X1X2X3) as well as the quadratic effects (X12, X22 and X32) were significant at the 95% confidence level. Only the 2-way interaction (X1X3) has no effect at the 95% confidence level.
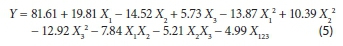
Since the coefficient a is negligible, the final model for the adsorption capacity in equilibrium becomes:
Main and interaction effects
Equation 5 reveals how the individual and quadratic variables or the double and triple interactions affected the biosorption capacity of phenol on PO immobilized in calcium alginate beads. The positive coefficient values mean that individual, quadratic or interactions positively affect the response (i.e. phenol biosorption capacity increases), whereas negative coefficient values mean that factors decrease phenol biosorption capacity in the tested range.
Effect of initial phenol concentration (X1)
The effect of variation in initial phenol concentration variation was found to be prominent for phenol biosorption capacity, since its coefficient was the higher in modulus. The positive value of its coefficient reveals that Y increases as this factor changes from low to high levels. Fig. 4a shows the change in the equilibrium biosorption capacity with initial phenol concentration. It was indicated that Qe values increase with increasing initial phenol concentrations. Aravindhan et al. (2009) studied the biosorption of phenol by modified green macro-algae: the effect of initial phenol concentration was investigated in the range of 10-150 mg/L and they found that equilibrium sorption capacity increased with increasing initial phenol concentration. Soni et al. (2017) have explained that increased phenol concentrations provide the maximum driving force to overcome all of the mass transfer resistances of phenol from the aqueous phase to the solid phase, resulting in a higher probability of collision between phenol and the active sites.
Effect of biosorbent dosage (X2)
Biosorbent dosage was also an important factor which negatively influenced the response since biosorption capacity was higher at low biosorbent values. Increasing the dose of biosorbent from 0.05 to 1 g decreased the capacity for biosorption (Fig. 4b). This can be attributed to the overcrowding of biosorbent particles which causes aggregation of the adsorption sites (Nadavala et al., 2014). Cengiz et al. (2012) also observed that the adsorption capacity for Astrazon Red on PO dead leaves increased with decreasing biomass concentration.
Effect of composite beads to solution ratio (X3)
The composite beads to solution ratio has a positive effect and was found to be the least important independent variable as its coefficient was the lowest, which reveals a modest increase of biosorption capacity when this variable adopts higher values within the range tested (Fig. 4c). This may be the result of a decrease in particle aggregation when the biosorbent is immobilized in a greater volume of alginate gel.
Response surface plots
Response surface plots were constructed to gain a better understanding of the effects of the independent variables and their interactions on the response in three-dimensional planes. This was done by varying two variables within the experimental range and holding the third one constant at its central level. Figure 4 shows the response surface plots for phenol biosorption capacity as a function of the three studied variables. The effects of initial phenol concentration (X1), biosorbent dosage (X2) and their mutual interaction (X1X2) on the response (Y) are shown in Fig. 4a. The positive effect of the initial phenol concentration is well represented since the response increases when X1increases, irrespective of the level of the second factor X2. This figure also illustrates the negative effect of biosorbent dosage as the response decreases when X2increases, both at low and high phenol concentrations. Note that the effect of initial phenol concentration is stronger with lower biosorbent dosage, reflecting the interaction between X1 and X2. Fig. 4b depicts the combined effect of biosorbent dosage (X2) and composite beads to solution ratio (X3) on phenol biosorption capacity (Y). As can be seen, high biosorbent dosage resulted in low phenol biosorption capacity. Also, increasing the factor X3 affected the response positively, but this effect seems to vary depending on the levels of X2. Indeed, the effect of X3 is stronger at low levels of X2, reflecting the interaction between these two factors. The positive effects ofinitial phenol concentration (X1) and composite beads to solution ratio (X3) on phenol biosorption capacity (Y) are also represented on Fig. 4c since the response increases when factor X1 or X3 increases. However, the effect of factor X1 on the response is the same regardless of the level taken for factor X3. In the same way, the change in response as a function of the factor X3 is the same irrespective of the level of the factor X1. Therefore, there is no interaction between factors X1and X3.
Analysis of variance (ANOVA)
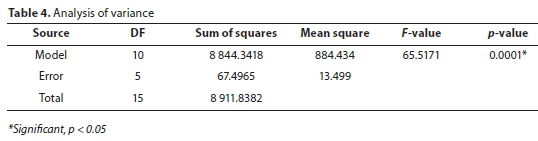
Table 4 shows the results as evaluated by the analysis of variance, for a 95% confidence level, 10 and 5 degrees of freedom, F 5005is equal to 4.735. The F-value obtained (65.52) was higher than the tabulated value and the estimated p-value (0.0001) is less than 0.05. These results indicate a good adherence of the model to the experimental results at the 95% confidence level.
Optimization
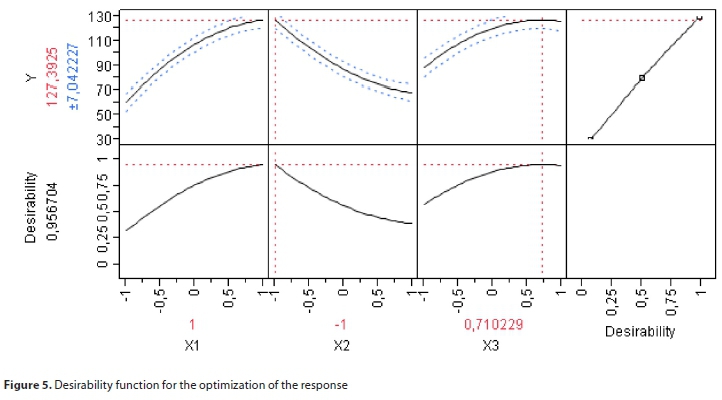
The desirability function approach is currently the recommended method for the optimization of one or more responses (Mourabet et al., 2012). Desirability (D) is an objective function that ranges from zero outside of the limits, to 1 at the goal. The possible goals were: to maximize, minimize or target. When a response is to be maximized, the desirability of a predicted response (y) is defined as (Candioti et al., 2014):
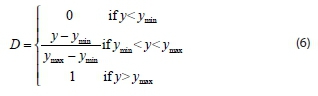
where ymin and ymax are, respectively, the minimum and maximum values of the response. As shown in Fig. 5, the desirability function increases linearly with the increase in phenol biosorption capacity. The maximum desirability (0.957), which corresponds to the best results (127 mg/g), was achieved at the higher level of the initial phenol concentration (500 mg/L), at the lower biosorbent dosage (0.05 g), and at composite beads to solution ratio of 1.855/10.
CONCLUSION
In this study, dead leaves of Posidonia oceânica were pre-treated and immobilized in calcium alginate beads and used for the biosorption of phenol from aqueous solution. The biosorption studies were carried out as a function of initial phenol concentration (X1), bioadsorbent dosage (X2), and composite beads to solution ratio (X3). Utilization of RSM-based CCD approach for evaluating and optimizing the independent variables proved to be an efficient and effective method. The developed model allowed for an evaluation of linear and quadratic effects of analysed factors, as well as significant interactions between these factors. The correlation coefficient R2 of 0.97 indicates a high degree of the model. The most significant factor which affected the biosorption capacity was the initial phenol concentration with the lowest p-value and the largest i-value. All of the studied factors influence the biosorption and were statistically significant. It has been shown that an increase in phenol concentration and composite beads to solution ratio coupled with lower biosorbent dosage resulted in higher biosorption capacity. At the optimum conditions, i.e., phenol concentration of 500 mg/L, biosorbent dosage of 1 g/L and composite beads to solution ratio of 1.85/10, the predicted biosorption capacity was about 127 mg/g.
REFERENCES
AKSOY DO and SAGOL E (2016) Application ofcentral composite design method to coal flotation: Modelling, optimization and verification. Fuel 183 609-616. https://doi.org/10.1016/j.fuel.2016.06.111 [ Links ]
ARAVINDHAN R, RAO JR and NAIR BU (2009) Application of a chemically modified green macro alga as a biosorbent for phenol removal. J. Environ. Manage. 90 1877-1883. https://doi.org/10.1016/j.jenvman.2008.12.005 [ Links ]
ARINJAY K, SHASHI K and SURENDRA K (2005) Biodegradation kinetics of phenol and catechol using Pseudomonas putida MTCC 1194. Biochem. Eng. J. 22 151-159. https://doi.org/10.1016/j.bej.2004.09.006 [ Links ]
BANDHYOPADHYAY K, DAS D, BHATTACHARYYA P and MAITI BR (2001) Reaction engineering studies on biodegradation of phenol by Pseudomonas pufida MTCC 1194 immobilized on calcium alginate. Biochem. Eng. J. 8 179-186. https://doi.org/10.1016/S1369-703X(01)00101-2 [ Links ]
BENYOUCEF S and HARRACHE DJ (2015) Microstructure characterization of scots pine Pinus sylvestris sawdust. J. Mater. Environ. Sci. 6 765-772. [ Links ]
CANDIOTI LV, DE ZAN MM, CÁMARA MS and GOICOECHEA HC (2014) Experimental design and multiple response optimization. Using the desirability function in analytical methods development. Talanta 124 123-138. https://doi.org/10.1016/j.talanta.2014.01.034 [ Links ]
CAVAS L, KARABAY Z, ALYURUK H, DOGAN H and DEMIR GK (2011) Thomas and artificial neural network models for the fixed-bed adsorption of methylene blue by a beach waste Posidonia oceanica (L.) dead leaves. Chem. Eng. J. 171 557-562. https://doi.org/10.1016/j.cej.2011.04.030 [ Links ]
CENGIZ S, TANRIKULU F and AKSU S (2012) An alternative source of adsorbent for the removal of dyes from textile waters: Posidonia oceanica (L.). Chem. Eng. J. 189 32- 40. https://doi.org/10.1016/j.cej.2012.02.015 [ Links ]
COLETTI A, VALERIO A and VISMARA E (2013) Posidonia oceanica as a renewable ligno cellulosic biomass for the synthesis of cellulose acetate and glycidyl methacrylate grafted. Cellulose 6 2043-2058. https://doi.org/10.3390/ma6052043 [ Links ]
COPELLO GJ, VARELA F, MARTÍNEZ VIVOT R and DÍAZ LE (2008) Immobilized chitosan as biosorbent for the removal of Cd(II), Cr(III) and Cr(VI) from aqueous solutions. Bioresour. Technol. 99 6538-6544. https://doi.org/10.1016/j.biortech.2007.11.055 [ Links ]
DOTTO GL, COSTA JAV and PINTO LAA (2013) Kinetic studies on the biosorption of phenol by nanoparticles from Spirulina sp. LEB 18. J. Environ. Chem. Eng. 1 1137-1143. https://doi.org/10.1016/j.jece.2013.08.029 [ Links ]
FORTUNATI E, LUZI F, PUGLIA D, PETRUCCI R, KENNY JM and TORRE L (2015) Processing of PLA nanocomposites with cellulose nanocrystals extracted from Posidonia oceanica waste: Innovative reuse of coastal plant. Ind. Crops Prod. 67 439-447. https://doi.org/10.1016/j.indcrop.2015.01.075 [ Links ]
GUO JZ, LI B, LIU L and LV K (2014) Removal of methylene blue from aqueous solutions by chemically modified bamboo. Chemosphere 111 225-231. https://doi.org/10.1016/j.chemosphere.2014.03.118 [ Links ]
HANK D, AZI Z, AIT HOCINE S, CHAALAL O and HELLAL A (2014) Optimization of phenol adsorption onto bentonite by factorial design methodology. J. Ind. Eng. Chem. 20 2256-2263. https://doi.org/10.1016/j.jiec.2013.09.058 [ Links ]
HUSSAIN A, DUBEY SK and KUMAR V (2015) Kinetic study for aerobic treatment of phenolic wastewater. Water Resour. Indus. 11 81-90. https://doi.org/10.1016/j.wri.2015.05.002 [ Links ]
KARRI RR, JAYAKUMAR NS and SAHU JN (2017) Modelling of fluidised-bed reactor by differential evolution optimization for phenol removal using coconut shells based activated carbon. J. Mol. Liq. 231 249-262. https://doi.org/10.1016/j.molliq.2017.02.003 [ Links ]
KAZEMI P, PEYDAYESH M, BANDEGI A, MOHAMMADI T and BAKHTIARI O (2014) Stability and extraction study of phenolic wastewater treatment by supported liquid membrane using tributylphosphate and sesame oil as liquid membrane. Chem. Eng. Res. Des. 92 375-383. https://doi.org/10.1016/j.cherd.2013.07.023 [ Links ]
KHIARI R, MHENNI MF, BELGACEM MN and MAURET E (2010) Chemical composition and pulping of date palm rachis and Posidoni aoceanica - a comparison with other wood and non-wood fibre sources. Bioresour. Technol. 101 775-780. https://doi.org/10.1016/j.biortech.2009.08.079 [ Links ]
KUMAR R, BHATIA D, SINGH R, RANI S and BISHNOI NR (2011) Sorption of heavy metals from electroplating effluent using immobilized biomass Trichoderma viride in a continuous packed-bed column. Int. Biodeterior. Biodegrad. 65 1133-1139. https://doi.org/10.1016/j.ibiod.2011.09.003 [ Links ]
LAZLI W, HANK D, ZEBOUDJ S, NAMANE A, and HELLAL A (2016) Application of factorial experimental design methodology for the removal of phenol from water by innovate hybrid bioprocess. Desalin. Water Treat. 57 6044-6050. https://doi.org/10.1080/19443994.2015.1004112 [ Links ]
LOH C.H., ZHANG Y, GOH S, WANG R and FANE AG (2016) Composite hollow fiber membranes with different poly (dimethylsiloxane) intrusions into substrate for phenol removal via extractive membrane bioreactor. J. Membr. Sci. 500 236-244. https://doi.org/10.1016/j.memsci.2015.12.001 [ Links ]
MOURABET M, EL RHILASSI A, EL BOUJAADY H, BENNANI-ZIATNI M, EL HAMRI R and TAITAI A (2012) Removal of fluoride from aqueous solution by adsorption on Apatitic tricalcium phosphate using Box-Behnken design and desirability function. Appl. Surf. Sci. 258 4402-4410. https://doi.org/10.1016/j.apsusc.2011.12.125 [ Links ]
MUKHERJEE A, BANERJEE S and HALDER G (2018) Parametric optimization of delignification of rice straw through central composite design approach towards application in grafting. J. Adv. Res. 14 11-23. https://doi.org/10.1016/j.jare.2018.05.004 [ Links ]
NADAVALA SK, MAN HC and WOO H-S (2014) Biosorption of phenolic compounds from aqueous solutions using pine (Pinus densiflora sieb) bark powder. Bioresources 9 (3) 5155-5174. https://doi.org/10.15376/biores.9.3.5155-5174 [ Links ]
NOWEE SM, TAHERIAN M, SALIMI M and MOUSAVI SM (2017) Modeling and simulation of phenol removal from wastewater using a membrane contactor as a bioreactor. Appl. Math. Model. 42 300314. https://doi.org/10.1016/j.apm.2016.10.027 [ Links ]
PIGATTO G, LODI A, FINOCCHIO E, PALMA MSA and CONVERTI A (2013) Chitin as biosorbent for phenol removal from aqueous solution: Equilibrium, kinetic and thermodynamic studies. Chem. Eng. Process. 70 131-139. https://doi.org/10.1016/jxep.2013.04.009 [ Links ]
RANGABHASHIYAM S, ANU N, GIRI NANDAGOPAL MS and SELVARAJU N (2014) Relevance of isotherm models in biosorption of pollutants by agricultural byproducts. J. Environ. Chem. Eng. 2 398-414. https://doi.org/10.1016/j.jece.2014.01.014 [ Links ]
RAZZAGHI M, KARIMI A, ANSARI Z and AGHDASINIA H (2018) Phenol removal by HRP/GOx/ZSM-5 from aqueous solution: Artificial neural network simulation and genetic algorithms optimization. J. Taiwan Inst. Chem. Eng. 89 1-14. https://doi.org/10.1016/j.jtice.2018.03.040 [ Links ]
ROMERO-CANO LA, GONZALEZ-GUTIERREZ LV and BALDENEGRO-PEREZ LA (2016) Biosorbents prepared from orange peels using instant controlled pressure drop for Cu(II) and phenol removal. Ind. Crops Prod. 84 344-349. https://doi.org/10.1016/j.indcrop.2016.02.027 [ Links ]
SALIM NE, JAAFAR J, ISMAIL AF, OTHMAN MHD, RAHMAN MA, YUSOF N, QTAISHAT M, MATSUURA T, AZIZ F and SALLEH WNW (2018) Preparation and characterization of hydrophilic surface modifier macromolecule modified poly (ether sulfone) photocatalytic membrane for phenol removal. Chem. Eng. J. 335 236-247. https://doi.org/10.1016/jxej.2017.10.147 [ Links ]
SHAMSUDDIN MS, YUSOFF NRN and SULAIMAN MA (2016) Synthesis and characterization of activated carbon produced from enaf core fiber using H3PO4 activation. Procedia Chem. 19 558-565. https://doi.org/10.1016/j.proche.2016.03.053 [ Links ]
SONI U, BAJPAI J, SINGH SK and BAJPAI AK (2017) Evaluation of chitosan-carbon based biocomposite for efficient removal of phenols from aqueous solutions. J. Water Process Eng. 16 56-63. https://doi.org/10.1016/j.jwpe.2016.12.004 [ Links ]
TRAN VS, NGO HH, GUO W, ZHANG J, LIANG S, TON-THAT C and ZHANG X (2015) Typical low cost biosorbents for adsorptive removal of specific organic pollutants from water. Bioresour. Technol. 182 353-363. https://doi.org/10.1016/j.biortech.2015.02.003 [ Links ]
TZIOTZIOS G, ECONOMOU CN, LYBERATOS G and VAYENAS DV (2007) Effect of the specific surface area and operating mode on biological phenol removal using packed bed reactors. Desalination 211 128-137. https://doi.org/10.1016/j.desal.2006.02.087 [ Links ]
VAIANOA V, MATARANGOLO M, MURCIA JJ, ROJAS H, NAVÍO JA and HIDALGO MC (2018) Enhanced photocatalytic removal of phenol from aqueous solutions using ZnO modified with Ag. Appl. Catal. B-Environ. 225 197-206. https://doi.org/10.1016/j.apcatb.2017.11.075 [ Links ]
VÍCTOR-ORTEGA MD, OCHANDO-PULIDO JM and MARTÍNEZ-FÉREZ A (2016) Phenols removal from industrial effluents through novel polymeric resins: Kinetics and equilibrium studies. Sep. Purif. Technol. 160 136-144. https://doi.org/10.1016Zj.seppur.2016.01.023 [ Links ]
WANG H, GUAN Q, LI J and WANG T (2014) Phenolic wastewater treatment by an electrocatalytic membrane reactor. Catal. Today 236 121-126. https://doi.org/10.1016Ai.cattod.2014.05.003 [ Links ]
ZHANG S, WANG Z, ZHANG Y, PAN H and TAO L (2016) Adsorption of methylene blue on organosolv lignin from rice straw. Procedia Environ. Sci. 31 3-11. https://doi.org/10.1016/j.proenv.2016.02.001 [ Links ]
ZHOU L, HU J, ZHONG H and LI X (2012) Study of phenol removal using fluidized-bed Fenton process. Chem. Eng. Res. Des. 90 377382. https://doi.org/10.1016/jxherd.2011.07.015 [ Links ]
 Correspondence:
Amina Hellal
E-mail: amina.hellal@g.enp.edu.dz
Received: 3 September 2018
Accepted: 30 March 2020

