


Serviços Personalizados
Artigo
 Inglês (pdf)
 Artigo em XML
 Referências do artigo
Indicadores

Links relacionados
-
 Citado por Google
 -
 Similares em Google
Compartilhar

 Permalink
Water SA
versão On-line ISSN 1816-7950
versão impressa ISSN 0378-4738
Water SA vol.46 no.2 Pretoria Abr. 2020
http://dx.doi.org/10.17159/wsa/2020.v46.i2.8242
RESEARCH PAPER
Challenges and shortcomings in current South African industrial wastewater quality characterisation
Genevieve Harding; Jemitias Chivavava; Alison E Lewis
Crystallization and Precipitation Unit, Department of Chemical Engineering, University of Cape Town, South Africa
ABSTRACT
Previous research in South Africa has identified gaps in wastewater quality characterisation and remediation. Wastewater quality indicators need to be known in order to reuse, recycle, and/or recover resources, but are poorly reported for wastewater streams. Formal and relational approaches were used to access wastewater quality information. Relational approaches included building relationships with industry partners through telephone calls, emails and meetings, while formal approaches included requests for public documents and legal applications using the Promotion of Access to Information Act. Published data were another source of information. The following industries were identified as major wastewater generating industries: pulp and paper, fish processing, power generation, mining and petroleum. Seven parameters were commonly used to indicate quality: pH, volume, electrical conductivity, nitrogen, sulphate, sodium and chemical oxygen demand. Calcium was not measured, even though discharge limits are required in environmental licenses. The accessed wastewater quality data ranged from qualitative to quantitative. The number of parameters used varied within and between industries. Although wastewater information is non-confidential, in practice it is not readily available. There are opportunities to improve wastewater management and resource recovery; however, this needs to happen in an environment of trust and transparency. This is currently lacking between industry, government, and research bodies.
Keywords: access to information, industrial wastewater, characterisation, Promotion of Access to, Information Act, South Africa, water quality
INTRODUCTION
In a country such as South Africa, with increasing water scarcity, it is important to consider wastewaters as a resource rather than a waste. However, in order to reuse, recycle or recover this water it needs to be treated, and treatment design requires information indicating wastewater quality. It is also important that research institutions are able to access such information in order to develop treatment technologies that are locally relevant.
Previous research in South Africa has highlighted gaps in wastewater quality data and remediation of wastewaters (Claasen and Masangane, 2015). These gaps are compounded by the fact that data regarding wastewater are often poorly reported, are considered sensitive/confidential and are not readily accessible in the public domain (Cloete et al., 2010).
While wastewaters are often considered as waste streams, they are also a potential resource. The value in wastewater is in the form of water, salts, minerals, metals and/or energy. Wastewater quality information is required to assess treatability, whilst suitable treatment technologies are required to recover resources.
Global perspective
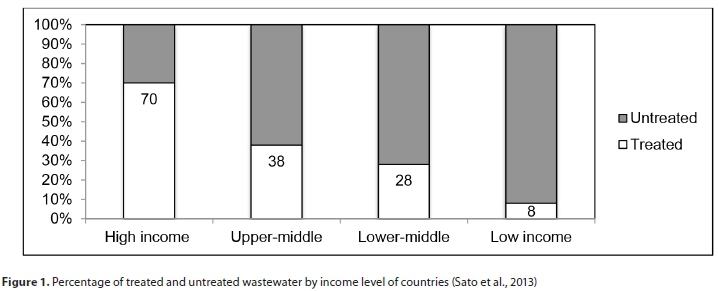
Globally, over 80% of wastewater is released into the environment untreated (WWAP, 2017). Figure 1 shows that 70% of municipal and industrial wastewater is treated in high-income countries; 38% in upper-middle income; 28% in lower-middle income; and only 8% is treated in low-income countries (Sato et al., 2013). Water quality is projected to worsen over the next decade (WWAP, 2017).
In water-stressed countries, there is a trend to approach this as a challenge of water supply, rather than as a challenge ofwastewater management. However, water supply and wastewater management are connected (WWAP, 2017). Wastewater is perceived as a burden and is underexploited as an affordable, sustainable resource (WWAP, 2017). Wastewater management is an opportunity to recover water and other resources, but this needs to be informed by water quality analysis.
Benefits and co-benefits of wastewater treatment
Wastewater use and by-product recovery present new business opportunities in a world that is moving toward circular economies. Considering the business case for wastewater, recovered resources contribute to covering the cost of new or retrofitted infrastructure (Irina Bokova in WWAP, 2017). Still, wastewater is perceived to be a burden and is underexploited as a potential resource (WWAP, 2017). In addition to recoverable resources, a number of co-benefits ofwastewater treatment exist. These include (WWAP, 2017):
• Improvements to human health
• Greater gender equity (because women and girls are mainly responsible for collecting water (UNICEF/WHO, 2011), and are disproportionately exposed to health risks associated with poor quality water (Moriarty et al., 2004))
• Improved environmental health
• Increased water security
• Increased food security (if appropriately treated wastewater can be used to supplement and/or replace water for agriculture)
• Increased energy security (if appropriately treated wastewater can be used to supplement and/or replace water for power generation)
• Improved climate change mitigation capabilities (wastewater management can help bridge the gap between water supply and demand in a future where climate change projections predict increasing discrepancies)
• Improved livelihoods
The above suggests that considering the intersection of global challenges, wastewater management will need to be part of an integrated solution. For example, Hutton and Haller (2004) (in WWAP, 2017) suggest that a 1 USD investment in sanitation can return 5.5 USD worth of benefits. These benefits include saving time (with better access to water and sanitation facilities), gain in productive time and less time ill, saving in health treatment costs of serving sick patients, and value through prevented deaths (Hutton and Haller, 2004).
Data and governance
Wastewater can be a valuable resource, but it is necessary to underpin this with data. Reliable data can benefit both public and private sectors, with economic and environmental benefits (UN-Water, 2016a in WWAP, 2017). Appropriate data can inform technology development, governance, activism, regulations and monitoring.
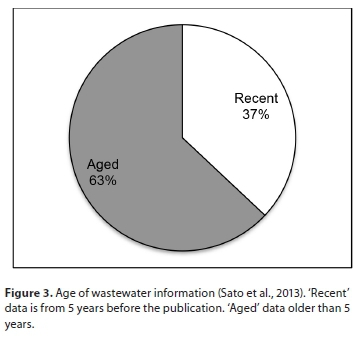
Data on wastewater volumes, quality, collection and treatment is insufficient globally, particularly so in developing countries. Sato et al. (2013) studied data from 181 countries, on three aspects of wastewater: generation, treatment and use. They found that 55 countries (30%) had reliable data on all three aspects; 69 countries (38%) had data on one or two aspects, while the other 57 countries had no data (32%). This is illustrated in Fig. 2. Furthermore, only 37% of data was reported within 5 years preceding the publication (Fig. 3).

Wastewater in Africa
Many factors contribute to an increasing gap between water availability and demand in Africa. These include political, financial, infrastructural and human resource challenges (WWAP, 2017). This is projected to worsen as urban populations grow (World Bank, 2012). Competing water users, as well as ongoing wastewater quality issues, compound struggles of water availability.
It is already noted that data on wastewater are unavailable, particularly in the Global South. 32 of 48 Sub-Saharan African countries had no data available on wastewater treatment and generation (Sato et al., 2013). Notable exceptions were Senegal, Seychelles and South Africa, where information on all three aspects of wastewater generation, treatment, and use were available. However, the information for Seychelles and South Africa dated to 2000 and 2003, respectively (Sato et al., 2013).
Data describing wastewater quality were not reported
Wastewater quality is important. Only after the hurdle of wastewater quality characterisation has been overcome can it be assessed for treatability. Wastewaters need to be analysed before treatment for resource recovery or safe, compliant disposal.
This research attempted to determine the status of wastewater quality data and reporting by South African industries. The research question was: What are the norms of South African industrial wastewater characterisation? This question was asking how comprehensive, consistent, accurate and accessible wastewater quality characterisation data are across a number of South African industries.
Local perspective of wastewater in South Africa
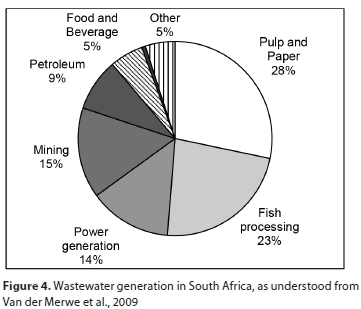
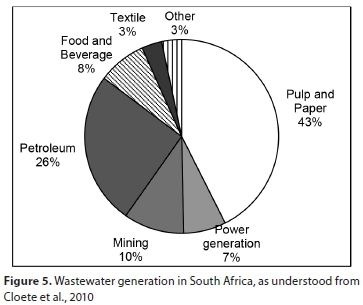
Two previous Water Research Commission (WRC) projects compiled databases and reports examining water use and wastewater generation by sector in South Africa. A distribution of wastewater generation by sector, as determined by each of the studies, is shown in Fig. 4 (by Van der Merwe et al., 2009) and Fig. 5 (by Cloete et al., 2010). Van der Merwe et al. (2009) reported a total wastewater volume of 962 000 kL/day, which is approximately 350 Mm3/annum, while Cloete et al. (2010) report 69 Mm3/annum. This is one-fifth (1/5th) of the total reported by Van der Merwe et al. (2009).
Van der Merwe et al. (2009) surveyed 268 companies, with 185 positive responses (69%), from a range of industries. They found that some organisations lacked data or were unwilling to release data for commercial and other sensitivities.
Cloete et al. (2010) approached metropolitan councils and regional offices of the then Department of Water Affairs and Forestry to identify major water users. Thereafter, specific organisations were contacted, and additional information requested. The information differed from source to source, which they attributed to limited monitoring and reluctance from both public and private bodies to release sensitive information. They noted that wastewater generation data were frequently unavailable or incomplete.
Nonetheless, in both cases, the pulp and paper industry was identified as the biggest contributor to wastewater generation. Power generation, mining, and petroleum industries were also major contributors. The food and beverage industry contributed greater than 5% in each case; however it encompasses many subindustries. The textile industry contributes a small portion in each case. 'Other' includes chemicals, pharmaceuticals, cement, metals processing, paint, plastics, tanneries, and waste management.
Van der Merwe et al. (2009) also identified the fish processing industry as a major contributor. Cloete et al. (2010) included fisheries in their 'food and beverage' category, but it was not a significant contributor.
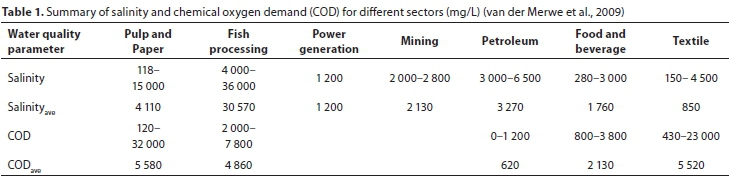
Furthermore, the volume of wastewater originating from any particular industry does not necessarily correlate with the potential hazard (or resource) associated with that wastewater. In order to assess the potential hazard and/or value contained in a wastewater, comprehensive water quality assessment is required. The database developed by Van der Merwe et al. (2009) captured basic composition information of salinity and COD, given in Table 1.
Salinity indicates the total dissolved salts in the wastewater stream. However, it does not indicate the specific species that contribute to the salinity or any other dissolved metals/solids. Knowing the species distribution provides critical insight into the selection and evaluation of treatment schemes. Chemical analysis provides insight into the potential value in the wastewater.
Chemical oxygen demand (COD) partially indicates the organic content of the stream. Biological treatments can be used to address such contaminants and recover energy. However certain inorganic components, or other species, may adversely affect the functioning of such biological treatments, and once again chemical analysis can provide critical insight into the choice of treatment schemes.
Wastewater quality analysis
Testing water quality provides insight into its physical, chemical, biological and microbial make-up. Physical parameters include pH and sediment loading; chemical parameters indicate the salinity of water; biological parameters refer to organic nutrients; and microbial parameters indicate microorganisms. Cloete et al. (2010) noted the increasing importance of metals, manufactured organic components (herbicides, pesticides) and microbial contamination.
Cloete et al. (2010) and Van der Merwe et al. (2009) found that there was a wide variation in the water quality information available, which ranged from partial and broad, to comprehensive and specific. Private companies monitor wastewater quality in terms of major parameters and components specified in their environmental licences. Detailed analysis is necessary when considering treatment or possible reuse, but is more expensive.
Legal framework in South Africa
Private and governmental bodies monitor water quality. Citizens and institutions may want to access this information for research and development purposes. It was necessary to understand the legal framework around the environment and accessing information in South Africa.
Constitution and Bill of Rights
The Constitution of the Republic of South Africa, Act 108 of 1996 (RSA, 1996), is a founding document of South Africa's democracy. Section 24, in Chapter 2 ofthe Constitution, explains one's right to the environment. Every person, now and in the future, has the right 'to an environment that is not harmful to their health or well-being', which is protected such that pollution is limited, conservation is promoted, and development is sustainable. Section 32, in Chapter 2 of the Constitution, explains one's right to access information. Every person has the right to access information held by private or public (state) bodies if that information is required to protect any other right, and legislation is required to make this administratively and financially realisable.
Right to the Environment, section 28
The South African Constitution considers people to be at the centre of environmental management, where environmental conservation is for the betterment of society and their lives (DEA, 2017). The term 'environment' encompasses all surroundings (including land, water and the atmosphere) and all life within the vicinity (including microorganisms, plants and animals) that influence human health and well-being. 'Well-being' expands beyond health to also include aesthetics and cultural values (National Environmental Management Act, Act 107 of 1998; RSA, 1998).
Companies and individuals have responsibilities associated with this constitutional right. If an operation has, is, or could in the future, impact on the environment, then said operation has a responsibility to obtain authorisation and to avoid or minimise degradation to the environment (NEMA, s28, 1998). Authorisation for discharges to a coastal environment is given under Integrated Coastal Management Act (Act 24 of 2008; RSA, 2008). The authorisation comes in the form of a Coastal Water Discharge Permit (CWDP). Authorisation for water use, storage and discharge inland is regulated in Water Use Licenses (WULs). These are issued in accordance with the National Water Act (NWA), Act 36 of 1998 (RSA, 1998). Water Use Licences (WULs) are environmental permits for land-based wastewaters discharged to land-based environments. Compliance reports are annual documents submitted to the Department of Water and Sanitation (DWS) to demonstrate compliance or non-compliance with a WUL. Compliance reports are not automatically available and required a formal application.
Right of Access to Information, section 32
The Promotion of Access to Information Act (PAIA), Act No. 2 of 2000 (RSA, 2000), gives effect to the constitutional right in s32 of the Constitution. Section 31 (a) in NEMA describes what environmental information should be available:
Every person is entitled to have access to information held by the State and organs of state ... including any emissions to water, air or soil and the production, handling, transportation, treatment, storage and disposal of hazardous waste and substances.
Emission levels and waste products are not considered commercially confidential and therefore are not protected by s31 (c) (iii) in NEMA, or s36 of PAIA, which requires mandatory protection of commercial information.
Every company and government department is required to publish and update a PAIA manual. The PAIA manual lists information that is automatically available, and information that must be formally requested. 'Automatically available' information requires that the information be requested from the information officer without completing an application form. A PAIA application for other information must be requested via a specific form with a small initial payment for administrative costs.
METHODS
A major component of this research entailed developing methods to access wastewater information in South Africa. The research aimed to collect data that would elucidate the nature of wastewater quality information in South Africa, i.e., what is the South African state of affairs with respect to wastewater quality characterisation and reporting in terms of comprehensiveness, accuracy, consistency and access to information?
Data were extracted from published, public and private sources. Published sources included WRC reports and journal papers. One approach to access public and private sources of information was based on building relationships with governmental, legal and industrial stakeholders through teleconferencing, emails, meetings and site visits. Formal, legal requests for information were made with application in terms of PAIA.
Accessing published data
An initial review of existing research, reports and databases informed the scope of the research. Published data were extracted from journal papers, WRC reports and similar. This provided a preliminary insight into key South African industries, the volumes of wastewaters generated by these industries and important physical, chemical and biological parameters measured in wastewaters.
Accessing data from the private and public sector
After examining published literature, it was necessary to contact industrial and governmental partners directly to collect the missing data. These partnerships generated a deeper level of insight since wastewater information was (is) considered sensitive. To access such data sources, effort plus resources were invested in establishing contacts, building relationships, building trust and agreeing on the terms of sharing data.
The first step in building a relationship was to establish contact. This was achieved through telephone calls or via email. After that, communication was continued via telephone calls, emails, Skype meetings, face-to-face meetings, and site visits.
Telephone interviews, site visits and/or meetings were semi-structured interviews, using a guideline questionnaire. These semi-structured interviews were designed to capture data on water use, wastewater generation and quality of the wastewater. Wastewater stream samples were not directly collected; rather secondary data were requested from companies. Information from the fish processing and power generation industries was accessed through relationships established in this way.
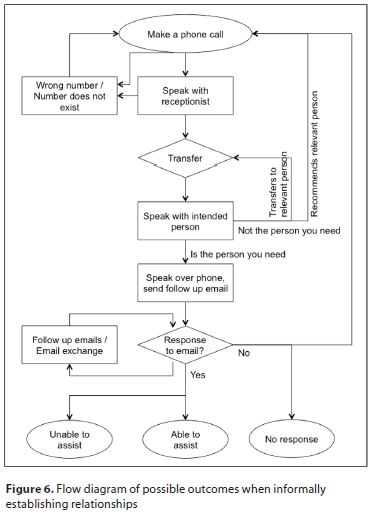
Figure 6 illustrates the informal route to requesting information. A total of 87 people from 42 companies or institutions were contacted. This includes major companies in identified industries, government officials and legal services. At least four companies in each industry were contacted, with the exception of Eskom in the power generation industry, where one major operator was contacted. Fourteen companies were contacted in the mining industry.
Formal approaches to access
The relational approach was not effective in all cases, especially when companies were concerned about the security of wastewater information. In these cases a legal approach was used to access wastewater quality data. The Promotion of Access to Information Act (PAIA) provided the framework for such legal request.
Two PAIA applications were submitted. The first to the Department of Environmental Affairs: Oceans and Coast (DEA: O&C), for access to all Coastal Water Discharge Permits issued. CWDPs are environmental permits, which authorise the discharge of inland wastewater to a marine environment. This information was not automatically available according to their PAIA manual, and needed to be formally requested with a PAIA application form.
CWDPs for several companies in the pulp and paper, fish processing and petroleum industries were received. PAIA applications to individual companies were not explored, as this would have drastically increased the number of applications and cost.
The second PAIA application was to the Department of Water and Sanitation (DWS) for Water Use Licences and associated compliance reports. WULs issued to pulp and paper, power generation, mining and petroleum were requested, together with the compliance reports received from these industries.
The PAIA applications took 2 and 3 months, respectively, from submitting the request to receiving documents. However, this was preceded with time establishing contacts in the relevant departments, determining the information officer, identifying the available documents and the information they contained. Because the PAIA process is a legal one, the request must be for specific records, from specified companies, over a specified period. The initial time invested in making a PAIA application was critical for a successful application.
The company name, description of the discharge, volume of discharge, parameters listed, limits for listed parameters, and actual measurements of parameters (where available) were captured in an Excel spreadsheet and analysed.
Sources of information
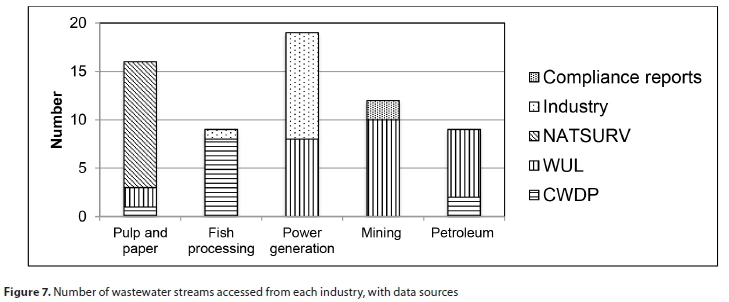
Figure 7 shows the number of wastewater streams reported within different sources of information. A total of 65 wastewater streams were reported in various source documents. Applications were submitted for WULs, compliance reports and CWDPs because of an assurance from the respective state entities that these documents contained relevant information.
The horizontal stripes in Fig. 7 show wastewater streams reported in CWDPs. Unsurprisingly, fish-processing wastewaters were largely reported in this type of document. This is because streams from the fish-processing industry were generally discharged to marine environments. One stream from the pulp and paper industry and two streams from the petroleum industry were reported in CWDPs. It was expected that the pulp and paper and petroleum industries would be represented in CWDPs since a portion of wastewater arising from both industries was discharged to marine environments (van der Merwe et al., 2009).
The vertical stripes show information sourced from WULs. It was unsurprising that these sources captured data from the power generation, mining and petroleum industries. This is because WULs apply to inland water use and discharge. All wastewaters from the power generation and mining industries were released inland, while the majority of wastewaters from petroleum were released inland.
The diagonal stripes show information from the NATSURV collection published by the WRC. Although the collection reported on a number of different industries, the second edition was incomplete at the time of writing, and therefore relevant information could only be sourced for the pulp and paper industry.
The loosely dotted blocks show information sourced directly from industry partners. There is one stream from the fish processing industry, and 10 from power generation.
Two streams in the mining industry were sourced from compliance reports submitted with WULs, illustrated with tightly dotted blocks.
The power generation industry was best represented in the data, with 19 streams reported in total across the various sources. Pulp and paper was also well represented, with 16 streams reported. Mining was represented in 12 streams. Fish processing and petroleum both had nine streams reported.
There are other possible sources of data that could have been, but were not, explored. Other sources such as municipal data on water use and wastewater could have been requested from municipalities, or PAIA applications could have been submitted directly to companies.
RESULTS AND DISCUSSION
Nature of wastewater quality data and reporting
Data mining in literature revealed four commonly listed parameters to measure wastewater quality. These were pH, total suspended solids (TSS), chemical oxygen demand (COD) and biochemical oxygen demand (BOD). Mining and power generation did not list BOD but placed importance on total dissolved solids (TDS) and ion concentrations.
A large number of parameters were captured across the studied source documents. Categories include:
• Stream details (such as volume, temperature)
• General parameters (such as pH, electrical conductivity, solids, salinity, acidity and alkalinity)
• Organic parameters (including, but not limited to, measurements of total organic carbon, COD, BOD, and soap, oil and grease)
• Biological and microbiological parameters (coliforms, faecal coliforms, E. coli)
• Nitrogen systems (including total nitrogen, total organic nitrogen, ammonia, nitrate and nitrite)
• Anions and cations
• Non-metals (including nitrogen, phosphorus, boron)
• Metals (trace, base)
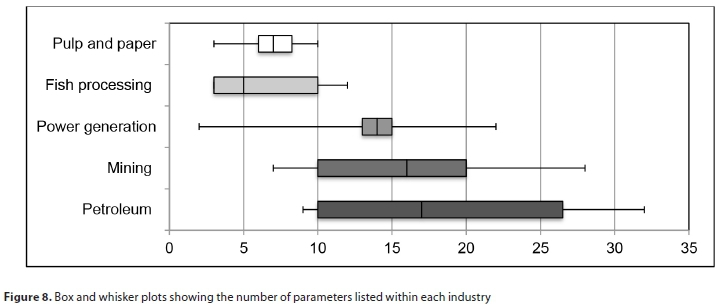
A range of parameters were recorded across the source documents. Figure 8 shows box and whisker plots of the number of parameters used to characterise wastewater quality in each industry. The 'box' represents the central 50% of the data, either side of the median. The 'whiskers' extend to the minimum and maximum number.
Each industry measures different parameters, and therefore a different number ofparameters. This depends on the components of interest in each industry, as well as their particular compliance requirements and the components listed therein.
Pulp and paper wastewater streams were reported with less than 10 parameters. This is related to the limited information in the NATSURV series. In the fish-processing industry 75% of the streams were reported with 10 or fewer parameters. Power generation measured between 2 and 22 parameters, with the bulk of the data about the median at 14. The mining industry listed between 7 and 28 parameters in WUL and compliance reports, with a median of 16. The petroleum industry had the largest range, highest maximum and highest minimum.
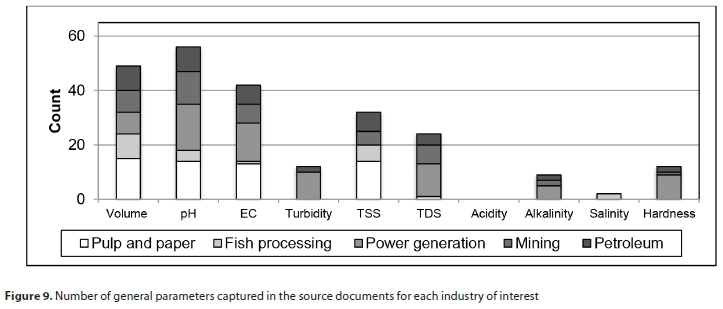
To further understand why there were differences in the number of measured and reported parameters, the identity of measured components was reviewed. This showed parameters that appeared to be important to each industry. Figure 9 is the first of five figures showing the parameters listed in CWDP, WUL, compliance reports and information obtained directly from industry. In each of the following five figures, the components are shown along the x-axis. The y-axis shows the number of times each parameter was listed in the sources studied. Each fraction of the total bar shows the count of how many times each parameter was listed for each industry, with a corresponding key in each figure. Each total bar shows the sum across the industries, and the total count that each parameter was measured across all sources studied.
Figure 9 shows stream details, general parameters and hardness information captured across the industries of interest. As an example of reading these graphs, in Fig. 9 volume was measured and reported for 15 wastewater streams in the pulp and paper industry, 9 in fish processing, 8 in power generation, 8 in mining, and 9 wastewater streams in the petroleum industry. Volume was measured in 49 cases across the documents studied.
The most commonly reported parameter was pH. It was recorded in 56 of 65 cases (86%). pH is a standard parameter indicating water quality. The next most commonly reported parameter was an indication of volume, listed in 49 cases (75%). The volume was listed as discharge volume per day, month or year, or specific wastewater volume per ton of product. Specific effluent volume was commonly used in the pulp and paper industry. Volume was frequently listed in environmental permits to indicate maximum allowable discharge, and is thus an important measure for environmental protection. Electrical conductivity, TSS and TDS were also commonly listed parameters: 65%, 51% and 38%, respectively.
Figure 10 shows the organic parameters that were measured and reported. The most commonly captured organic parameter was COD, in 33 of 65 cases (51%). COD is listed for 100% of streams in the petroleum industry, and 88% of streams in the pulp and paper industry. Chemical oxygen demand (COD) is a standard and basic parameter indicating the oxidisable content of a stream. Both of these two industries process organic material, and thus often measure COD. The petroleum industry analysed for other organic parameters.
Figure 11 shows different forms of nitrogen measured in wastewater by industry.
Forms of nitrogen were measured in 41 of 65 cases (63%). WULs, CWDPs, NATSURV or industry listed nitrogen in at least one of the following forms: total nitrogen, organic nitrogen, ammonia nitrogen or ammonia, nitrate and nitrite. Of these, parameters for ammonia and nitrate/nitrite were most commonly reported. Ammonia was listed in 26 cases (40%), and nitrate and/or nitrite parameter in 21 cases (32%). Nitrogen is associated with deoxygenation and eutrophication of water bodies if released to the environment.
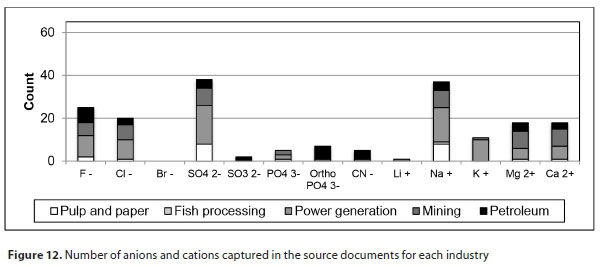
Figure 12 shows the anions and cations measured across the different sources.
Sulphate was the most common anion, captured in 38 of 65 cases (58%). Sulphate is reported for 95% of the streams in power generation; 60% of cases in mining; and 50% of the streams in pulp and paper. Thereafter fluoride and chloride were commonly listed anions, in 25 (38%) and 23 (35%) cases. Fluoride was listed for 78% of petroleum industry streams, and chloride was listed for 90% of mining streams.
Sodium was the most commonly listed cation, in 37 of 65 cases (57%). It was recorded for 84% of the streams in the power generation industry; 60% of the streams in mining, and 50% of the streams in the pulp and paper industry. Overall, the power generation and mining industries are most likely to record ion concentrations.
In many cases limits were specified for calcium but there were no corresponding measured values. This could be because calcium is not an environmental hazard. However, calcium is associated with scaling, and is therefore an important parameter with respect to designing appropriate treatment schemes.
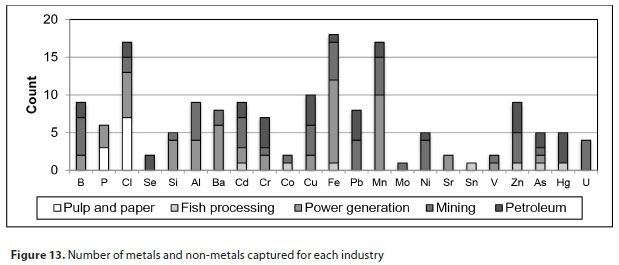
Figure 13 shows the metals and non-metals that were captured in each of the source documents. These constituents were captured more infrequently as compared with the previous ones, noting the different scale on the y-axis. The most commonly listed metal was iron, 18 times. Manganese was also relatively commonly reported, in 17 cases.
Comprehensiveness of wastewater quality data and reporting
Seven parameters were listed in more than half of the cases captured in the studied source documents. These are pH (86%), volume (75%), electrical conductivity (65%), forms of nitrogen (63%), sulphate (58%), sodium (57%) and COD (51%).
The purpose of wastewater quality reporting appeared to determine the comprehensiveness of the reported data. Where compliance was the key purpose, the available data tended to be more qualitative, while in cases where the purpose of wastewater quality monitoring was for recycling, reuse or possible resource recovery, the available data tended to be more detailed and quantitative.
Legal compliance, as in WULs and coastal water discharge permits (CWDPs), requires that wastewater streams be reported in terms of specified parameters. These parameters are unique to each CWDP or WUL.
In some cases, where compliance reports were available, it was noted that wastewater streams were not reported in terms of all the specified parameters, with some parameters missing. Calcium was one notable missing species that was not reported in many cases although it was specified in WULs and CWDPs. This indicated that the wastewater quality data, in certain cases, did not report all the parameters specified in the environmental permits, i.e., WULs and CWDPs. In such cases, the data were insufficient for use in the designing of further treatment processes or assessment of the treatability of the wastewaters for reuse or resource recovery.
Furthermore, it appeared as though reporting was for compliance purposes rather than treatment. However, this observation may be biased because of the nature of documents from which the data were obtained. Majority (i.e., 40 out of 65, 62%) of the source documents were legal documents, which are more likely to report for compliance over treatment. Selected elements or parameters were reported for compliance and regulation purposes due to their hazardous nature (e.g. phenol and mercury), while those critical for assessing treatability and potential for resource recovery (e.g. calcium, magnesium etc) were often omitted. It is possible that companies were monitoring and measuring other parameters privately that were not reported in the source documents accessed in this research. A few cases were encountered in this study where companies had quite detailed wastewater quality data in their private records for internal use in the monitoring of their processes, for example, in the power generation, fish processing and coal mining industries.
Accuracy of wastewater quality data reporting
Industry and government in South African have made efforts to characterise industrial wastewaters. Government regulates water users and wastewater generators through environmental permits. These are audited, showing intention to protect the environment. However, data production and reporting could be improved to avoid technical errors that lead to misrepresentation of data. Errors included reporting a 95th percentile limit larger than the maximum limit. Data capturing errors also resulted in the reporting of unrealistic numerical values for some parameters, for example, a reported pH value of '987'. This was detected for pH because its range is well known. The accuracy of reporting for other parameters was difficult to evaluate since their ranges are not well known a priori. This problem could be alleviated by using historical data and 'calibration' by regulatory authorities through measurements that they could conduct at certain intervals. These initiatives would need expansion of IT infrastructure and human resources to capture, store and analyse the resultant 'big data' while ensuring the cyber security thereof, especially at regulatory authorities' stations where data for many companies would be stored. Careful monitoring of this data would still be required to detect once-off events (such accidents, floods and decants) that would distort the data and could be detected as inaccurate reporting. The use of historical data would also assist in the design of treatment processes that are versatile to handle erratic and extreme deviations.
Consistency in reporting water quality data
Ten wastewater streams in the mining industry were characterised in WULs. Although all of these streams arose from one industry, and the data were sourced from the same type of document (WULs), nonetheless there was variation in the reporting of that data. The quality wastewater streams were reported inconsistently. Some companies reported detailed wastewater quality data that included both quantitative and qualitative information (including the process that generated the wastewater, location of sampling points, etc.) while others from the same industry reported on compliance qualitatively. This was deemed to be a function of organisational cultures and possibly terms of the WULs or CWDP which could be different amongst companies. These differences could also be a result of different discharge catchment areas and requirements along with other sitespecific conditions.
Access to information regarding wastewater quality data
This research was dependent on the information contained within accessed documents; which in turn was dependent on the researchers' success at accessing information. The methodology section outlines different sources and approaches to accessing information: from published sources, through establishing relationships with industry and voluntarily shared information, and by PAIA applications.
Successes and challenges of relational approach to access
It was found that public and private data sources were largely inaccessible until relationships and trust had been established with companies and institutions. Both bodies at large were reluctant to release information that was perceived to be confidential and sensitive or that could cause reputational damage to the organisation.
Figure 14 illustrates the different outcomes of requests for such information, as experienced in this research; and can be read with Fig. 6.

The most common outcome (37%) was no response to emails and phone calls after initial contact was made. This was even after several follow-up attempts. The second most common response, in 29% of outcomes, was for an individual to refer the request to another person/authority. A referral can be treated like a recycle loop, as indicated in Fig. 6. A referral did include scenarios where a contacted and responsive person needed to escalate the request to their supervisor, superior or legal team.
In 26% of cases, companies were able to assist, either by providing resources and or scheduled meetings. In 14% of cases, the contacted person provided resources in the form of theses, databases or unpublished appendices to published reports. In 12% of cases the contact could provide a site tour, samples or wastewater quality data.
In 6% of cases the supervisor, superior or legal team would indicate that they were unable to assist. There are many reasons as to why requests around wastewater quality characterisation data were refused. The first possible explanation was that companies perceived wastewater data to be sensitive and confidential (Cloete et al., 2010). They were, therefore, reluctant to release such data because of the risks of undesired consequences. These consequences include, amongst others, reputational damage to companies and associated financial losses, as well as the possibility of prosecution (Cloete et al., 2010). In some cases, it was difficult to obtain data from companies because of organisational cultures and structures that regulated the internal and external distribution of data for security reasons. This was possibly not limited to wastewater quality data.
Another possibility was limited time and human resources allocated towards research activities, coupled with the negative perception of the value of the research outcomes. For example, the pulp and paper industry had recently been surveyed for NATSURV, and some companies expressed a concern of being over-researched.
These factors might have been at play simultaneously. In cases where companies were unable and/or reluctant to assist, or where companies were not responding, the formal PAIA application process was used to access information.
Challenges and successes of formal approaches
Wastewater information is not confidential (as defined in NEMA, 1998). Every company has a responsibility to publish a PAIA manual, which must indicate records which are available and outline procedures to submit a PAIA application (section 14 of PAIA for public entities, and section 51 for private bodies). Stakeholders can request information from individual companies, or submit a PAIA application to governmental bodies.
Section 14 (2) of PAIA states that public bodies annually update and publish their PAIA manuals. Private bodies must also update their manuals regularly, given in section 51 (2) of PAIA. According to the experience of this research endeavour, annual updates were not universally practised. This creates difficulties for a requester, especially when the listed information officer is not the current information officer. Contact details were also incorrect and outdated.
As an example, the DWS's PAIA manual was written in the name of the DWAF. The DWAF underwent restructuring, during which their name was changed to the DWS. Their PAIA manual had not been updated since then. Consequently the information officer and contact details were incorrect. Therefore finding the current information officer was time-consuming and challenging.
Both public bodies and private entities must list records that are available without a formal PAIA request, from section 14 (1) (e) and section 51 (1) (c) respectively.
In the experience of this research, requests where no formal application was required proved to be more problematic than the formal process. In the formal application there were specified, legally binding timelines for a response (namely, 30 days). With the informal request, the requirement to respond and strict timelines did not exist, and automatically available records could not be accessed. This route of requesting available records was abandoned. This was because information that was 'publically available' in legislation and PAIA manuals, was not be publically available in practice.
Two PAIA applications were submitted and both applications were successful. An extension was granted for the second application to the DWS. Only some of the documents requested in the PAIA application to the DWS were received, because of companies' data production, reporting and submission issues to the DWS. Not all compliance reports had been submitted to the DWS. The documents received were accompanied by an affidavit accounting for the missing records.
A significant portion of this research process was spent on developing approaches and methods to accessing data. It appeared as if poor communication or mistrust exists between industry, government and research institutions, and this inhibits transparency. An environment of trust and transparency is required to facilitate synergistic relationships. Synergies and trust open possible access to wastewater quality information, which can support research institutions in performing relevant and locally appropriate research. This can further the development of contextually relevant treatment technologies. These can feed back into industry to support them in their waste management endeavours. This all aids the government in achieving goals of water security, environmental sustainability and realising the constitutional rights of South African citizens.
CONCLUSIONS
Wastewater quality characterisation and reporting for compliance
From the WULs and compliance reports, it was observed that wastewater quality monitoring was completed, only as far as was practical, for compliance purposes. For example, calcium was not measured in compliance reports although the parameter was specified in permits. From this it was concluded that wastewater quality analysis was for compliance (provided testing was practical and not prohibitively expensive) and not for treating wastewaters.
The measured and reported parameters were usually those that appeared on the environmental permits or licences. Compliance seemed to be prioritised over treatment. In some cases, not all the listed parameters were measured, and this was attributed to the prohibitive costs of testing samples.
Accuracy of wastewater quality data reporting
Industry and government in South African have made efforts to characterise industrial wastewaters. Technical errors in reporting were detected in some of the environmental permits and or licences. These lead to misrepresentation of data and there is scope for improvement in the production and reporting of wastewater quality data.
Accessing information regarding wastewater quality
Accessing information was a challenge. Although wastewater and waste information is not confidential, as defined in NEMA, it was not readily accessible. Companies perceived that this information was confidential and cited reasons of confidentiality for not sharing wastewater information.
Informal, relational routes to access information, through building relationships, emails and telephone calls, were hindered by mistrust and fear. Industry was reluctant to share wastewater quality information for many reasons. These include concerns of confidentiality, risk of reputational damage, increased treatment costs and possibility of prosecution.
The formal processes, such as PAIA applications, were hindered by communication problems (outdated online contact details), human resource constraints, as well as lengthy processing times of applications.
Trust and transparency
Accessibility of non-confidential waste-related data (as defined in NEMA) was limited by poor distinction and understandings of what industrial and governmental records were and were not confidential. Requests for non-confidential data were met with suspicious regard as to how it would be used and what it would be used for. Trust and transparency would help better facilitate research and development.
RECOMMENDATIONS
Ensure parameters for treatability are included in analysis
The reported wastewater quality data revealed that certain parameters that are important for treatment were absent. Therefore, the parameters that are used to characterise wastewaters should be expanded to ensure these components are included. One such component is calcium.
There should be an iterative process between quality characterisation and treatment, to identify missing parameters in increasingly complex streams. Research institutions cooperating with industrial partners and government could contribute to identifying missing parameters that are important for treatment.
Enhance synergies between government, industry and research
Synergies between governmental bodies, research institutions and industrial partners can facilitate the development of treatment technologies, eliminate errors in reporting and identify important parameters that are currently absent from wastewater quality data. However synergetic relationships can only be achieved in an environment that fosters trust and transparency. It is recommended that possible synergies between these government, industry and research institutions be enhanced to improve wastewater management.
Improve trust and transparency
The legal framework in South Africa can be used to motivate for and support transparency with respect to waste and wastewaters.
ACKNOWLEDGEMENTS
The authors would like to acknowledge funding from the Water Research Commission. We would like to thank those people in industry and government that provided information or assistance in accessing information.
REFERENCES
CLAASSEN M and MASANGANE W (2015) The current state and future priorities of brine research in South Africa: Workshop proceedings (unpublished). Water Research Commission, Pretoria. [ Links ]
CLOETE T, GERBER A and MARITZ L (2010) A first order inventory of water use and wastewater production by SA industrial, mining and electricity generation sectors. WRC Report No. 1547/1/10. Water Research Commission, Pretoria.DEA (Department of Environmental Affairs, South Africa) (2017) National Environmental Impact Assessment and Management Strategy (EIAMS). URL: https://www.environment.gov.za/documents/strategies/eiams_environmentalimpact_assessmentmanagement (Accessed 10 April 2017). [ Links ]
DWAF (Department of Water Affairs and Forestry, South Africa) (2007) Resource directed management of water quality: Training manual for Resource Water Quality Objectives (RWQO) Model. Department of Water Affairs and Forestry, Pretoria. [ Links ]
DWAF (Department of Water Affairs and Forestry, South Africa) (nd) Manual on the Promotion of Access to Information Act, 2 of 2000. Department of Water Affairs and Forestry. Pretoria. [ Links ]
DWS (Department of Water and Sanitation, South Africa) (2018) National Integrated Water Information System. URL: http://niwis.dws.gov.za/niwis2/rwqo (Accessed 30 April 2018). [ Links ]
HUTTON G and HALLER L (2004) Evaluation of the Costs and Benefits of Water and Sanitation Improvements at the Global Level. World Health Organization, Geneva. [ Links ]
RSA (Republic of South Africa) (1996) Constitution of the Republic of South Africa, No. 108 of 1996. 18 December. Government Printer, Cape Town. [ Links ]
RSA (Republic of South Africa) (1998) National Water Act, No. 36 of 1998. 20 August. Government Printer, Cape Town. [ Links ]
RSA (Republic of South Africa) (1998) National Environmental Management Act, No. 107 of 1998. Government Gazette 401 (19519). [ Links ]
27 November. Government notice no. 1540. Government Printer, Cape Town. [ Links ]
RSA (Republic of South Africa) (2000) Promotion of Access to Information Act, No. 2 of 2000. Government Gazette. 20852. 2 February. Government Printer, Cape Town. [ Links ]
RSA (Republic of South Africa) (2008) National Environmental Management: Integrated Coastal Management Act, No. 24 of 2008. Government Gazette. 524 (31884). 11 February. Government notice no. 138. Government Printer, Cape Town. [ Links ]
SATO T, QADIR M, YAMAMOTO S, ENDO T and ZAHOOR A (2013) Global, regional, and country level need for data on wastewater generation, treatment, and use. Agric. Water Manage. 130 (2013) 1-13. https://doi.org/10.1016Zj.agwat.2013.08.007 [ Links ]
VAN DER MERWE IW, LOURENS A and WAYGOOD C (2009) An investigation of innovative approaches to brine handling. WRC Report No. 1669/1/09. Water Research Commission, Pretoria. [ Links ]
WORLD BANK (2012) The Future of Water in African Cities: Why Waste Water? World Bank, Washington, DC. [ Links ]
WWAP (World Water Assessment Programme, United Nations) (2017) The United Nations World Water Development Report 2017. Wastewater: The Untapped Resource. UNESCO, Paris. [ Links ]
 Correspondence:
Alison E Lewis
Email: alison.lewis@uct.ac.za
Received: 31 Jan 2019
Accepted: 31 March 2020

