


Services on Demand
Article
 English (pdf)
 Article in xml format
 Article references
Indicators

Related links
-
 Cited by Google
 -
 Similars in Google
Share

 Permalink
Water SA
On-line version ISSN 1816-7950
Print version ISSN 0378-4738
Water SA vol.46 n.2 Pretoria Apr. 2020
http://dx.doi.org/10.17159/wsa/2020.v46.i2.8236
RESEARCH PAPER
Using sap flow data to assess variations in water use and water status of apple orchards of varying age groups in the Western Cape Province of South Africa
NT MobeI, V; S DzikitiI, III, V; T VolschenkII; SF ZirebwaIII; Z NtshidiI, V; SJE MidgleyIII; WJ SteynIII, VI; E LötzeIII; S MpandeliIV; D MazvimaviV
ISmart Places Cluster, Council for Scientific and Industrial Research (CSIR), Stellenbosch, South Africa
IISoil and Water Science Programme, ARC Infruitec-Nietvoorbij, Stellenbosch, South Africa
IIIDepartment of Horticultural Science, Stellenbosch University, Stellenbosch, South Africa
IVWater Research Commission (WRC), Private Bag X03, Gezina 0031, South Africa
VInstitute for Water Studies, Department of Earth Sciences, University of Western Cape, South Africa
VIHortgro, Paarl, South Africa
ABSTRACT
No accurate quantitative information currently exists on how water use of apple (Malus domestica) orchards varies from planting to full-bearing age, leading to poor irrigation and water allocation decision making. This study sought to address this knowledge gap by investigating how the water use and tree water status vary with canopy cover, cultivar, and climatic conditions in 12 orchards growing in prime apple-producing regions in South Africa. The orchards were planted to the Golden Delicious/Golden Delicious Reinders cultivars which are widely planted in South Africa and the Cripps' Pink/Cripps' Red/Rosy Glow which are high-value late-season cultivars. The performance of two transpiration reduction coefficients, one based on sap flow (Ksf) and the other based on soil water depletion (Ks) (FAO approach) were evaluated against the midday stem water potential (MSWP) in all the orchards. While canopy cover had a clear effect on the whole-tree sap flow rates, there were no significant differences in the transpiration per unit leaf area among the cultivars. The daily average sap flux density under unstressed conditions was highest (~284 cm3-cm-2) in the medium canopy cover orchards (30-44% fractional cover), followed by the mature orchards (~226 cm3-cm-2), and was lowest in the young orchards (~137 cm3-cm-2). Canopy cover rather than growing season length had a greater effect on seasonal total water use. Peak daily orchard transpiration ranged from 1.7 mm for young Golden Delicious Reinders trees to 5.0 mm in mature Golden Delicious trees that were maintained with large canopies to reduce sunburn damage to the fruit. For the red cultivars, the peak daily transpiration ranged from 2.0 to 3.9 mm, and the mature trees were maintained with less dense canopies to facilitate the development of the red fruit colour. The less dense canopies on the red cultivars had water-saving benefits since the seasonal total transpiration was lower relative to the Golden Delicious cultivar. The sap flow derived stress coefficient was strongly correlated to the MSWP (R2 ~ 0.60-0.97) in all the orchards while Ks was not able to detect plant stress due to over-irrigation.
Keywords: cultivar, canopy cover, transpiration reduction, xylem water potential
INTRODUCTION
Semi-arid regions, such as the Western Cape Province in South Africa, parts of Spain, Italy, and other Mediterranean countries, are major producers of fruits such as apples, pears, citrus, olives, etc. (Girona et al., 2011; Cammaleri et al., 2013; Volschenk, 2017). These fruit are produced for local and global markets, mostly under irrigation, due to insufficient rainfall during summer. The availability of adequate water for irrigation is critical for sustainable production yet water resources in some fruit-producing regions face serious threats. These threats arise from growing populations, increasing competition from other economic sectors, and climate change (Annandale et al., 2011; Midgley et al., 2016; Dzikiti et al., 2018a). Despite these concerns, some studies have reported poor irrigation practices in apple orchards due to a lack of reliable information and tools to aid irrigation scheduling (Volschenk et al., 2003; Dzikiti et al., 2018b).
In South Africa, for example, the second National Water Resource Strategy cites irrigated agriculture as the major user of water, accounting for more than 60% of the available resources. However, nearly one third of the allocated water is lost, mainly through over-irrigation and leakages (DWA, 2013). This highlights an urgent need to increase water use efficiency for the sustainability and growth of the fruit industry. Non-beneficial water losses in orchards can be reduced through improved irrigation scheduling which can be achieved by using accurate irrigation tools and information, e.g., on crop water requirements under a range of growing conditions (Jones, 2008; Ferreres et al., 2012). Precise irrigation scheduling is also important for reducing contamination of rivers, dams, and groundwater sources through irrigation return flows (Batchelor et al., 2014).
Apple orchards in dry regions require irrigation from planting to full-bearing age, although irrigation management may differ depending on orchard age group (Hortgro, 2015). Accurate quantitative information on orchard water use and how trees respond to soil water deficit is needed (Ferreres et al., 2012) across various orchard age groups, cultivars, and production regions. Besides the work done by Massonnet et al. (2007), no other studies have compared the water use characteristics of different apple cultivars. It is important to close this information gap given the wide range of apple cultivars that are commercially available. While the FAO has developed practical guidelines for estimating crop water requirements, e.g., from canopy cover estimates, these protocols require local validation for accurate irrigation scheduling (Allen et al., 1998).
Irrigation scheduling is usually done through monitoring either the soil, plant water status or atmospheric variables (Dzikiti et al., 2010; Othman et al., 2014). Jones (2004) gave a detailed overview of the advantages and pitfalls of various plant-based irrigation scheduling methods. Annandale et al. (2011) and Jones (2008) summarized progress on the soil, plant, and atmospheric irrigation scheduling methods including various irrigation models. However, given that most physiological processes that determine plant growth and productivity depend on the plant rather than the soil water status, it is widely believed that precise irrigation scheduling can be achieved using plant-based water-stress indicators (Jones, 2004; Zimmermann et al., 2010).
The objectives of this study were therefore to use actual experimental data, firstly to compare the daily and seasonal water use trends and their drivers in apple orchards from planting until full-bearing age and, secondly, to establish whether the water use of apple orchards varies by cultivar - for which little information currently exists. Thirdly, we compare the sensitivity of the plant-based transpiration reduction coefficient (Ksf) with an available soil water-based FAO56 transpiration reduction coefficient (Ks) in the various apple orchards. The data were collected in 12 commercial orchards in South Africa planted to apple cultivars that are commonly grown in the subtropical production areas. The information derived has potential applications in improving irrigation scheduling and productivity in orchards through early detection of plant water stress, and improved parameterization of water use models.
MATERIALS AND METHODS
Site description and plant materials
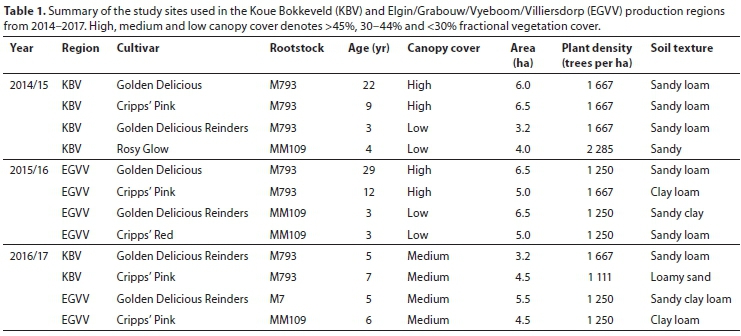
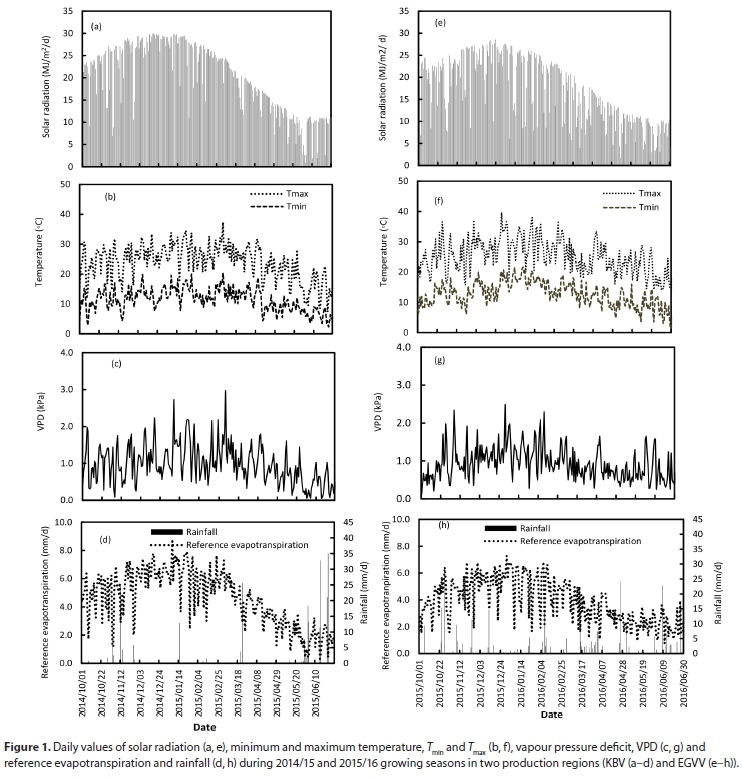
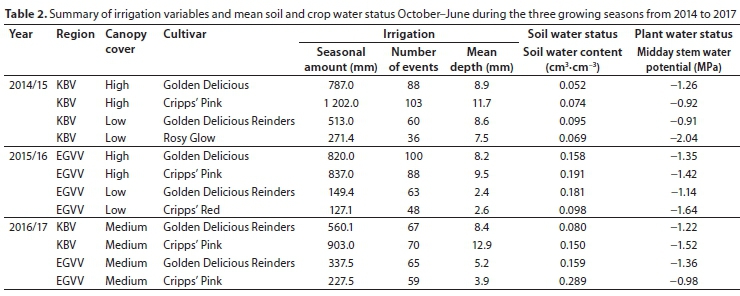
Data were collected over three growing seasons (October to June) during 2014/15, 2015/16 and 2016/17 in two key apple-producing areas in the Western Cape Province of South Africa. Table 1 summarises the attributes of the 12 commercial orchards studied in the Koue Bokkeveld (KBV) plateau near the town of Ceres and the lower-lying Elgin/Grabouw/Vyeboom/Villiersdorp (EGVV) region. These regions have a Mediterranean-type climate with winter rainfall (May-August). However, significant differences exist in the microclimates of the two regions as summarized in Fig. 1. The KBV region experiences hot dry summers and cold winters (high chilling area), which are critical for meeting the chilling requirements of most apple cultivars. The EGVV, on the other hand, experiences milder winters and summers given the proximity of the region to the Atlantic Ocean. Cultivars selected included Golden Delicious, because of the nature of its canopies (denser and therefore high LAI) and because it is also the most widely planted apple cultivar in South Africa and elsewhere in the Mediterranean region (Hortgro, 2018). The Cripps' Pink on the other hand is a long season (late harvest) cultivar and its fruit are on the tree for 2 months longer than Golden Delicious.
In 2014/15, data were collected in two mature full-bearing and two young non-bearing orchards in KBV (Table 1). The mature full-bearing orchards, planted to Golden Delicious and Cripps' Pink on M793 rootstock had a high effective canopy cover varying from 45 to 52%. The effective canopy cover was determined from the canopy dimensions according to Allen and Pereira (2009). The two young orchards had a low canopy cover of between 14% and 26% and these were planted to Golden Delicious Reinders and Rosy Glow, which were in the second and third leaf, respectively. Golden Delicious Reinders is a higher chill Golden Delicious bud mutation that is less susceptible to netiform and stem-end russet than standard Golden Delicious whereas Rosy Glow is a redder bud mutation of Cripps' Pink that is marketed as Pink Lady if it meets the fruit colour requirements. The rootstocks were M793 for Golden Delicious Reinders and MM109 for Rosy Glow, both of which are semi-vigorous.
In the second season (2015/16) data were collected in two full-bearing and two young orchards in the EGVV region (Table 1). The mature orchards were also planted to Golden Delicious and Cripps' Pink on M793 rootstock and they had a similar canopy cover as in KBV. The young orchards were planted to 3-year-old Golden Delicious Reinders and Cripps' Red on the MM109 rootstock. Cripps' Red has a slightly later harvest date compared to Cripps' Pink and was developed from the same breeding population.
In the third season (2016/17), measurements were taken in two orchards in each production region with medium canopy cover ranging from 30% to 44% (Table 1). The orchards consisted of Cripps' Pink and Golden Delicious Reinders on MM109 and M793 rootstocks, respectively. The Golden Delicious Reinders orchard at EGVV was planted to the M7 rootstock which has similar attributes to the M793 rootstock.
Soil types were predominantly sandy to sandy loam except for three orchards in EGVV, namely, the full-bearing Cripps' Pink, non-bearing Golden Delicious Reinders, and the medium cover Cripps' Pink. These orchards had dark red clayey loam soils with a high stone content.
All orchards were irrigated using a micro-sprinkler system with one micro-sprinkler per tree delivering between 30 and 32 L of water per hour. Irrigation frequency ranged from 2 to 3 times per week with each event lasting for 1 to 2 h early in the season. The irrigation frequency increased to daily or several times a day during the hot summer months. Table 2 provides detailed information on the irrigation and soil water status of the various orchards.
Microclimate and transpiration
Orchard microclimates were monitored using automatic weather stations situated close to each orchard. The stations were installed on open spaces with a uniform short grass cover that was kept well-watered. Climate variables measured included the maximum and minimum air temperatures, maximum and minimum relative humidity, solar irradiance, wind speed and direction and rainfall. These data were collected at hourly or daily intervals throughout the growing seasons. Reference crop evapotranspiration (ETo) was calculated for a short grass reference using the FAO modified Penman-Monteith equation (Allen et al., 1998).
Transpiration in the medium and high canopy cover orchards was quantified by monitoring sap flow in each orchard using the heat ratio method (HRM) of the heat pulse velocity (HPV) technique as described by Burgess et al. (2001). Four probes were installed on the main trunk on 3-6 trees per orchard about 10-15 cm above the graft union away from the disturbed xylem. The trees were selected to represent different stem size classes in each orchard. Probes were inserted in the sapwood of each tree at various depths from the bark to capture the radial variation in the sap velocity within the sapwood (Wullschleger and King, 2000). Each probe set consisted of two Type T thermocouples placed equidistantly at 0.5 cm upstream and downstream of a stainless-steel heater probe. Heat pulse velocities were measured and logged on an hourly basis using a CR1000 data logger on which an AM16/32B multiplexer (Campbell Sci. Inc., Logan, UT, USA) was connected. To calculate the volumes of water transpired by the instrumented trees, the heat pulse velocity signals were firstly corrected for wounding using the approach by Swanson and Whitfield (1981). The sap flow volume per tree (in litres per day) was calculated as the weighted sum of the product of the sap velocity and the conducting sapwood area at a given probe insertion depth. The sapwood area was determined by injecting methylene blue dye into the stems and auguring samples to establish the proportion of the stem cross-sectional area covered by the active xylem vessels (Dzikiti et al., 2017).
Transpiration of the smaller trees in the low canopy cover orchards was measured using Granier probes (TDP 10: Dynamax Inc., Houston USA) (Granier, 1987). Three healthy and actively growing trees in different stem size classes were instrumented per orchard and the average sap velocity was determined in the range 0 to 10 mm of the stems. Sensors were installed at a height between 50 and 75 cm from the ground to eliminate errors due to the cold sap, especially in the morning. A reflective aluminium foil was wrapped around the probes to minimize the effects of exogenous heating on the sap temperature signals. The data were also collected hourly throughout the season. Total orchard transpiration (T, in mm-d1), expressed per unit ground area, was calculated as the product of the average tree transpiration (in L-tree-1-d-1) times the number of trees per hectare divided by 10 000 m2. To use the sap flow data to compare the transpiration responses of the different apple cultivars, we divided the orchard transpiration (T) with the tree leaf area index (LAI - m2 of leaf area per m2 of ground area) to obtain the transpiration (E , in mm-d-1) expressed per unit leaf area.
The contribution of the winter-time transpiration to the seasonal total water use was calculated as the transpiration between 1 May and 30 June and expressed as a fraction of the seasonal total transpiration.
Vegetative growth, soil water content, and irrigation
The leaf area index of the 12 orchards was measured at regular intervals during the course of the season using the LAI-2000 leaf area meter (LI-COR Inc., Nebraska, USA) on 7 trees per orchard. The measurements were taken at sunset or on overcast days when the assumption that the leaves behave like black bodies was most realistic.
The seasonal dynamics of soil water content were monitored at different depths in the root zone and beyond and at various wet/ dry locations using between 3 and 30 time domain reflectometer probes (Model CS616- Campbell Sci. Inc., Logan, UT, USA). Irrigation was monitored in each orchard using water flow meters (Model: ARAD Multi-Jet Water Meter, Germiston, South Africa), with a resolution of 10 L per pulse installed on the irrigation line. The amount of irrigation received by each tree was calculated as the ratio of the volume of water that passed through the flow meter divided by the number of trees downstream of the flow meter.
Tree water status
Tree water status was monitored by measuring the midday stem water potential (MSWP) at monthly or bi-monthly intervals during the 2014/15, 2015/16 and 2016/17 growing seasons on selected trees. In each orchard, 5 trees were marked in the same row as the sap flow instrumented trees. Another 5 trees were marked in the next row on the opposite side of the instrumented tree row, to give a total of 10 trees per orchard. Midday stem water potential was measured on these 10 trees between 12:00 and 14:00 pm (Local time = GMT + 2 h) on 2 healthy and fully expanded leaves located close to the tree trunk, using a Scholander et al. (1965) pressure chamber. Leaves were covered 2 h before measurement with zip-lock reflective stem water potential bags (PMS Instrument Company, Albany, OR USA) to allow leaf water potential to equilibrate with the water potential of the stem's xylem.
In addition to the sap flow approach to establish whether water use varied by apple cultivar described earlier, further transpiration data were collected at the leaf level in pairs of orchards planted to Golden Delicious/Golden Delicious Reinders and Cripps' Pink/Red/Rosy Glow. The LI-6400 XT Photosynthesis Systems (LI-COR, Lincoln, Nebraska, USA) was used to measure 2 sun-exposed leaves per tree on 5 trees per orchard in the morning (09:00-11:00) and in the afternoon (12:00-14:00). The time difference between the leaf gas exchange measurements between the orchards was less than 1 h given that the orchards were mostly located close to each other.
Water stress indicators
Two independent indicators of orchard water stress based on daily data were evaluated. These include the transpiration reduction coefficient (Ks) which was calculated using daily average soil water content measurements in the root zone according to the FAO56 guidelines (Allen et al., 1998). Ks = 1 indicates no transpiration reduction (i.e. no water stress) and this reduction factor can be expressed as:
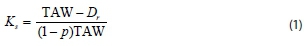
where Dr (mm) is the daily root zone depletion, and p is the depletion coefficient which accounts for the resistance of the crop to water stress. The value of p = 0.50 was used in this study as proposed by Allen et al. (1998) for apple orchards. TAW (mm) is the total available water in the entire root zone calculated as:

where ÖFC and ÖWP represent the volumetric soil water content at field capacity and permanent wilting point, respectively, and values were determined from water retention curves and the details presented in Dzikiti et al. (2018b). Zris the effective rooting depth, which was estimated to be about 60 cm in the young orchards and 100 cm in the mature orchards, based on actual observations in selected orchards where profile pits were dug.
The second orchard water stress indicator was the plant-based transpiration reduction coefficient (Ksf), which was based on sap flow measurements and was calculated as:
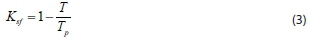
where T is the daily orchard transpiration expressed per orchard floor area derived from the sap flow measurements (in mm-d-1), and Tprepresents the potential transpiration when soil water is not limiting calculated as:

The Kt values used in this equation were obtained from the data collected on clear days after irrigation when the trees did not experience water stress. ETo is the reference evapotranspiration (in mm-d-1). According to Allen et al. (1998), Kt in Eq. 4 is similar to the basal crop coefficient which is defined as the ratio of the actual evapotranspiration to ETo when the soil surface is dry. The transpiration coefficient (Kt) was calculated as:

where T was the transpiration measured on a given day throughout the season.
Statistical analysis
Data collected from the trials were subjected to analysis of variance (ANOVA) using STATISTIX 10.0 (Tallahasse, USA). Mean separation tests were done using Tukey HSD at a < 0.05 for mean comparison for all the production regions in all seasons.
RESULTS
Climatic conditions
In the KBV region in 2014/15, solar radiation ranged between 11.2 and 30.0 MJ-m-2-d-1 with daily minimum and maximum temperatures of between 5.8°C in winter and 31.4°C in summer, respectively (Fig. 1a and b). The daily average vapour pressure deficit of the air (VPD) varied from 0.36 kPa in September 2014 to a peak around 3.0 kPa in March 2015 (Fig. 1c). The total rainfall of 280 mm measured during the study period had a very uneven distribution (Fig. 1d). Most of the rain was received in late spring (17%) in October and November 2014 and in late autumn to early winter (53%) in the months of May and June 2015, respectively. The seasonal (October to June) total reference evapotranspiration (ETo) at 1 264 mm was more than 4 times higher than the rainfall.
In the EGVV region the daily solar radiation peaked at 28.6 MJ-m-2-d-1 (Fig. 1e) with daily minimum and maximum temperatures of between 1.4°C in winter and 39.7°C in summer during the 2015/16 season, respectively (Fig. 1f). On warm and dry days the maximum VPD was lower than that reached in KBV the previous year, peaking at 2.5 kPa (Fig. 1g), highlighting the milder atmospheric evaporative demand in EGVV compared to KBV. The seasonal total reference evapotranspiration was lower in EGVV, at 1 064 mm, than that recorded in KBV during the 2014/15 growing season. Total rainfall during the 2015/16 season was 247 mm, which was low for a region with a longterm average annual rainfall of around 670 mm, confirming the drought experienced in the Western Cape region during the study period. Weather conditions in 2016/17 in both production regions followed similar trends to the previous seasons although rainfall of 149 and 218 mm was recorded in KBV and EGVV, respectively highlighting even more severe drought conditions than in the first two seasons of this study.
Seasonal water use dynamics and tree growth
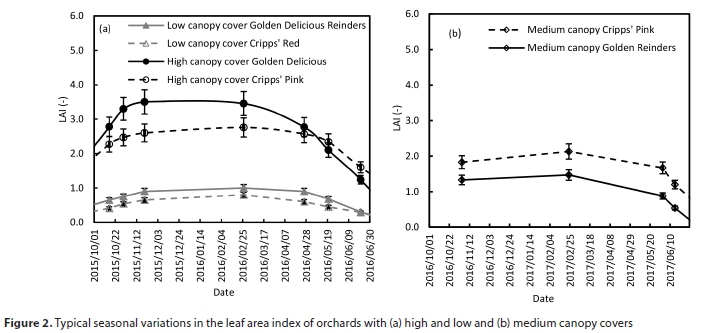
Leaf area index variations across orchard age groups
Leaf area index variation of the trees in the various EGVV orchards is shown in Figs 2a and 2b. The order of magnitude of the leaf area index (LAI) of the KBV orchards was similar to the EGVV orchards (data not shown). The mature Golden Delicious orchards had a higher average LAI, which peaked around 3.4, while the mature Cripps' Pink orchards had less dense, more open canopies, with the highest LAI around 2.8 (Fig 2a).
The medium cover Cripps' Pink orchards in both production regions, however, had slightly bigger canopies as they were older compared to the Golden Delicious Reinders orchards. The maximum LAI for the medium cover Cripps' Pink averaged 2.1 compared to around 1.5 for the Golden Delicious Reinders (Fig 2b). Peak LAI of the young orchards was approximately 1.0 for the Golden Delicious Reinders and 0.8 for the Cripps' Red orchard in EGVV.
Variations in sap flux density with orchard age group
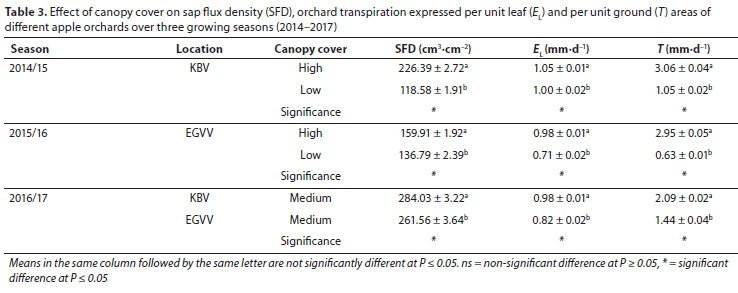
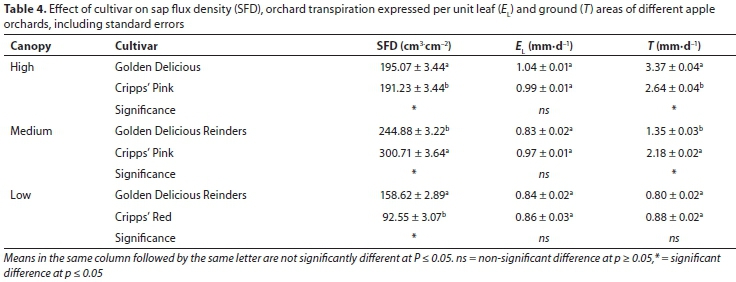
The average daily sap flux density, and the whole orchard transpiration expressed per unit ground area (T), were significantly affected by canopy cover at 5% level of significance, irrespective of cultivar (Table 3). In both production regions medium canopy cover trees had the highest daily average sap flux density, which reached 284 and 262 cm3-cm-2 in KBV and EGVV, respectively (Table 3). The high canopy cover trees had the second highest sap flux density of 226 and 160 cm3-cm-2 in the respective production regions. The young orchards with low cover had the lowest sap flux density, i.e., between 119 and 137 cm3-cm-2 in KBV and EGVV, respectively. However, there were no consistent differences in the sap flux density of the various cultivars across all 12 orchards, as shown in Table 4. As expected, trees with high canopy cover had the highest transpiration rates while the young non-bearing orchards had the lowest water-use rates (Table 3).
Cultivar effects on transpiration dynamics
The medium canopy cover trees had the highest sap flux density irrespective of cultivar (Table 4). Within each canopy cover class, differences in the sap flux density between cultivars were inconsistent, as shown in Table 4, for unclear reasons. There were also no significant differences in the transpiration per unit leaf area among the cultivars across all the orchard age groups (Table 4). On average, the transpiration per unit leaf area expressed in equivalent water depth units is around 1.0 mm-d-1 for all the cultivars. However, differences in transpiration per unit ground area (T) largely reflected differences in canopy management practices, especially for the mature orchards.
To clearly show the physiological effects of cultivar on tree water use, transpiration rate measurements were taken at leaf level as shown in Fig. 3. From this graph there were no significant differences (p > 0.05) in the transpiration rates between the two cultivars subjected to the same environmental conditions. This graph was obtained by combining the gas exchange measurements from all 12 orchards. The leaf-level transpiration data which were normalized with the leaf area support the observations from the sap flow data, i.e., that transpiration rate per unit leaf area is the same irrespective of apple cultivar. The small differences could be attributed to the effects of water stress in some orchards. The dotted line in Fig. 3 depicts the one-to-one line.

Average tree transpiration and its drivers
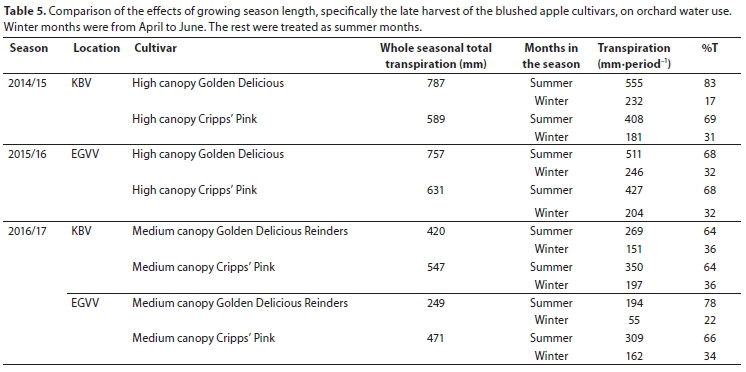
As expected, the seasonal average daily transpiration per tree was highest in the high canopy cover orchards, followed by the medium canopy orchards, and lastly the low canopy cover orchards (Table 3). The high canopy cover Golden Delicious orchards had the highest daily average transpiration of 20.1 L-tree-1-d-1, irrespective of production region. The average daily transpiration for the entire season for the high canopy cover Cripps' Pink orchards was ~ 15.0 L-tree-1-d-1. For the high canopy cover Golden Delicious orchards, the seasonal total transpiration was 787 mm in KBV and 757 mm in EGVV (Table 5), as also reported in Dzikiti et al. (2018a, 2018b). The seasonal total transpiration for the high canopy cover Cripps' Pink orchards, on the other hand, was 589 and 631 mm in KBV and EGVV, respectively. Seasonal transpiration in the medium canopy cover orchards ranged from 249 mm for the Golden Delicious Reinders orchard in EGVV to 547 mm for the Cripps' Pink in KBV. The range of seasonal transpiration for the young orchards was from 133 mm for the Cripps' Red in EGVV to 271 mm for the Rosy Glow in KBV.
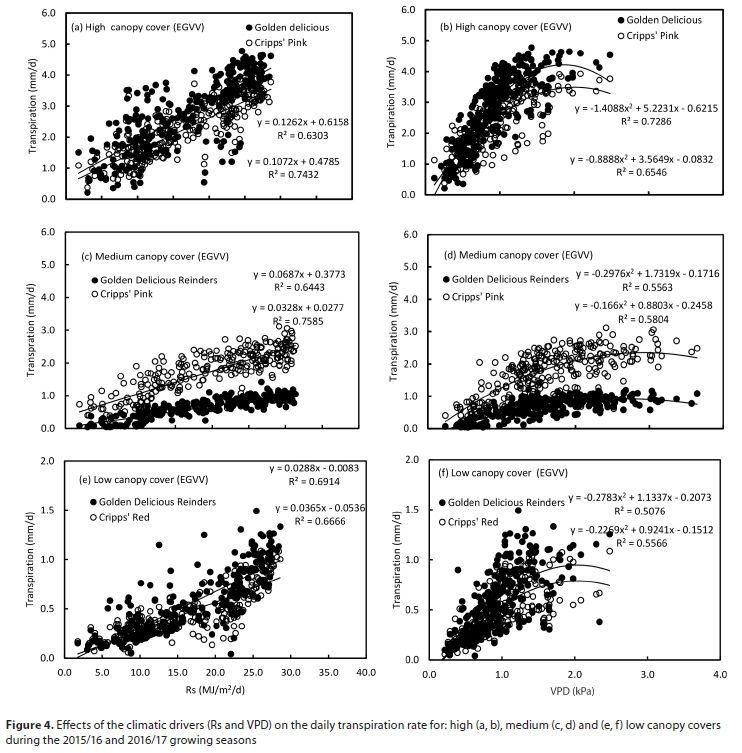
The relationship between daily transpiration and its main climate driving variables, i.e., the daily total solar radiation and the daily average vapour pressure deficit of the air (VPD), is shown in Figs 4 a-f. Transpiration in all the orchards generally increased with increasing solar irradiance and vapour pressure deficit across all age groups. There were strong and positive linear relationships between the solar radiation and transpiration in all orchards (Fig. 4 a, c and e). The coefficient of determination (R2) ranged from 0.63 to 0.74 for orchards with high canopy cover, 0.64 to 0.76 for the medium canopy cover orchards and 0.66 to 0.69 for the low canopy cover orchards. However, there was a non-linear relationship between vapour pressure deficit (VPD) and transpiration rate with the coefficient of determination being R2 = 0.65 and 0.73 for the high canopy cover orchards; 0.56 and 0.58 for the medium canopy orchards and considerably lower at 0.51 and 0.56 in the low canopy cover orchards (Fig. 4 b, d, f). The curvilinear relationship shows that the VPD has a strong limiting effect on tree water use across all orchard age groups at values in the range of1.5 to 2.0 kPa. Assessing the effect of season length on the seasonal total orchard transpiration, Table 5 shows that there was no significant additional water use during winter by the Cripps' Pink and other related long-season cultivars. Although the long-season apple cultivars maintain a high leaf area long after irrigation has ceased, leaf transpiration seems to be very low, presumably because of the low atmospheric evaporative demand, contributing between 31 and 36% of the seasonal transpiration in most instances.
Transpiration coefficient variations
The mid-season peak Kt for the high canopy cover Golden Delicious orchards ranged from 0.70 to 0.74, although there was a noticeable decline in the KBV orchard due to water stress, as shown by the corresponding soil water content trend line in Fig. 5a. The Kt values varied from a maximum of around 0.50 to 0.60 in high canopy cover Cripps' Pink orchards (Fig. 5 b & f).
In the low and medium canopy cover orchards peak mid-season Ktvalues ranged from 0.20 to 0.50, as illustrated in Fig. 5 c, d and g-l. There is, however, a peculiar decline in the mid-season Kt values in KBV for the high canopy cover Cripps' Pink (Fig. 5b), medium cover Cripps' Pink (Fig. 5j), and low cover Rosy Glow (Fig. 5d), and in EGVV in the low cover Cripps' Red orchard (Fig. 5h).
Plant water status
The midday stem water potential (MSWP) during the 2014/15, 2015/16 and 2016/17 growing seasons indicated that there was no severe water stress in most of the orchards sampled. The MSWP values ranged from -0.77 to -1.06 and -0.75 to -1.79 MPa for Golden Delicious and from -1.03 to -1.46 and -1.38 to -1.50 MPa for Cripps' Pink in high cover orchards in KBV and EGVV in 2014/15 and 2015/16, respectively. All these values were above the MSWP stress threshold for apples which is around -1.80 MPa (Volschenk et al., 2003 and Dzikiti et al., 2018b). In the medium cover orchards in EGVV, the MSWP ranged from -0.91 to -2.03 MPa for the Golden Delicious Reinders orchard indicating some stress on occasions. In the medium cover Cripps' Pink in EGVV, there seemed to be the least stress, with MSWP ranging from -0.91 to -1.32 MPa. In the medium cover orchards in KBV the measured MSWP varied from -0.84 to -1.44 MPa for the Golden Delicious Reinders and from -0.95 to -1.71 MPa for the Cripps' Pink orchards. Substantial stress was evident in the young orchards in EGVV during 2015/16 due to lower irrigation levels imposed by farmers as a drought management strategy.
For example, in the low canopy cover Golden Delicious Reinders orchard the MSWP ranged from -0.7 to -2.2 MPa compared to -1.1 to -2.1 MPa in the low canopy cover Cripps' Red orchard, and the soil water content data showed extended periods of soil water deficit in the low canopy cover Cripps' Red orchard (data not shown).
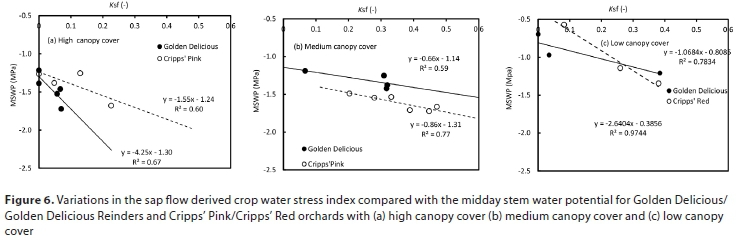
However, since MSWP was measured infrequently it cannot account for all the stress the trees were subjected to. The plant-based transpiration coefficient Ksfand the FAO soil-based transpiration reduction coefficient (Ks) provided a continuous indication of the seasonal changes in plant water status.
It is apparent from Fig. 6 that the Ksf was strongly linearly related to the MSWP in the high cover (Fig. 6a), medium cover (Fig. 6b) and low canopy cover (Fig. 6c) orchards of the various cultivars. However, Kswas not strongly correlated with MSWP or with Ksf (data not shown).
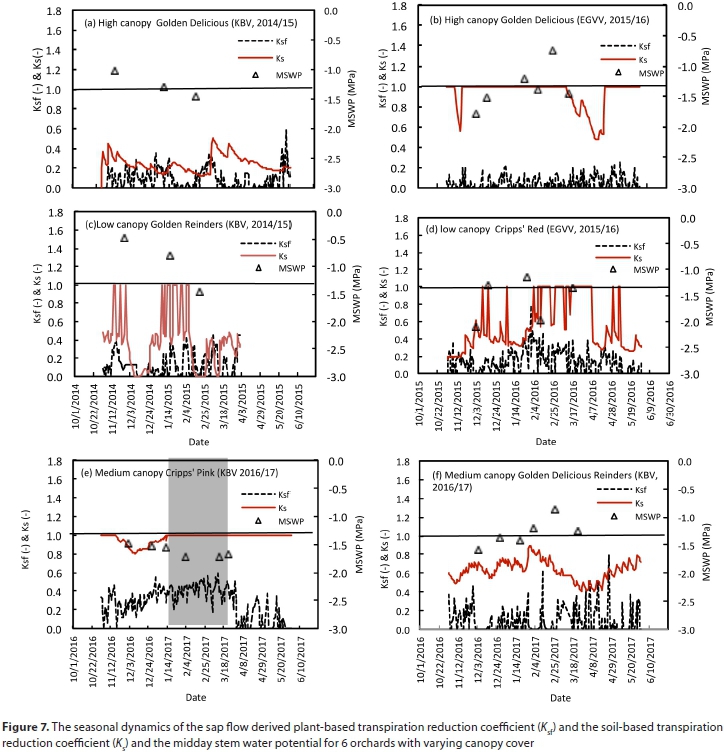
An illustration of the seasonal water stress dynamics in selected orchards is shown in Fig. 7. It is apparent that the Ksfwas much more variable than Ksas it responded not only to stress induced by soil water deficit but also by very high atmospheric evaporative demand when plant water loss exceeded root water uptake (Jones, 2004). The horizontal lines on the graphs indicate Ks = 1.0, which occurs when soil water availability did not limit transpiration. Clearly the high canopy cover Golden Delicious orchard in KBV (Fig. 7a) experienced sustained periods of water stress with a larger transpiration reduction than the high canopy cover Golden Delicious in EGVV (Fig. 7b). Accordingly, the Ksf for the high canopy cover Golden Delicious in EGVV had a smaller amplitude, being generally lower than 0.2, while the peak fluctuated from 0.2 up to as much as 0.59 for the high canopy cover Golden Delicious in KBV. There was an inconsistent behaviour between Ks and the Kffin the medium cover Cripps' Pink orchard in KBV (Fig. 7e). The irrigation and soil water content data clearly showed that there was over-irrigation in this orchard in the middle of the season (see region highlighted in grey shade), when the irrigation controller malfunctioned. The soil-based K factor indicated no stress while the Ksfinstead indicated substantial stress. The stress detected by the Ksf can be attributed to waterlogging conditions and this highlights the limitations of the FAO's soil-based transpiration reduction coefficient. The low canopy cover orchards (Fig. 7c and Fig. 7d) experienced more frequent episodes of substantial stress than the medium and high cover orchards.
DISCUSSION
This study, for the first time, compares the transpiration and water stress dynamics in 12 apple orchards of different age groups planted to different cultivars that are commonly planted in the Mediterranean and subtropical regions. Golden Delicious, including its bud mutation, like Golden Delicious Reinders, is the most widely planted cultivar accounting for at least 24% of the area under apple trees in South Africa (Hortgro, 2018). The blushed cultivars, on the other hand, e.g., Cripps' Pink, Cripps' Red and Rosy Glow are high-value, long-season (late harvest) cultivars and their fruit remain on the trees for about 2 months longer than the Golden Delicious. Because of their late harvest, it is widely believed that these orchards also have high water demands.
However, this study showed that the late harvest had no significant effect on the seasonal total transpiration by the orchards. The high canopy cover Golden Delicious/Golden Delicious Reinders orchards were harvested mid- to endMarch while the Cripps' Pink (and its mutations) orchards were harvested in late April for each of the seasons. It is evident from Table 5 that there were no significant differences between the two cultivars in the contribution of the March to end-of-season (June) transpiration, suggesting that there was no incremental water use by the Cripps' Pink due to the late presence of the fruit. Consistent with the observations of Dzikiti et al. (2018a, b), canopy cover during the growing season was the main driver of water use in apple orchards, although other studies, e.g., Naor et al. (1997) suggested that in similarly sized mature canopies, crop load was the main factor determining apple orchard water use. Therefore, growers should carefully manage the canopy size to reduce orchard water use.
Apple cultivars whose fruit are susceptible to sunburn damage, e.g., Golden Delicious and Granny Smith, tend to have denser canopies and vigorous shoot growth is tolerated to protect the fruit from high solar radiation (Mupambi et al., 2018). In South Africa, for example, sunburn damage in apples is estimated to lead to an average of around 29% yield loss over a period of 10 years (Gindaba and Wand, 2007; Makeredza et al., 2013). As a result, farmers take extra measures to minimize yield losses, e.g., by maintaining higher shade levels for susceptible cultivars using denser canopies, and more frequent irrigation during hot dry weather when sunburn damage risk is highest (Mupambi, 2017). Cultivars with relatively more open canopies to maximize light penetration in order to promote the development of the red fruit colour, such as the Cripps' Pink, are known to be less susceptible to sunburn due to the late maturation (Makeredza et al., 2013).
This study, which used commercial orchards, also suggests that there are no significant differences in the water use characteristics of Golden Delicious/Golden Delicious Reinders and Cripps' Pink/Cripps' Red/Rosy Glow considering variables such as the sap flux density and transpiration per unit leaf area. It appears that the effect of cultivar on tree water use is significantly less than that of canopy cover for field-grown trees. Our findings, however, contradict those of Massonet et al. (2007) who observed significant differences in water use rates between the Braeburn and Fuji cultivars. One approach to obtain conclusive evidence on the cultivar effects on orchard water use, at least for the cultivars studied here, is to perform comparative studies, e.g., with trees of similar canopy size planted in pots maintained with similar soil conditions. This is the subject of our ongoing research and these results will be reported in a future manuscript.
The sap flux density was highest in the medium canopy cover trees and reasons for this trend are unclear. A possible explanation is the existence of a higher proportion of older xylem vessels in the older apple trees which reduces the average sap velocity according to Cermak and Nadezhdina (1998). The low sap flux density in the low canopy cover orchards could be attributed to the small leaf area of the trees since canopy cover seemed to have a significant effect on the sap flux density. The occurrence of periods of sustained water stress in the low canopy cover orchards may also have contributed to the lower seasonal average sap flux density.
The transpiration coefficients (Kt) differed widely between orchards depending on many factors. For example, high canopy cover Cripps' Pink and Golden Delicious orchards had different mid-season Kt values, not because of the differences in the physiology of the cultivars, but because of differences in canopy management practices which influenced orchard transpiration rates. In the high canopy and some of the medium cover Cripps' Pink orchards in KBV, the decline in mid-season transpiration and hence the Kt values could probably be attributed to waterlogging, given the high irrigation levels in those orchards. All four of these orchards were planted on deep sandy soils. However, the high canopy and medium cover Cripps' Pink in EGVV planted on heavier soils that maintained high soil water content did not experience the mid-season decline in the Kt values.
In this study low canopy cover orchards appeared to experience more frequent water stress than the medium cover and/or mature orchards. This can be explained firstly as a consequence of the drought that affected the Western Cape region during the study period, with farmers having to prioritize productive orchards in terms of water allocation. While the sap flow derived transpiration reduction coefficient (Ksf) has been evaluated in citrus orchards, we are not aware of any studies that have applied this index in apple orchards of different age groups. Here we show that the K is a more sensitive indicator of water stress, capable of detecting either water deficit or excess irrigation that leads to waterlogging. The soil-based FAO56 transpiration reduction coefficient posed a limitation in that it was not able to detect orchard stress due to excessive irrigation.
CONCLUSION
This study showed that canopy cover had a clear effect on the measured parameters, i.e., sap flux density, and the daily transpiration rates. It appears that there were no significant differences in the transpiration rates between the cultivars, so canopy management is critical to achieving water savings. Besides canopy cover, other factors such as crop load may also have a significant effect on the water use dynamics, although this aspect was not presented in this paper. Growers should carefully manage the canopies to reduce orchard water use. This can be done by preventing excessive vigour, e.g., by using dwarfing rootstocks or through shoot thinning and spraying shoot growth retardants such as Regalis. Alternatively, apple producers may also consider growing sunburn-susceptible cultivars such as Golden Delicious/Golden Delicious Reinders under shade nets where they can be maintained with less dense open canopies on dwarfing rootstocks and likely with lower incidences of sunburn damage.
ACKNOWLEDGEMENTS
We acknowledge financial support from the Water Research Commission ((WRC Report No. TT 751/18)), with additional funding from the South African Apples and Pears Producers Association (SAAPPA), the South African Parliamentary grant to the CSIR (project no ECHS043) and the National Research Foundation, Professional Development Programme (NRF-PDP). Cooperation by the Dutoit Agri Group in Ceres, Radyn and Southfield farms in Villiersdorp and the Crookes Brothers (Vyeboom and Dennebos farms) in Vyeboom who allowed us to use their productive orchards for our experiments, are also gratefully acknowledged. We also thank the following individuals for assistance with data collection at various stages of the project: Dr Mark Gush, Dr Nicolette Taylor, and Mr Qamani Doko.
REFERENCES
ALLEN RG, LUIS SP, RAES D and SMITH M (1998) FAO Irrigation and Drainage Paper No. 56. Crop Evapotranspiration (guidelines for computing crop water requirements). Irrig. Drain. 300 (56) 300. https://doi.org/10.1016/j.eja.2010.12.001 [ Links ]
ALLEN RG and PEREIRA LS (2009) Estimating crop coefficients from fraction of ground cover and height. Irrig. Sci. 28 (1) 17-34. https://doi.org/10.1007/s00271-009-0182-z [ Links ]
ANNANDALE JG, STIRZAKER RJ, SINGELS A, VAN DER LAAN M and LAKER MC (2011) Irrigation scheduling research: South African experiences and future prospects. Water SA 37 (5) 751-764. https://doi.org/10.4314/wsa.v37i5.12 [ Links ]
BATCHELOR C, REDDY VR, LINSTEAD C, DHAR M, ROY S and MAY R (2013) Do water-saving technologies improve environmental flows? J. Hydrol. 518 140-149. http://doi.org/10.1016/j.jhydrol.2013.11.063 [ Links ]
BURGESS SSO, ADAMS MA, TURNER NC, BEVERLY CR, ONG CK, KHAN AAH and BLEBY TM (2001) An improved heat pulse method to measure low and reverse rates of sap flow in woody plants. Tree Physiol. 21 (9) 589-598. https://doi.org/10.1093/treephys/2L9.589 [ Links ]
CAMMALLERI C, RALLO G, AGNESE C, CIRAOLO G, MINACAPILLI M and PROVENZANO G (2013) Combined use of eddy covariance and sap flow techniques for partition of et fluxes and water stress assessment in an irrigated olive orchard. Agric. Water Manage. 120 (1) 89-97. https://doi.org/10.1016/j.agwat.2012.10.003 [ Links ]
CERMAK J and NADEZHDINA N (1998) Sapwood as the scaling parameter - Defining according to xylem water content or radial pattern of sap flow? Annal. Sci. For. 55 (5) 509-521. https://doi.org/10.1051/forest:19980501 [ Links ]
DWA (Department of Water Affairs, South Africa) (2013) National Water Resource Strategy. Water for an Equitable and Sustainable Future. June 2013 Second Edition. URL: http://www.dwa.gov.za/documents/Other/Strategic%20Plan/NWRS2-Final-email-version.pdf (Accessed 25 June 2017). [ Links ]
DZIKITI S, VERREYNNE JS, STUCKENS J, STREVER A, VERSTRAETEN WW, SWENNEN R and COPPIN P (2010) Determining the water status of Satsuma mandarin trees [Citrus Unshiu Marcovitch] using spectral indices and by combining hyperspectral and physiological data. Agric. For. Meteorol. 150 (3) 369-379. https://doi.org/10.1016/j.agrformet.2009.12.005 [ Links ]
DZIKITI S, GUSH MB, TAYLOR NJ, VOLSCHENK T, MIDGLEY S, LÖTZE E, SCHMEISSER M and DOKO Q (2017) Measurement and modelling of water use by high yielding apple orchards and orchards of different age groups in the winter rainfall areas of South Africa. Acta Hort. 1150 31-38. https://doi.org/10.17660/ActaHortic.2017.1150.5 [ Links ]
DZIKITI S, VOLSCHENK T, MIDGLEY SJE, LÖTZE E, TAYLOR NJ, GUSH MB, NTSHIDI Z, ZIREBWA SF, DOKO Q, SCHMEISSER M, and co-authors (2018a) Estimating the water requirements of high yielding and young apple orchards in the winter rainfall areas of South Africa using a dual source evapotranspiration model. Agric. Water Manage. 208 152-162. https://doi.org/10.1016/j.agwat.2018.06.017 [ Links ]
DZIKITI S, VOLSCHENK T, MIDGLEY S, GUSH M, TAYLOR N, LOTZE E, ZIREBWA S, NTSHIDI Z, MOBE N, SCHMEISSER M, and co-authors (2018b) Quantifying water use and water productivity of high performing apple orchards of different canopy sizes. Report to the Water Research Commission. URL: http://www.topfruit.co.za/wp-content/uploads/2018/07/2018-Dzikiti-Quantifying-water-use-by-high-performing-appleorchards-in-the-winter-rainfall-areas-of-South-Africa.pdf (Accessed 24 June 2018). [ Links ]
FERERES E, GOLDHAMER D, SADRAS V, SMITH M, MARSAL J, GIRONA J, NAOR A, GUCCI R, CALIANDRO A and RUZ C (2012) Yield response to water of fruit trees and vines: guidelines. In: Crop yield response to water. Irrigation and drainage paper 66. Food and Agriculture Organization of the United Nations, Rome. URL: http://www.fao.org/3/a-i2800e.pdf (Accessed 26 August 2018). 246-295. [ Links ]
GINDABA J and WAND SJE (2007) Do fruit sunburn control measures affect leaf photosynthetic rate and stomatal conductance in 'Royal Gala' apple? Environ. Exp. Bot. 59 (2) 160-165. https://doi.org/10.1016/j.envexpbot.2005.11.001 [ Links ]
GIRONA J, DEL CAMPO J, MATA M, LOPEZ G and MARSAL J (2011) A comparative study of apple and pear tree water consumption measured with two weighing lysimeters. Irrig. Sci. 29 (1) 55-63. https://doi.org/10.1007/s00271-010-0217-5 [ Links ]
GRANIER A (1987) Evaluation of transpiration in a Douglas-fir stand by means of sap flow measurements. Tree Physiol. 3 (4) 309-320. URL: http://www.ncbi.nlm.nih.gov/pubmed/14975915 [ Links ]
HORTGRO (2015) Fresh notes 'Irrigation guidelines for deciduous fruit trees. URL: https://www.hortgro.co.za/wp-content/uploads/2016/02/Fresh-Notes-113-October-2015Water-Shortage.pdf (Accessed 15 May 2017). [ Links ]
HORTGRO (2018) Key deciduous fruit statistics. URL: https://www.hortgro.co.za/wp-content/uploads/docs/2019/08/2018-stats-booklet_key-deciduous_web-pdf-revised.pdf (Accessed 20 January 2019). [ Links ]
JONES HG (2004) Irrigation scheduling: advantages and pitfalls of plant-based methods. J. Exp. Bot. 55 (407) 2427-2436. https://doi.org/10.1093/jxb/erh213 [ Links ]
JONES HG (2008) Irrigation scheduling - comparison of soil, plant and atmosphere monitoring approaches. Acta Hort. 792 391-403. https://doi.org/10.17660/ActaHortic.2008.792.46 [ Links ]
MAKEREDZA B, SCHMEISSER M, LÖTZE E and STEYN WJ (2013) Water stress increases sunburn in 'Cripps' Pink' apple. HortScience 48 (4) 444-447. https://doi.org/10.21273/HORTSCI.48.4.444 [ Links ]
MASSONNET C, COSTES E, RAMBAL S, DREYER E and REGNARD JL (2007) Stomatal regulation of photosynthesis in apple leaves: Evidence for different water-use strategies between two cultivars. Ann. Bot. 100 (6) 1347-1356. https://doi.org/10.1093/aob/mcm222 [ Links ]
MIDGLEY SJE, NEW M, METHNER N, COLE M, CULLIS J, DRIMIE S, DZAMA K, GUILLOT B, HARPER J, JACK C, and co-authors (2016) A Status quo review of climate change and the agriculture Sector of the Western Cape Province. Report Submitted to the Western Cape Department of Agriculture and the Western Cape Department of Environmental Affairs & Development Planning. African Climate and Development Initiative, University of Cape Town, Cape Town. [ Links ]
MUPAMBI G (2017) Water relations and sunburn in apple fruit. PhD thesis, Stellenbosch University. [ Links ]
MUPAMBI G, SCHMEISSER M, DZIKITI S, REYNOLDS S and STEYN WJ (2018) Ineffectiveness of foliar S-ABA application as an apple sunburn suppressant explained through effects on peel biochemistry and leaf ecophysiology. Sci. Hort. 232 256-263. https://doi.org/10.1016/j.scienta.2018.01.021 [ Links ]
NAOR A, KLEIN I, DORON I, GAL Y, BEN-DAVID Z and BRAVDO B (1997) Irrigation and crop load interactions in relation to apple yield and fruit size distribution. J. Am. Soc. Hort. Sci. 122 (3) 411-414. https://doi.org/10.21273/JASHS.122.3.411 [ Links ]
OTHMAN Y, VANLEEUWEN D, HEEREMA R and ST. HILAIRE R (2019) Midday stem water potential values needed to maintain photosynthesis and leaf gas exchange established for pecan. J. Am. Soc. Hort. Sci. 139 (5) 537-546. https://doi.org/10.21273/jashs.139.5.537 [ Links ]
SCHOLANDER PF, BRADSTREET ED, HEMMINGSEN E and HAMMEL H (1965) Sap pressure in vascular plants; negative hydrostatic pressure can be measured in plants. Science 148 339-346. http://dx.doi.org/10.1126/science.148.3668.339 [ Links ]
SWANSON RH and WHITFIELD DWA (1981) {A} numerical analysis of heat pulse velocity and theory. J. Exp. Bot. 32 (1) 221-239. URL: http://dx.doi.org/10.1093/jxb/32.L221 [ Links ]
VOLSCHENK T, DE VILLIERS J and BEUKES O (2003) The selection and calibration of a model for irrigation scheduling of deciduous fruit orchards. WRC Report No. 892/1/03. URL: http://www.wrc.org.za/wp-content/uploads/mdocs/892-1-03.pdf (Accessed 30 July 2017). Water Research Commission, Pretoria. [ Links ]
VOLSCHENK T (2017) Evapotranspiration and crop coefficients of Golden Delicious/M793 apple trees in the Koue Bokkeveld. Agric. Water Manage. 194 184-191. https://doi.org/10.1016/j.agwat.2017.09.002 [ Links ]
WULLSCHLEGER SD and KING AW (2000) Radial variation in sap velocity as a function of stem diameter and sapwood thickness in yellow-poplar trees. Tree Physiol. 20 (8) 511-518. https://doi.org/10.1093/treephys/20.8.511 [ Links ]
ZIMMERMANN U, RÜGER S, SHAPIRA O, WESTHOFF M, WEGNER LH, REUSS R, GESSNER P, ZIMMERMANN G, ISRAELI Y, ZHOU A, and co-authors (2010) Effects of environmental parameters and irrigation on the turgor pressure of banana plants measured using the non-invasive, online monitoring leaf patch clamp pressure probe. Plant Biol. 12 (3) 424-436. https://doi.org/10.1111/j.1438-8677.2009.00235.x [ Links ]
 Correspondence:
Nompumelelo Thelma Mobe
Email: Tmobe@csir.co.za; mpumelelomobe@gmail.com
Received: 10 December 2018
Accepted: 30 March 2020

