


Services on Demand
Article
 English (pdf)
 Article in xml format
 Article references
Indicators

Related links
-
 Cited by Google
 -
 Similars in Google
Share

 Permalink
Water SA
On-line version ISSN 1816-7950
Print version ISSN 0378-4738
Water SA vol.46 n.2 Pretoria Apr. 2020
http://dx.doi.org/10.17159/wsa/2020.v46.i2.8233
RESEARCH PAPER
Verification of runoff volume, peak discharge and sediment yield simulated using the ACRU model for bare fallow and sugarcane fields
Daniel OtimI, V; Jeff SmithersI, III; Aidan SenzanjeI; Rianto van AntwerpenII, IV
IAgricultural Engineering, School of Engineering, College of Agriculture, Engineering and Science, University of KwaZulu-Natal, Pietermaritzburg, South Africa
IISouth African Sugarcane Research Institute, Mount Edgecombe, South Africa
IIINational Centre for Engineering in Agriculture, University of Southern Queensland, Toowoomba, Australia
IVDepartment of Soil, Crops and Climate Sciences, University of the Free State, PO Box 339, Bloemfontein 9300, South Africa
VDepartment of Agricultural Mechanisation and Irrigation Engineering, Busitema University, PO Box 236, Tororo, Uganda
ABSTRACT
The Agricultural Catchments Research Unit (ACRU) model is a daily time step physical-conceptual agrohydrological model with various applications, design hydrology being one of them. Model verification is a measure of model performance and streamflow, soil water content and sediment yield simulated by the ACRU model have been extensively verified against observed data in southern Africa and internationally. The primary objective of this study was to verify simulated runoff volume, peak discharge and sediment yield against observed data from small catchments, under both bare fallow conditions and sugarcane production, which were located at La Mercy in South Africa. The study area comprised 4 research catchments, 101, 102, 103 and 104, monitored both under bare fallow conditions and sugarcane production, with different management practices per catchment. Observed data comprised: daily rainfall, maximum and minimum temperature, A-pan evaporation and runoff for the period 1978-1995, and peak discharge and sediment yield for the period 1984-1995. The data were checked for errors and and inconsistent records excluded from analysis. Runoff volume, peak discharge and sediment yield were simulated with the ACRU model and verified against the respective observed data. In general, the correlations between observed and simulated daily runoff volumes and peak discharge were acceptable (i.e. slopes of regression lines close to unity, R2 > 0.6 and the Nash-Sutcliffe coefficient of efficiency close to unity). Similarly, the correlation between observed and simulated sediment yield was also good. From the results obtained, it is concluded that the ACRU model is suitable for the simulation of runoff volume, peak discharge and sediment yield from catchments under both bare fallow and sugarcane land cover in South Africa.
Keywords: ACRU, bare fallow, peak discharge, sediment yield, streamflow, sugarcane
INTRODUCTION
The Agricultural Catchments Research Unit (ACRU) model is a daily time step, physical-conceptual agrohydrological model (Schulze, 1975; Schulze et al., 1995; Smithers and Schulze, 1995; Smithers et al., 1996). In addition, the ACRU model is not an optimising model and parameters are estimated from physical characteristics of catchments. It is a multi-purpose model with application in design hydrology, crop yield modelling, reservoir yield simulation, irrigation water demand and supply, and assessment of climate change, land use and management impacts (Schulze et al., 1995; Jewitt and Schulze, 1999). The ACRU model, together with simulated outputs such as streamflow, soil water content and sediment yield, has been extensively verified against observed data in southern Africa and internationally (Schulze, 2011). To verify is to determine the correctness of simulated output through comparison with observed data, hence model verification is a measure of the model's performance (Schulze, 2011). Model verification can be in terms of either absolute output values or in terms of the relative sequences and orders of magnitude of output responses (Lumsden et al., 2003). For simulations using a daily time-step model to be acceptable, the absolute difference between the sum of simulated streamflow and the sum of observed streamflow should be less than 10%, the slope of the regression line of simulated vs observed values should be close to unity and the minimum acceptable coefficient of determination (R2) should be 0.60 (Schulze and Smithers, 1995). However, model goodness-of-fit is better evaluated by the Nash-Sutcliffe coefficient of efficiency (NSE) (Nash and Sutcliffe, 1970) than the R2 because R2 is insensitive to additive and proportional differences between model simulations and observations (Harmel et al., 2014). The NSE is a normalised statistic from which the relative magnitude of the residual variance compared to the measured data variance is determined (Nash and Sutcliffe, 1970). The NSE shows how well the plot of observed against simulated data fits the 1:1 line, with NSE values close to unity corresponding to a perfect match of the model to the observed data (AgriMetSoft, 2019). In addition, model performance is examined based on its ability to generate reasonable key statistics like percentiles and extreme values (Rashid et al., 2015), and maintain similarities in shapes and distributions of peaks between observed and simulated values (Kim et al., 2014). Continuous assessment of the accuracy and sensitivity of models is vital in the prioritisation of model structure modifications and the identification of more efficient parameterisations (Merritt et al., 2003).
The results reported in this paper are a component of a wider study whose aim is to develop updated design norms for soil and water conservation structures in the sugar industry in South Africa. The nomograph for the design of soil and water conservation structures in the sugar industry in South Africa was developed by Platford (1987), who used long-term annual soil loss simulated using the Universal Soil Loss Equation (USLE). However, erosion occurs on an event basis and Platford (1987) did not conduct any verification on the USLE prior to development of the nomograph. Therefore, the objective of this paper was to verify the runoff volume, peak discharge and sediment yield simulated by the ACRU model against observed data at the La Mercy catchments in South Africa, under both bare fallow and sugarcane land cover conditions and with various management practices.
Simulation of stormflow volume, peak discharge and sediment yield in the ACRU model
The following sections contain brief overviews of the simulation of stormflow volume, peak discharge and sediment yield used in the ACRU model.
Stormflow volume
Stormflow is the runoffthat is produced from a particular rainfall event, either at or close to the surface in a catchment, and which contributes to stream discharge within that catchment (Schulze, 2011). The response of a catchment to runoff from rainfall events depends on interactions between rainfall intensity, antecedent soil moisture conditions and land cover (Smithers et al., 1996; Maher, 2000). Estimation of stormflow in the ACRU model is based on a modified SCS procedure which employs daily rainfall input as the driving mechanism (Schmidt et al., 1987). The algorithm employed by the ACRU model in the estimation of stormflow is shown in Eq. 1 (Schmidt et al., 1987; Schulze, 1995).

where
Qs
= stormflow depth (mm),
Pg = gross daily precipitation amount (mm),
Ia = initial abstraction prior to stormflow commencement (mm), and
S = potential maximum soil water retention (mm).
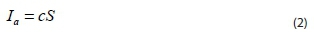
The initial abstraction prior to stormflow commencement, I (mm) is a product ofthe coefficient of initial abstraction, (c) and potential maximum soil water retention (S), as shown in Eq. 2.
The storage capacity of a soil and the depth of the underlying layers impact on the timing and magnitude of the flood response to precipitation (Royappen, 2002). Hence, the lower the storage capacity and the shallower the subsurface soil depth limiting layers, the higher the potential flood magnitude and intensity. The effective depth of soil used in the ACRU model for stormflow generation (SMDDEP) attempts to account for various streamflow-generating processes resulting from varying climate, vegetation and soil conditions (Royappen, 2002). However, the SMDDEP variable is difficult to quantify and it has generally been estimated through experience/ calibration, with default values suggested to the ACRU model user (Rowe, 2015).
Peak discharge
Peak discharge is an important variable in the estimation of sediment yield from a catchment (Schulze, 2011). The peak discharge from a given catchment is linked to the stormflow volume from that catchment; thus the accurate estimation of the stormflow volume is of prime importance in the determination of peak discharge (Schmidt and Schulze, 1984). The equation used in the simulation of peak discharge by the ACRU model from a catchment employs the SCS triangular-shaped unit hydrograph approach (Schulze and Schmidt, 1995) and represents the stormflow hydrograph for an incremental unit depth of stormflow occurring in a unit increment of time, as shown in Eq. 3 (Schulze et al., 2004).

where
Δqp = peak discharge of incremental unit hydrograph (m3-s-1)
ΔQ = incremental storm flow depth (mm)
A = catchment area (km2)
L = catchment lag time (h)
ΔD = incremental time duration (h)
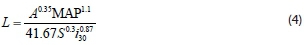
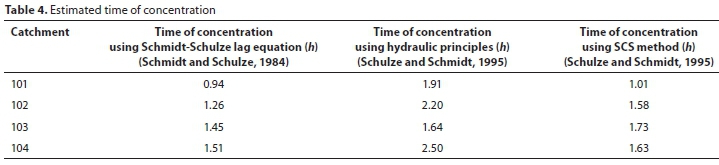
There are three options for estimating the catchment lag time in ACRU, of which the Schmidt-Schulze lag equation is preferred for use within natural catchments in South Africa (Schmidt and Schulze, 1984; Schulze et al., 1992). The catchment lag time, L (h) is determined from catchment area, A (km2), 2-year return period 30-min rainfall intensity, i30 (mm-hr1), mean annual precipitation, MAP (mm), and average catchment slope, S (%), as shown in Eq. 4 (Schmidt and Schulze, 1984).
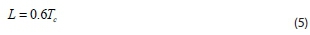
The catchment lag time, L (h) is related to the catchment time of concentration, T (h), as shown in Eq. 5 (Schulze and Schmidt, 1995).
Sediment yield
Sediment yield in the ACRU model is simulated using the Modified Universal Soil Loss Equation (MUSLE) (Williams, 1975), which is an empirical equation derived from the Universal Soil Loss Equation (USLE) (Wischmeier and Smith, 1965; Wischmeier and Smith, 1978) through replacement ofthe rainfall erosivity factor with a storm flow factor (Lorentz and Schulze, 1995). The MUSLE is used in the estimation of sediment yield arising from a specific storm event (Hui-Ming and Yang, 2009). The event sediment yield, Ysd(t) is determined from stormflow volume for the event, Qv (m3), event peak discharge, qp(m3-s-1), soil erodibility factor, K (t-h-N-1-ha-1), slope length factor, L, slope steepness factor, S, cover management factor, C, supporting practices factor, P, and location-specific MUSLE coefficients, asy,ßsy, as shown in Eq. 6 (Hui-Ming and Yang, 2009).

DATA AND METHODS
Study area
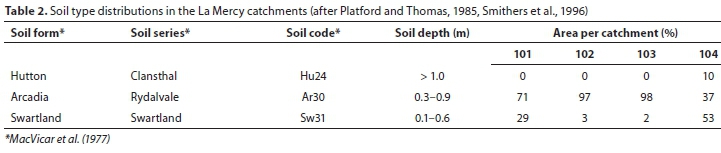
The study area is located at La Mercy, 28 km north of Durban, South Africa, on the site that now hosts the King Shaka International Airport. The research catchments were established by the South African Sugarcane Research Institute (SASRI), formerly South African Sugar Experiment Station (SASEX), and were monitored under bare cover and various sugarcane management practices. There were 4 small catchments numbered from south to north (Platford and Thomas, 1985), with Catchment 101 the southernmost catchment and Catchment 104 the northernmost catchment (Maher, 1990). However, it was impossible to maintain all four catchments completely and constantly under bare fallow conditions due to weeds, and the catchments were occasionally ploughed (Platford and Thomas, 1985). The layout of the catchments is shown in Fig. 1 and the catchment characteristics and soil types are summarised in Table 1 and Table 2, respectively.

Data
Daily observed rainfall and runoff depths, checked for errors with clarification of probable inconsistencies in observed data between catchments, and collated into the ACRU composite hydrometeorological data file format, were extracted from studies conducted by Smithers et al. (1996). Some records from major storms resulting from Cyclone Domoina in early 1984 and the September 1987 floods were lost due to equipment failure (Platford, 1988; Maher, 1990). Platford and Thomas (1985) and Maher (1990) further noted that sampling equipment were frequently washed away or completely silted up, thereby leading to a lack of records under bare fallow conditions, while Haywood (1991) noted that measuring equipment were poorly calibrated. Furthermore, storms which occurred after harvesting would cause residue to block the entrance of measuring flumes, hence resulting in reduced flows captured by the collecting tanks. Theft and vandalism of the intensity gauges was also a big problem and a number of records from the automatic recorders were affected (Maher, 1990). In addition, various sediment yield records were incomplete and Maher (1990) only analysed 4 events of complete sediment yield records.
The available data comprises of daily observed rainfall and runoff for the period 1978-1995, peak discharge for the period 1984-1995 and daily maximum and minimum temperature and A-pan data for the period 1978-1995. Historical information on the management practices at the La Mercy catchments for the period 1978-1988 was also obtained from studies reported by Haywood (1991).
Model verification and performance
Smithers et al. (1996) used Eqs 1, 3 and 6 embedded in the ACRU model to simulate stormflow, peak discharge and sediment yield, respectively, from the La Mercy catchments under bare fallow conditions and sugarcane production. The ACRU model was found to be generally suitable in the investigation of the effect of sugarcane production on water resources, despite some inadequacies in the simulation of stormflow, peak discharge and sediment yield. As part of the verification undertaken in this study, daily rainfall was further quality controlled and used as input into the ACRU model to simulate stormflow, peak discharge and sediment yield and the results compared against respective observed events that were considered to be reliable. Inconsistencies in the records that were excluded from verifications included events with:
(i) runoff volumes equal to zero but with rainfall greater than or equal to 25 mm
(ii) rainfall depth equal to zero but runoff volume greater than zero
(iii) peak discharge values for which either rainfall depth or runoff volume was missing
(iv) sediment yield records for which no runoff volume was available
The inconsistent events are listed in Otim (2018) while the methodology used in refining model verification is presented in the subsequent sections.
Simulation and verification of daily runoff volume
The ACRU variables used in the simulation of runoff volume from the La Mercy catchments were obtained from Smithers et al. (1996) and the Sugarcane Decision Support System (SCDSS) documented in the same report. The relevant ACRU variables are shown in Table 3 and runoff simulated using Eq. 1. The performance of the ACRU model was then assessed by comparing the simulated runoff depth to the observed runoff depth.
Simulation and verification of daily peak discharge
In this study, Type 2 rainfall intensity distribution (Schulze et al., 2004) was used and simulation of daily peak discharge was conducted using the SCS triangular-shaped incremental unit hydrograph approach shown in Eq. 3. The lag time was estimated using the Schmidt-Schulze lag equation shown in Eq. 4 and these lag times were converted into time of concentration (T), as shown in Table 4. Tc calculated from lag estimated by the hydraulic principles and the SCS method (Schulze and Schmidt, 1995) are included for comparative purposes. Simulated runoff volume obtained using Eq. 1 was used as input to simulate peak discharge. The simulated peak discharge values were then verified through comparisons with observed peak discharges.
Simulation and verification of daily sediment yield
Simulation of daily sediment yield was driven by the simulated stormflow volumes and simulated peak discharges using Eq. 6 embedded in the ACRU model. The various MUSLE parameters (i.e. K, L, S and P) representing conditions and practices at the La Mercy catchments were estimated wherever possible using an appropriate level of data requirement, as outlined by Lorentz and Schulze (1995), while the dynamic C factors were obtained from Smithers et al. (1996). The K factor was estimated using the Level 1 input option which determines the soil erodibility class from the binomial classification of the soil, the LS factor was also estimated using the Level 1 input option (limited information on catchment available) which relates the LS factor to the slope gradient, and the P factor was estimated using the Level 3 input option which takes into account contouring, strip cropping, terracing and subsurface drainage. The C factors were taken from studies conducted by Smithers et al. (1996) with the assumption that the C factor for sugarcane at full canopy was 0.01 and after harvesting was 0.60, and that full canopy is achievable in 5 months for cane harvested in the summer months and 6 months for cane harvested during winter. The K factors were area-weighted according to soil properties and area covered, C factors were dynamically varied according to the stage of growth and harvesting practice, and constant LS and P factors were employed since they do not vary. The parameters used in the simulation of sediment yield are shown in Table 5 while the dynamically varying cover factors (C) for sugarcane are shown in Table 6.
RESULTS AND DISCUSSION
In this section, the results of simulations and verification of runoff, peak discharge and sediment yield for the La Mercy catchments are presented and discussed.
Verification of runoff volume
A discussion of runoff verification under both bare fallow and sugarcane cover conditions is presented below. The parameters used in the verification were obtained as outlined above.
Bare fallow conditions
A discussion of runoff verification results under bare fallow conditions for each of the La Mercy catchments is presented below.
Catchment 101
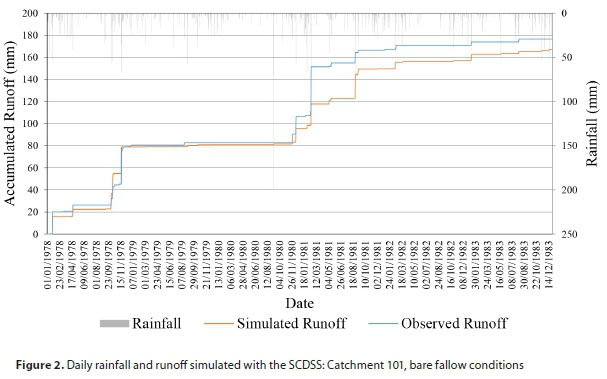
Daily values under bare fallow conditions from Catchment 101 are presented in Fig. 2 while the simulated vs observed, and frequency distribution plots, are shown in Figs 3a and 3b, respectively. The linear regression statistics and the NSE which indicate how well the daily stormflow depth was simulated are shown in Fig. 3a.
As shown in Fig. 2, simulation of runoff from Catchment 101 under bare fallow conditions resulted in an overall under-simulation of 5.5% over the period simulated, which is generally good. In addition, the scatter around the 1:1 line was relatively good, with runoff generally under-simulated as indicated in Figs 3a and 3b, respectively. It is hypothesised that the general under-simulation of runoff could be due to a random error in the measurement of large runoff volumes.
Catchment 102
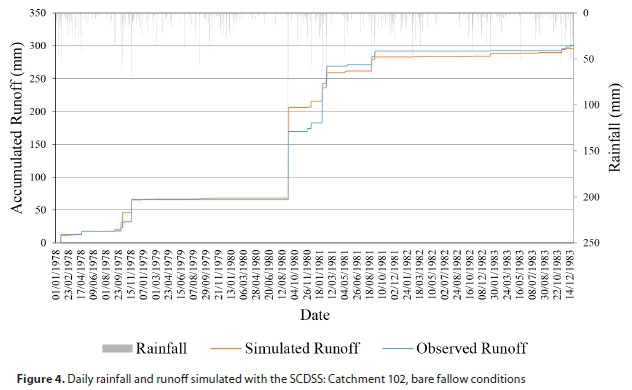
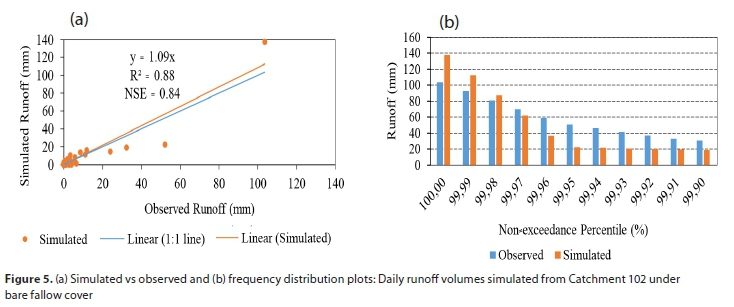
Catchment 102 daily values under bare fallow conditions are shown in Fig. 4, while the simulated vs observed plots with the regression statistics and frequency distribution plots are shown in Figs 5a and 5b, respectively.
For Catchment 102 under bare fallow conditions, runoff simulation was generally good and resulted in an overall under-simulation of 1.6% as shown in Fig. 4. Additionally, the runoff relative sequences and orders of magnitude were reasonably simulated, as shown in the same figure, and the simulations were acceptable as shown by the regression statistics and the NSE in Fig. 5a; large runoff volumes were generally over-simulated while small runoff volumes were under-simulated as shown in Fig. 5b. The over- and under-simulations could be attributed to random errors in the measurement of daily runoff volumes.
Catchment 103
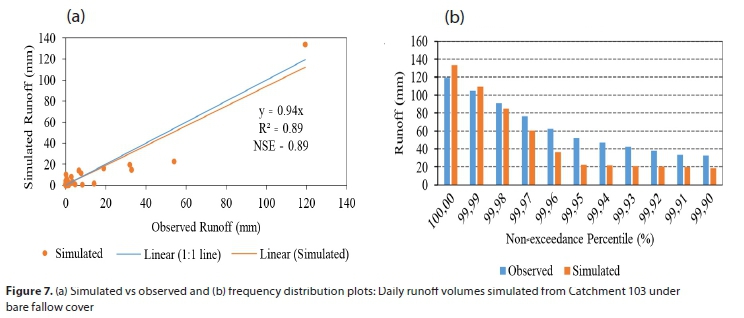
The daily values for Catchment 103 under bare fallow conditions are shown in Fig. 6, while the linear regression plots with the statistics and the frequency distribution plots are shown in Figs 7a and 7b, respectively.
From Fig. 6, it is evident that the simulation resulted in an overall under-simulation of 7.8%, which was good. Furthermore, an acceptable model fit between observed and simulated daily runoff exists, as shown by the regression statistics in Fig. 7a, and the large daily runoff volumes were over-simulated while the small runoff volumes were under-simulated as shown in Fig. 7b. Similar to Catchment 102, the over- and under-simulations could be attributed to random errors in the measurement of daily runoff volumes.
Catchment 104
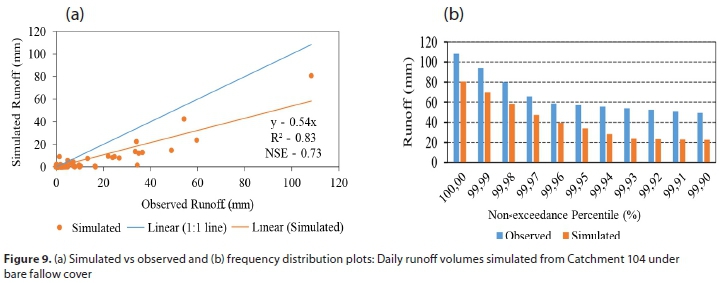
The daily values for Catchment 104 under bare fallow conditions are shown in Fig. 8, while the simulated vs observed plots, together with the regression statistics and frequency distribution plots, are shown in Figs 9a and 9b, respectively.
As shown in Fig. 8, runoff simulation resulted in a consistent under-simulation, and the scatter around the 1:1 line was fairly good as shown by the regression statistics in Fig. 9a; runoff volume was consistently under-simulated as shown in Fig. 9b. It was initially suspected that the consistent under-simulation could be attributed to the soil variables and parameter selections shown in Table 3, but a scrutiny of the parameters showed they were justifiably selected. Further comparisons between observed and simulated runoff volumes showed that runoff was generally under-simulated by 40%. Hence, it is suspected that the general under-simulation of runoff could be due to a systematic error in the measurement of runoff volumes, caused by poor calibration of measuring equipment as documented by Haywood (1991). Scaling the observed runoff by a factor of 40% greatly improved the verifications, as shown in Fig. 10.

Sugarcane cover conditions
The discussion of runoff verification results under sugarcane cover conditions for each of the La Mercy catchments is presented below.
Catchment 101
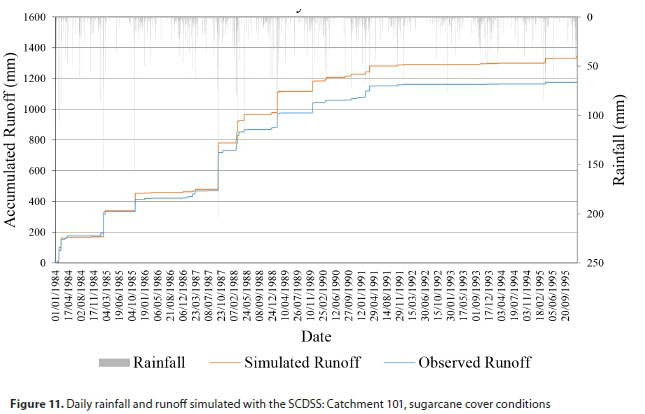
Catchment 101 daily values under sugarcane land cover are shown in Fig. 11, while the linear regression plots with the statistics and the frequency distribution plots are shown in Figs 12a and 12b, respectively.
Generally, runoff simulated from Catchment 101 resulted in an over-simulation for the period as shown in Fig. 11 and represents an overall over-simulation of 14.5%. The association between observed and simulated runoff was acceptable, as indicated by the regression statistics and the NSE in Fig. 12a, and runoff was consistently over-simulated as shown by the frequency plots in Fig. 12b. The general over-simulation of runoff volume could be attributed to random errors in the measurement of daily runoff volumes.
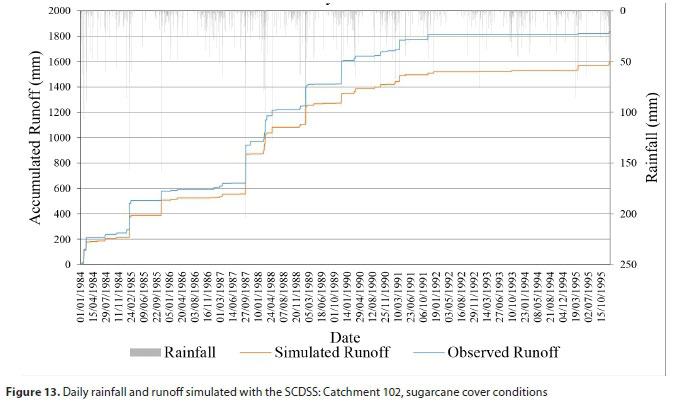
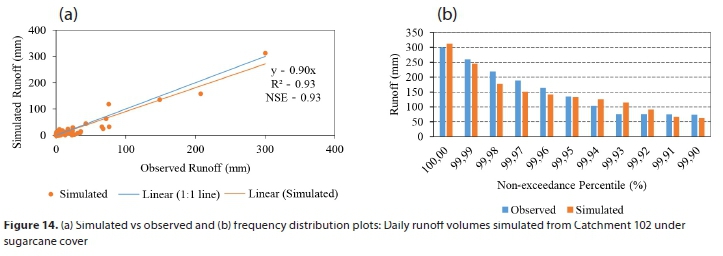
Catchment 102
Catchment 102 daily values under sugarcane land cover are shown in Fig. 13 while the linear regression plots together with the statistics and frequency distribution plots are shown in Figs 14a and 14b, respectively.Simulation of daily runoff generally resulted in a close relationship between observed and simulated runoff, as shown in Fig. 13, and gave rise to an overall under-simulation of 13.1%. The general scatter of the simulated runoff around the 1:1 line is also acceptable as indicated by the regression statistics and the NSE in Fig. 14a, with some under-and over-simulations as shown in Fig. 14b. The under- and over-simulation of runoff volumes could be attributed to similar reasons to those cited under Catchment 101.
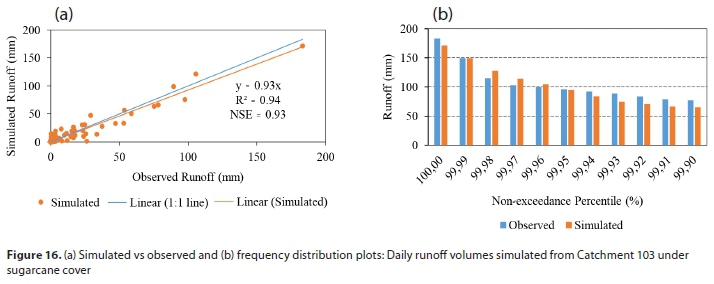
Catchment 103
Catchment 103 daily values under sugarcane land cover are shown in Fig. 15, while the linear regression plots and statistics and frequency distribution plots are shown in Figs 16a and 16b, respectively.
Runoff simulation generally gave rise to an over-simulation for the period as shown in Fig. 15, with an overall over-simulation of 0.5%. In addition, the general plot around the 1:1 line is acceptable, as indicated by the regression statistics and the NSE in Fig. 16a, and the frequency distribution closely related as shown in Fig. 16b. However, both under- and over-simulations exist and this could be attributed to the same reasons discussed under Catchment 101.
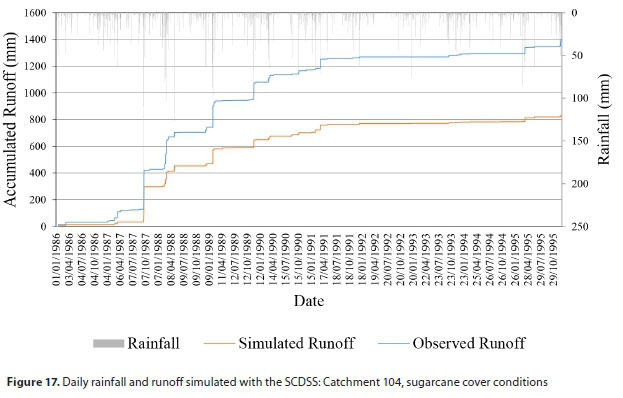
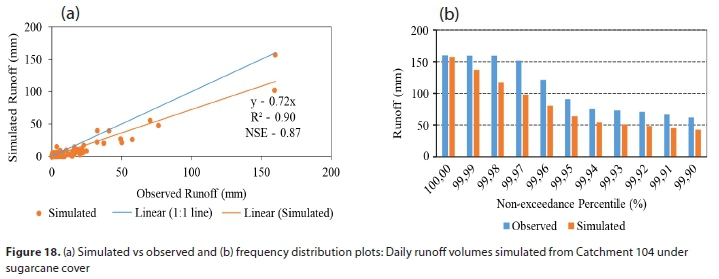
Catchment 104
Catchment 104 daily values under sugarcane land cover are shown in Fig. 17, while the linear regression plots and statistics and frequency distribution plots are shown in Figs 18a and 18b, respectively.Use of the SCDSS parameters to simulate runoff resulted in a consistent under-simulation, with an overall under-simulation of 40.8% as shown in Fig. 17. However, the general plot around the 1:1 line was reasonably good, as shown by the regression statistics and the NSE in Fig. 18a and runoff was consistently under-simulated as shown in Fig. 18b. The consistent under-simulation could be attributed to random errors in the measurement of daily runoff volumes.
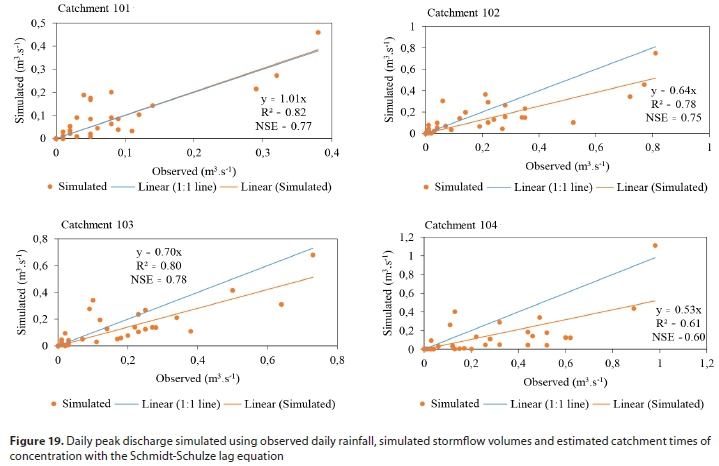
Verification of daily peak discharge
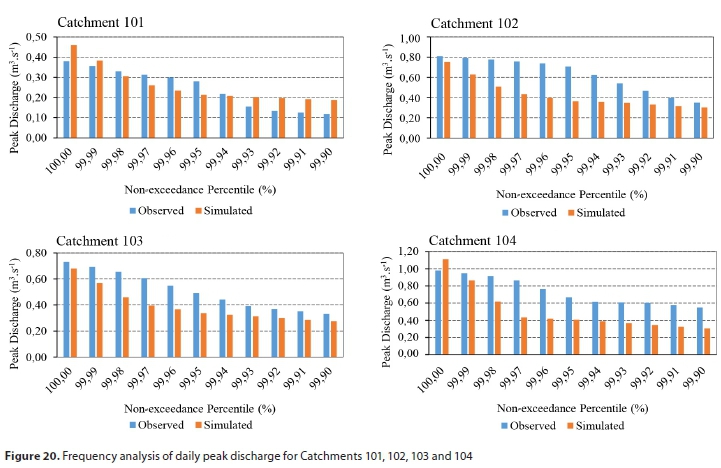
Verification of daily peak discharge was only conducted under sugarcane land cover since there was no observed peak discharge data available under bare fallow conditions. The results are summarised and presented in Fig. 19. The trends exhibited by simulated peak discharges shown in Fig. 19 are related to trends exhibited by simulated runoffvolumes under each catchment and this confirms that runoff volume is a driver of peak discharge. Furthermore, the association between observed and simulated peak discharge across all four catchments is reasonably good, as indicated by the regression statistics and the NSE in Fig. 19, and the trends in frequency distribution of simulated and observed peak discharge are also closely associated as shown in Fig. 20. Similar to runoff volume trends, the under- and over-simulations of peak discharge could be attributed to random errors in the measurement of daily peak discharge values.
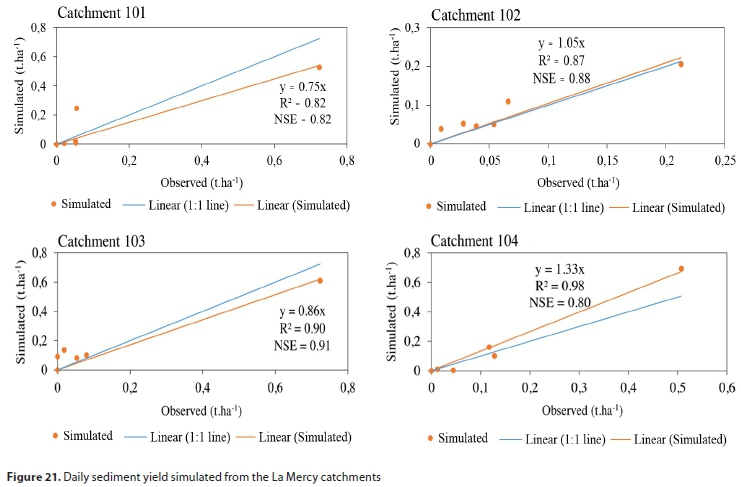
Verification of daily sediment yield
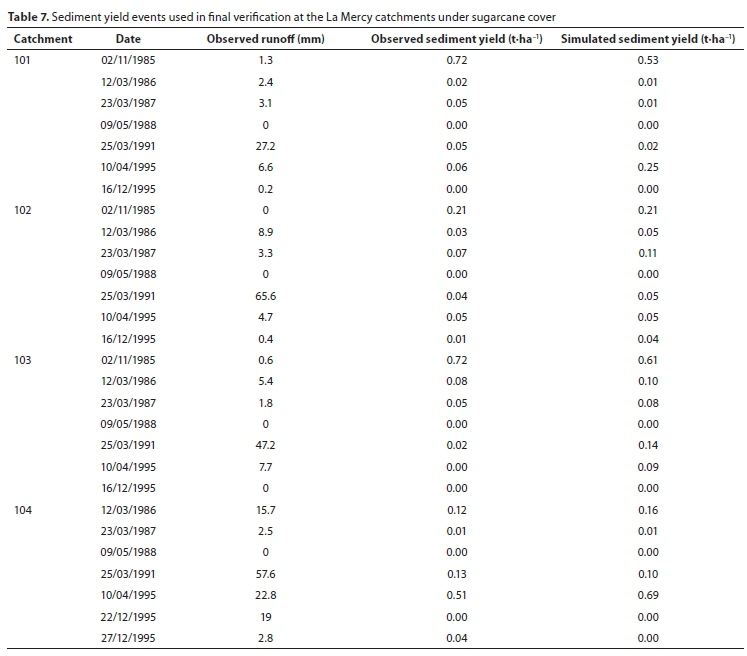
Similar to daily peak discharge, daily sediment yield was verified under sugarcane land cover conditions since there were no observed sediment yield data available under bare fallow conditions. Considering that many sediment yield records were incomplete, only events documented by Maher (1990), together with a few consistent events, were used in the verifications. The results are presented in Fig. 21 and the discussions follow thereafter. The correlation between simulated and observed sediment yield events was reasonably good, as shown by the regression statistics and the NSE in Fig. 21; the events used in the verication are shown in Table 7.
CONCLUSIONS
Generally, the relative sequences and orders of magnitude of runoff from the La Mercy catchments were reasonably simulated under both bare fallow and sugarcane land cover conditions. In addition, the correlations between observed and simulated runoff volumes were reasonably good as depicted by the regression statistics and the NSE. Under bare fallow conditions, slopes of the regression lines were 0.72, 1.09, 094 and 0.54 for Catchments 101, 102, 103 and 104, respectively, while the respective R2 coefficients were 0.73, 0.88, 0.89 and 0.83. On the other hand, the NSE were 0.73, 0.84, 0.89 and 0.73 for Catchments 101, 102, 103 and 104, respectively. For sugarcane land cover conditions, slopes of the regression lines were 1.23, 0.90, 0.93 and 0.72 for Catchments 101, 102, 103 and 104, respectively, while the respective R2 coefficients were 0.97, 0.93, 0.94 and 0.90. The NSE for Catchments 101, 102, 103 and 104 under similar conditions were 0.89, 0.93, 0.93 and 0.87, respectively. However, over- and under-simulations were evident and these could be attributed to random errors in the measurement of daily runoff volumes, except for Catchment 104 under bare fallow conditions where it is suspected that systematic errors could have occurred in the measurement of daily runoff volumes.
Simulation and verification of peak discharge was only conducted under sugarcane land cover because there were no observed peak discharge data available under bare fallow conditions. The trends exhibited by simulated daily peak discharges were similar to trends exhibited by simulated daily runoff volumes under each catchment, thereby confirming that runoff volume drives peak discharge. In addition, the association between observed and simulated peak discharge across all four catchments is acceptable, as indicated by the regression statistics. The slopes of the regression lines are 1.01, 0.64, 0.70 and 0.53 for Catchments 101, 102, 103 and 104, respectively, while the respective R2 coefficients were 0.82, 0.78, 0.80 and 0.61. The NSE for Catchments 101, 102, 103 and 104 were 0.77, 0.75, 0.78 and 0.60, respectively. Nonetheless, incidences of over- and under-simulations were evident and these could be attributed to similar reasons to those cited under verification of runoff volumes.
Similar to daily peak discharge, daily sediment yield was verified under sugarcane land cover conditions because there were no observed sediment yield data available under bare fallow conditions. Due to the fact that various sediment yield records were incomplete, only events documented by Maher (1990), together with a few consistent events, were used in the verifications. The association between simulated and observed sediment yield events was reasonably good. The slopes of the regression lines were 0.75, 1.05, 0.86 and 1.33 for Catchments 101, 102, 103 and 104, respectively, while the respective R2 coefficients were 0.82, 0.87, 0.90 and 0.98. The NSE for Catchments 101, 102, 103 and 104 were 0.82, 0.88, 0.91 and 0.80, respectively.
Based on the results of this study, it is concluded that the ACRU model, together with the parameter inputs from the SCDSS and Smithers et al. (1996), are suitable in the simulation of runoff volume, peak discharge and sediment yield from catchments under both bare fallow and sugarcane land cover and with various management practices in South Africa.
In addition, the SCS equation, the Schmidt-Schulze lag equation and the various assumptions and levels of data requirements presented under the verification of daily sediment yield should be employed in simulations of runoff volume, peak discharge and sediment yield. Therefore, the ACRU model can be applied with confidence in the development of updated design norms for soil and water conservation structures in the sugar industry in South Africa.
ACKNOWLEDGEMENTS
South African Sugarcane Research Institute (SASRI) is gratefully acknowledged for availing resources for this research. Appreciation is also extended Mr SLC Thornton-Dibb for technical guidance on the setting up and application of the ACRU model.
REFERENCES
AGRIMETSOFT (2019) Online calculators. https://agrimetsoft.com/calculators/Nash%20Sutcliffe%20model%20Efficiency%20coefficient: (Accessed 01 January 2020). [ Links ]
HARMEL R, SMITH P, MIGLIACCIO K, CHAUBEY I, DOUGLAS-MANKIN K, BENHAM B, SHUKLA S, MUNOZ- CARPENA R and ROBSON BJ (2014) Evaluating, interpreting, and communicating performance of hydrologic/water quality models considering intended use: A review and recommendations. Environ. Model. Softw. 57 40-51. https://doi.org/10.1016Ai.envsoft.2014.02.013 [ Links ]
HAYWOOD RW (1991) Model evaluation for simulating runoff from sugarcane fields. MScEng Dissertation, University of Natal, Pietermaritzburg, RSA. [ Links ]
HUI-MING S and YANG CT (2009) Estimating overland flow erosion capacity using unit stream power. Int. J. Sediment Res. 24 (1) 46-62.https://doi.org/10.1016/S1001-6279(09)60015-9 [ Links ]
JEWITT GPW and SCHULZE RE (1999) Verification of the ACRU model for forest hydrology applications. Water SA 25 (4) 483-490. [ Links ]
KIM K, WHELAN G, PURUCKER ST, BOHRMANN TF, CYTERSKI MJ, MOLINA M, GU Y, PACHEPSKY Y, GUBER A and FRANKLIN DH (2014) Rainfall-runoff model parameter estimation and uncertainty evaluation on small plots. Hydrol. Process. 28 (20) 52205235. https://doi.org/10.1002/hyp.10001 [ Links ]
LORENTZ SA and SCHULZE RE (1995) Sediment yield. In: Schulze RE (ed.) Hydrology and Agrohydrology: A Text to Accompany the ACRU 3.00 Agrohydrological Modelling System. Department of Agricultural Engineering, University of Natal, Pietermaritzburg, RSA. [ Links ]
LUMSDEN TG, JEWITT GPW and SCHULZE RE (2003) Modelling the impacts of land cover and land management practices on stream flow reduction. WRC Report No. 1015/1/03. Water Research Commission, Pretoria. 80 pp. [ Links ]
MACVICAR CN, DE VILLIERS JM, LOXTON RF, VERSTER E, LAMBRECHTS JJN, MERRYWEATHER FR, LE ROUX J, VAN ROOYEN TH and HARMSE HJVM (1977) Soil classification. A binomial system for South Africa. Department of Agricutural Development, Pretoria. [ Links ] .
MAHER GW (1990) Phase two of the small catchment project at La Mercy. In: Proceedings of South Africa Sugar Technologists' Association, June 1990, Durban, RSA. [ Links ]
MAHER GW (2000) Research into soil and water losses from sugarcane fields in South Africa - A review. In: Int Soc Sug Cane Technol Agronomy Workshop, December 2000, Miami, USA. [ Links ]
MERRITT WS, LETCHER RA and JAKEMAN AJ (2003) A review of erosion and sediment transport models. Environ. Model. Softw. 18 (8) 761-799. https://doi.org/10.1016/S1364-8152(03)00078-1 [ Links ]
MORGAN RPC (2005) Soil Erosion and Conservation. Blackwell Publishing, Malden. 304 pp. [ Links ]
NASH JE and SUTCLIFFE JV (1970) River flow forecasting through conceptual models: part I. A discussion of principles. J. Hydrol. 10 (3) 282-90. https://doi.org/10.1016/0022-1694(70)90255-6 [ Links ]
OTIM D (2018) Development of updated design norms for soil and water conservation structures in the sugar industry of South Africa. PhDEng draft thesis, School of Engineering, University of KwaZulu-Natal, Pietermaritzburg. [ Links ]
PLATFORD GG (1987) A new approach to designing the widths of panels in sugarcane fields. In: Proceedings of South Africa Sugar Technologists' Association, June 1987, Mount Edgecombe, RSA. [ Links ]
PLATFORD GG (1988) Protection against flood damage. In: Proceedings of South Africa Sugar Technologists' Association, June 1988, Durban. [ Links ]
PLATFORD GG and THOMAS CS (1985) The small catchment project at La Mercy. In: Proceedings of South Africa Sugar Technologists' Association, June 1985, Durban. [ Links ]
RASHID MM, BEECHAM S and CHOWDHURY RK (2015) Statistical characteristics of rainfall in the Onkaparinga catchment in South Australia. J. Water Clim. Change 6 (2) 352-373. https://doi.org/10.2166/wcc.2014.031 [ Links ]
ROWE TJ (2015) Development and assessment of rules to parameterise the ACRU model for design flood estimation. MScHydrology dissertation, Pietermaritzburg, RSA. [ Links ]
ROYAPPEN M (2002) Towards improved parameter estimation in streamflow predictions using the ACRU model. MScHydrology dissertation, Pietermaritzburg, RSA. [ Links ]
SASRI (1998) Information Sheet 4.10: Minimum tillage. SASEX, Mount Edgecombe, RSA. [ Links ]
SCHMIDT EJ and SCHULZE RE (1984) Improved estimates of peak flow rates using modified SCS lag equations. WRC Report No. TT 31/87. Water Research Commission, Pretoria. 145 pp. [ Links ]
SCHMIDT EJ, SCHULZE RE and DENT MC (1987) Flood volume and peak discharge from small catchments in Southern Africa based on the SCS technique. WRC Report No. TT 31/87. Water Research Commission, Pretoria. 164 pp. [ Links ]
SCHULZE RE (1975) Catchment evapotranspiration in the Natal Drakensberg. PhD thesis, University of Natal, Pietermaritzburg. [ Links ]
SCHULZE RE (1995) Streamflow. In: Schulze RE (ed.) Hydrology and Agrohydrology: A Text to Accompany the ACRU 3.00 Agrohydrological Modelling System. Department of Agricultural Engineering, University of Natal, Pietermaritzburg. [ Links ]
SCHULZE RE (2011) A 2011 Perspective on climate change and the South African water sector. WRC Report No. 1843/2/11. Water Research Comission, Pretoria. 366 pp. [ Links ]
SCHULZE RE, ANGUS GR, LYNCH SD and SMITHERS JC (1995) ACRU: Concepts and structure. In: Schulze RE (ed.) Hydrology and Agrohydrology: A Text to Accompany the ACRU 3.00 Agrohydrological Modelling System. Department of Agricultural Engineering, University of Natal, Pietermaritzburg. [ Links ]
SCHULZE RE and SCHMIDT EJ (1995) Peak discharge. In: Schulze RE (ed.) Hydrology and Agrohydrology: A Text to Accompany the ACRU 3.00 Agrohydrological Modelling System. Department of Agricultural Engineering, University of Natal, Pietermaritzburg. [ Links ]
SCHULZE RE, SCHMIDT EJ and SMITHERS JC (1992) PC based SCS design flood estimates for small catchments in Southern Africa. ACRU Report 40. Department of Agricultural Engineering, University of Natal, Pietermaritzburg. 47 pp. [ Links ]
SCHULZE RE, SCHMIDT EJ and SMITHERS JC (2004) Visual SCS - SA User Manual Version 1.0: PC based SCS design flood estimates for small catchments in Southern Africa. ACRUcons Report No. 52. School of Bioresources Engineering and Environmental Hydrology, University of KwaZulu-Natal, Pietermaritzburg. [ Links ]
SCHULZE RE and SMITHERS JC (1995) Procedures to improve and verify streamflow simulations. In: Smithers JC and Schulze RE (ed.) ACRU Agrohydrological Modelling System: User Manual Version 3.00. Department of Agricultural Engineering, University of Natal, Pietermaritzburg. [ Links ]
SMITHERS J and SCHULZE R (1995) ACRU Agrohydrological Modelling System User Manual. Department of Agricultural Engineering, University of Natal, Pietermaritzburg, RSA. 374 pp. [ Links ]
SMITHERS JC, MATHEWS P and SCHULZE RE (1996) The simulation of runoff and sediment yield from catchments under sugarcane production at La Mercy. ACRUcons Report No. 13. Department of Agricultural Engineering, University of Natal, Pietermaritzburg. 104 pp. [ Links ]
TANYAÇ H, KOLAT Ç and SÜZEN ML (2015) A new approach to estimate cover-management factor of RUSLE and validation of RUSLE model in the watershed of Kartalkaya Dam. J. Hydrol. 528 584-598. https://doi.org/10.1016/j.jhydrol.2015.06.048 [ Links ]
WILLIAMS JR (1975) Sediment-yield prediction with universal equation using runoff energy factor. In: ARS-S (ed.) Present and Prospective Technology for Predicting Sediment Yields and Sources. Southern Region, Agricultural Research Service, U.S. Department of Agriculture, New Orleans, USA. [ Links ]
WISCHMEIER WH and SMITH DD (1965) Rainfall erosion losses from cropland east of the rocky mountains. In: Guide for Selection of Practices for Soil and Water Conservation. Agricultural Handbook No. 282. USDA, Washington D.C. [ Links ]
WISCHMEIER WH and SMITH DD (1978) Predicting Rainfall Erosion Losses - A guide to Conservation Planning. USDA, Washington D.C., USA. 63 pp. [ Links ]
 Correspondence:
Daniel Otim
Email: danotim@gmail.com
Received: 1 April 2019
Accepted: 3 April 2020

