


Services on Demand
Article
 English (pdf)
 Article in xml format
 Article references
Indicators

Related links
-
 Cited by Google
 -
 Similars in Google
Share

 Permalink
Water SA
On-line version ISSN 1816-7950
Print version ISSN 0378-4738
Water SA vol.46 n.2 Pretoria Apr. 2020
http://dx.doi.org/10.17159/wsa/2020.v46.i2.8232
RESEARCH PAPER
Calibration of a modelling approach for sediment yield in a wattle plantation, KwaZulu-Natal, South Africa
BC Scott-ShawI; TR HillII; JS GillhamII
IDiscipline of Hydrology, School of Agricultural, Earth and Environmental Sciences, University of KwaZulu-Natal, Pietermaritzburg Campus, South Africa
IIDiscipline of Geography, School of Agricultural, Earth and Environmental Sciences, University of KwaZulu-Natal, Pietermaritzburg Campus, South Africa
ABSTRACT
Hydrological modelling is an appropriate approach to investigate the effect of interactions of climate, land-use and soil on the water-use of natural or managed ecosystems, in particular where spatial heterogeneity exists. The Soil and Water Assessment Tool (SWAT) model has evolved into one of the most widely used catchment-scale hydrological models, which has been extensively used to better understand hydrological processes. In this paper, the SWAT model was adopted to simulate a wattle plantation in KwaZulu-Natal, South Africa. User-defined vegetation growth, soil and management input parameters were constructed for the study area based on site measurements. These parameters were subsequently modified using the Sequential Uncertainty Fitting (SUFI-2) analysis routine to calibrate the model. The calibrated model captured seasonal trends in the observed sediment and streamflow data. The compilation of spatially explicit sediment output provides a useful approach to manage catchments by identifying high erosion-risk areas. The SWAT model, using site-specific input parameters, provides a platform for subsequent hydrological and sediment modelling in South Africa.
Keywords: commercial plantations, modelling, sediment yield, surface run-off, SWAT
INTRODUCTION
Hydrological models used in water-use studies need to find a balance between simplicity and reliability, while at the same time predicting the impacts of land and water management alternatives at an appropriate regional scale (Le Maitre et al., 2002; Everson et al., 2007). Arguably one of the most important components of a scientific simulation model is that it should be easy to understand in light of their assumptions and mechanisms represented in the simulation, so that critical evaluations can be made of the predictions (Thornley, 1998). Model complexity is a major determinant of which model is selected, as the input data available, time constraints and budget all influence model selection. Furthermore, the level of detail on processes, spatial disaggregation and temporal disaggregation should be considered (Schulze et al., 1995).
According to Schulze et al. (1995), models of differing complexity range from simple formulae to complex physiologically based models. The advantage of simple models is that simple and readily obtainable inputs are required to provide estimations (Schulze et al., 1995). Simple models cannot be expected to provide a detailed estimation, but rather are course, large-scale depictions; however, they should not be used for extrapolation of estimates under different conditions from the ones under which these models were developed (Schulze et al., 1995). More complex models can provide accurate estimates of hydrological components in comparison to simple models, provided that quality information is readily available and time and money are not limited. 'The development of complex models from the processes of analysis, assembly of data, model construction and validation, take up costly resources in the form of skilled expert hours and computer time' (Schulze et al., 1995 p. AT19-3).
In South Africa, models such as the Agricultural Catchments Research Unit (ACRU), the Soil Water Assessment Tool (SWAT), Systeme Hydrologique Europeen (SHE) model group and WAVES have been applied. Given the high level of spatially complex data available for land under commercial plantations, the recent development of the ArcSWAT GIS interface and the advantage that sediment transport forms a major component of the model, SWAT was selected as the most appropriate model for this study.
The Soil and Water Assessment Tool (SWAT) model has emerged as one of the most widely used water quality watershed- and river basin-scale models, applied extensively for a broad range of hydrologic and/or environmental problems (Gassman et al., 2007; Gassman et al., 2014). SWAT is a conceptual continuous time model developed in the early 1990s, to assist in water resource management, and to assess the impact of management and climate on water supplies and non-point-source pollution in watersheds and large river basins (Arnold and Fohrer, 2005). Recently SWAT has been applied in tropical regions of Africa (Easton et al., 2010; Schuol et al., 2008), Asia (Thampi et al., 2010; Wagner et al., 2011), and Latin America (Strauch et al., 2013). It is physically based, uses readily available inputs and is computationally efficient to operate on large catchments over extended time periods (Everson et al., 2007). The SWAT model has an extension to Arcview and ArcGIS, which has increased the versatility of the model, and this spatial component makes it attractive for modelling hydrological components. The broad use of SWAT can be attributed to its flexibility in addressing water resource problems, extensive networking via training workshops and international conferences that have been held during the past decade, comprehensive online documentation and supporting software, and an open-source code that can be adapted by model users for specific application needs (Gassman et al., 2014).
Although the SWAT model has been used in various catchments of South Africa, it has had limited applications as a teaching tool and for consultants. Most of the work undertaken has formed part of larger research projects, with validations of yields demonstrating a strong correlation to measured values (Zabalet et al., 2014; Almendinger et al., 2014; Beeson et al., 2014). However, the primary limitation is of the availability of measured sediment and nutrient values.
This paper aims to answer the following questions:
(i) Is the ArcSWAT model an appropriate tool to use for a summer rainfall, sub-tropical catchment in South Africa?
(ii) Can the SWAT model be customized for South African conditions?
(iii) What model inputs and outputs are easily accessible or need to be measured in South Africa for sediment yield simulations?
(iv) Can the model be calibrated using observed data and what do we need to achieve this - in terms of data collection, validation, calibration and correction?
SWAT model
The input required for ArcSWAT is spatially explicit soils data, land use/management information, and elevation data to drive flows and direct sub-basin routing (Arnold, 2005). SWAT integrates the parameters into hydrologic response units (HRU), effectively over-riding the underlying spatial distribution. These HRUs are grouped according to the topography, soils (type/ structure/depth/chemical properties), land use and slope.
The SWAT model uses the water balance equation (Eq. 1) in its simulation of the hydrological cycle (Arnold et al., 2009):

where SWt is the final soil water content (mm); SW0the initial soil water content on Day i (mm); Rday: being the precipitation on Day i (mm); Qsurf the surface runoff on Day i (mm); Ea the total evaporation on Day i (mm); Wseep the water entering the vadose zone on Day i (mm) and Qgw the return flow on Day i (mm).
One of the primary drivers of SWAT is the meteorological input data, which has improved over recent years to allow for measured rainfall, solar radiation, wind speed, relative humidity and evaporation data. In addition, SWAT provides a compromise between empirical and physical algorithms, using a modified version of USLE (MUSLE) that is used to simulate water erosion (Borah and Bera, 2003).
Sediment yield modelling using SWAT
Soil erosion involves the detachment, transport and deposition of soil particles (including plant nutrients and organic matter) by water or wind. This process may be natural or accelerated by human interference in the environment (Tolosa, 2015). The amount of sediment leaving a site or catchment is a function of the erosional and depositional processes occurring above the discharge outlet. Sustainable land management and water resource security are threatened by soil erosion and sediment-related problems (Betrie et al., 2011). In response to such threats, there is an urgent need to estimate soil loss and identify problematic areas for improved catchment-based erosion control and sediment management strategies (Tolosa, 2015). However, soil erosion, transportation and deposition are highly variable both spatially and temporally, and are expensive to monitor accurately, resulting in limitations for calibration.
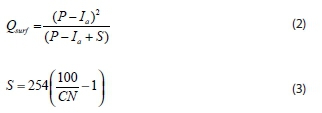
Erosion and sediment yield in SWAT are estimated for each HRU with the Modified Universal Soil Loss Equation (MUSLE) and Bagnold's equation to route the sediment loads (Winchell et al., 2013). The hydrology module supplies estimates of runoff volume and peak runoff rate, which, with the sub-basin area, are used to calculate the runoff erosive energy variable (Tolosa, 2015). The crop management factor is recalculated every day that runoff occurs. It is a function of above-ground biomass, residue on the soil surface, and the minimum crop factor for the plant. Surface runoff is calculated (Eqs 2 and 3) and is then used to calculate sediment yield (Eq. 4).

where
Qsurf= Surface runoff volume
qpeak = Peak runoff rate (m3-s-1)
Ahru = Area of the Hydrological Response Unit
K = USLE soil erodibility factor
C = USLE cover & management factor
P = USLE support practice factor
LS = USLE topographic factor
CFRG = Coarse fragment factor
Soil texture is an important component affecting soil erodibility. Output from the SWAT model can determine the texture of the load per day, which is usually composed of high silt levels and some clay, and, to a lesser extent, soil structure and permeability impact upon this component. This is particularly important for areas such as dirt roads, where compaction is high. The C factor (cover and management) reduces the soil loss estimate based on the effectiveness of vegetation and mulch to prevent detachment and transport of soil particles. Due to its strong sediment yield component, SWAT could be used to extrapolate sediment distribution throughout the catchment, identify vulnerable areas and promote best management practices. As such, it is considered a more suitable tool for agricultural management practices in watersheds of varying sizes, compared with other models (Nabi et al., 2017).
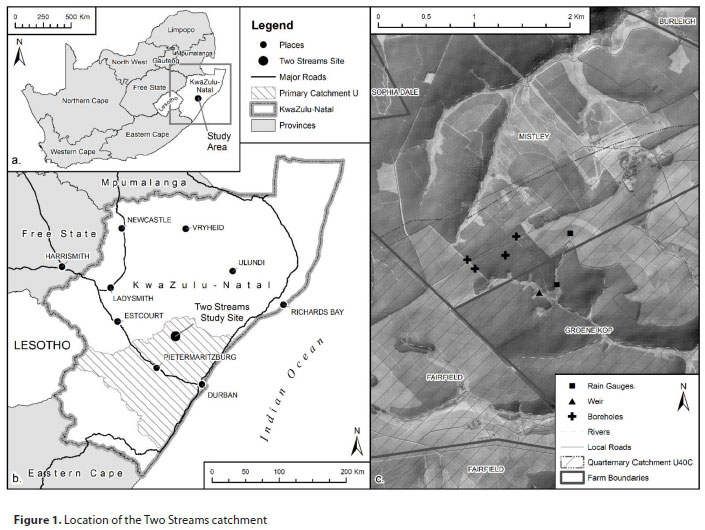
Study area
The Two Streams catchment is situated 70 km from Pietermaritzburg near Seven Oaks along the Greytown road (Fig. 1). The site falls within the catchment of the Khamanzi River and Quaternary Catchment U40C. The baseline vegetation type is classified as Midlands Mistbelt Grassland (Gs 9; Mucina and Rutherford, 2006; Scott-Shaw and Escott, 2011). The surrounding grasslands are dominated by forb-rich, tall, sour Themeda triandra grasslands, of which only a few patches remain due to invasion of native Aristida junciformis (Everson et al., 2007). The slope undulates along the landscape with rolling hills and a high percentage of arable land. Soil forms are a-pedal and plinthic and are derived predominately from the Ecca Group with dolerite dykes and sills (Everson et al., 2007). Rainfall is primarily in summer, with an annual rainfall ranging from 659 to 1 139 mm. Rain is most commonly from summer thunderstorms or cold fronts (Everson et al., 2007). Mist can be heavy and frequent and can add significantly to precipitation. Moderate frosts, droughts, hail and berg winds are common to the area (Mucina and Rutherford, 2006).
The SWAT model was used at Two Streams for the following reasons:
• Previous modelling work had been undertaken at the site using SWAT, ACRU and WAVES
• Much streamflow, soils, land use/management, climate, evaporation and ecological data are available for the site
• There are ongoing sediment load studies at the site, using runoff plots at different hillslope positions and land uses
• The data at the site are available and have been well documented
• The catchment area is small (76 ha) which reduces potential errors such as abstraction of water and uncertainty of larger scale variables such as total evaporation
• The commercial nature of the vegetation is suited to known model inputs for SWAT
METHODS
Catchment information has been collated for the Two Streams site and Quaternary Catchment (QC) U40C. This model is dependent on the resolution of the input data, in particular the digital elevation model (DEM). A large amount of manipulation is required for modelling outside of the United States; therefore, much of the time is spent translating data into suitable input data. An overview of the core input variables has been provided in Table 1.

Elevation and topography
A digital elevation model (DEM) is used to configure the catchment by dividing it into a sub-basin or sub-catchments. The automatic watershed delineation tool, which is the first step of the model, allows for the creation and selection of outlet nodes and the determination of sub-catchment properties and river reach attributes. Depending on the resolution of the DEM, either a manual or automatic setup can be chosen.
The 30 m Shuttle Radar Topography Mission (SRTM) 1 Arc-Second Global DEM was used as the starting point. The resolution of this DEM is 30 m by 30 m. However, this DEM does not provide accurate heights in areas of tall vegetation. Verified point and contour data were used to correct these errors and interpolate a higher resolution model. WGS 1984 UTM Zone 36S was used as the projection as SWAT requires all layers to be projected uniformly and UTM is the most commonly used projection for hydrological studies.
Land use
A combination of existing databases and user-defined boundaries were used to create a new land use shapefile. Given the small catchment size, gravel roads were included in the land use set-up, as they are likely to contribute to sediment and nutrient wash at the site. The land use definition tool was used in SWAT, this clips the land use to the catchment boundary and provides it with a user-defined code. A text file containing these codes and the subsequent SWAT land code was compiled by the user, which is used to reclassify the land use layer to match attributes contained in the SWAT database.
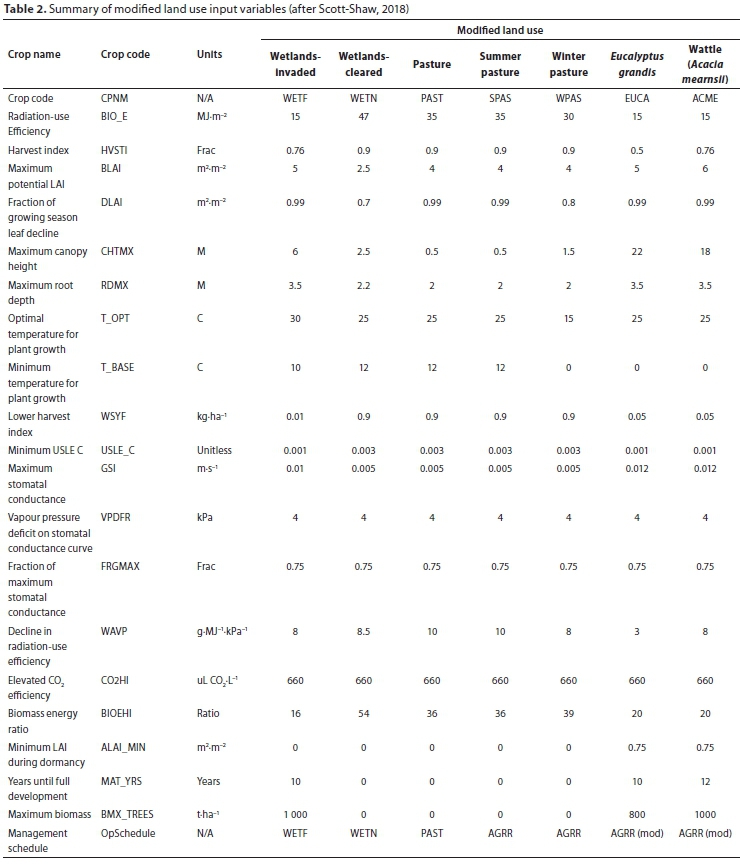
An important addition to this component was land uses that are either different in South Africa or that do not exist in the SWAT database. In this case, new land uses can be added to the SWAT database, either through the Access database file or through the user interface. The following changes have been made to the model database (further described in Table 2) to match South African conditions (after Scott-Shaw, 2018):
• Eucalyptus and Wattle have been modified to match South African species and hybrids grown in KwaZulu-Natal
• New parameters for summer and winter pasture (although not extensive at the site)
• A new parameter for wetlands invaded by commercial species
• A new parameter for cleared wetlands (natural grassland and sedge in this area) has been included
Soils
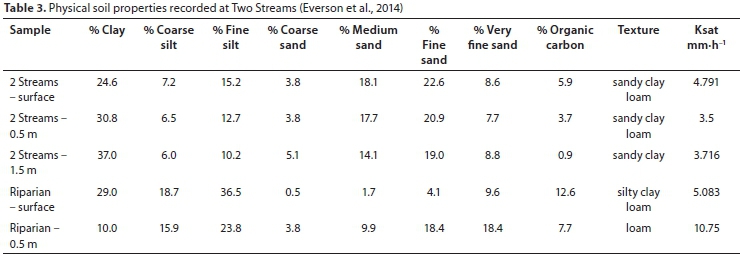
A soil survey was undertaken and further described by Le Roux et al. (2015), whilst Everson et al. (2014) documented detailed physical soil properties at the site which were combined with the available data (Table 3). The soil data were available as point form, and the terrain of the land was used to extrapolate these points to a spatially explicit area. Where available, the South African Soil Classification system (Soil Classification Working Group, 1991) was used to determine the soil form/family and to translate the information into SWAT required values. The soil hydrologic group (NRCS, 1996), structure, depth, number of layers, texture and saturated hydraulic conductivity were used to construct a spatial soil layer with up to five variable soil layers. The database (Usersoils) was edited with the attributes for each representative polygon code. A text file was used to code the data from the spatially explicit polygon to match the code in the database. Soils data were validated using the GIS interface and modified if required.
Soil properties that influence runoff generation are those that impact the minimum rate of infiltration for a bare soil after prolonged wetting and when not frozen (Everson et al., 2006). These properties are depth to seasonally high water table, saturated hydraulic conductivity, and depth to the permeable layer. Root activity at various depths were recorded during a previous study (Everson et al., 2014) (Fig. 2). The findings show that roots were active beyond 5 m, with the highest activity occurring at 4 m in October 2012. As such, soil profile depth and maximum root depth were maximized.

Slope
The slope definition uses the base DEM, and allows the user to define the slope classes. More slope classes would result in more HRUs. Once the user has chosen the slope classes, the layers are used to create the final HRUs. For this study, 5 slope classes were used, resulting in 189 HRUs.
Climate
Weather data definitions were modified to allow for user-defined data to be included. All the data were obtained from ongoing research at Two Streams. A table was created for each rainfall station, including the station ID, location and altitude. Individual text files containing daily rainfall, temperature, solar radiation, relative humidity and wind speed were created that could be linked to the modified database.
Management
Land management is crucial for hydrological simulations. The management operations were modified in SWAT to specify the initial growing state and periods during harvest, fallow lands and planting - as the model is not South African in origin we modified this to take account of local management practices.
Sediment yield
Observed sediment yield data has been ongoing at the research site. Nine 1 m x 1 m runoff micro-plots were installed within the catchment with 3 replicates per slope position (Fig. 3). An additional nine 5 m x 2 m runoff plots were installed adjacent to the micro-plots with 3 replicates per slope position (top, mid and bottom slope). The gutter fed into the outlet of the micro-plot, connected to a pipe, which fed into a bucket to capture the water. After each site visit, total overland flow volume from each micro-plot replicate was measured with a measuring cylinder and a 500 mL representative sample of the water collected. The sediment in the gutters was flushed down into the bucket with the sample water. Runoff plots are useful tools to evaluate interill erosion as they provide information on the impact that generated runoff flow has on sediment loss. (Chaplot and Le Bissonnais, 2003).
Sediment input components were modified within the model. A key component was the soils input. This, along with the climate input data, was a key determinant as to whether overland flow will be generated. Components such as management are also important and were interrogated through the model interface and the SWAT database.
Input summary
The final output for the Two Streams catchment, with an area of 0.75 km2, yielded 189 HRUs. The output for the greater Quaternary Catchment U40C (1662 HRUs) is provided (Fig. 4), which illustrates the high level of detail in the model.

RESULTS AND DISCUSSION
The results concentrate on improving model performance, particularly in the sediment yield component. A large component of this is calibration of the sub-models and input parameterisation. The simulation period was 11 years (using the maximum amount of climate data available) at a daily time step. The pre-calibration results suggested that the model was generally over-simulating the streamflow. This suggested an under-estimation of the vegetation water-use within the catchment, a limitation in the small catchment size or inaccurate input variables. Following the initial simulation, and once all the input data had been thoroughly checked, a model calibration was undertaken.
Sensitivity analysis
Model sensitivity is defined as the change in model output per unit change in parameter input (Tesfahunegn et al., 2012). After pre-processing of the required input for the SWAT model, flow simulations were performed for 11 years of recording periods starting from 1989 through 1999 and subsequently extended to 2014. Three years were used as a 'warm-up' period following which the simulation was used for a sensitivity analysis of hydrologic parameters and calibration of the model. The sensitivity analysis was performed using the standalone SWAT-CUP sensitivity analysis tool that uses the Latin Hypercube One-factor-At-a-Time (LH-OAT). After the analysis, the mean relative sensitivity of the parameters was used to rank the parameters (Table 4). The USLE support practice factor was the most sensitive input for sediment yield output.

Model calibration
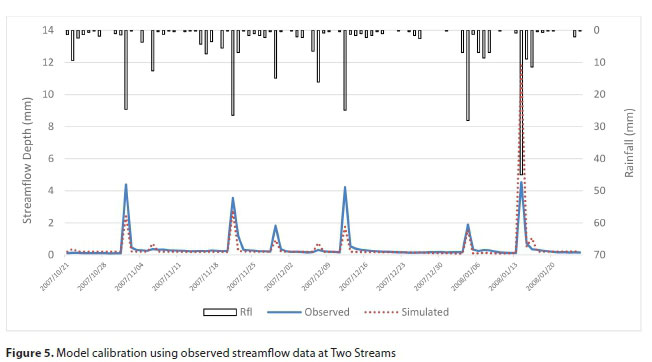
The aim of model calibration is to achieve a reduction in model uncertainty by efficiently extracting information contained in the calibration data. It involves the comparison of model simulation with observed data on predefined objective functions and adjusting parameters to improve closeness of fit. The SWAT model can be calibrated both manually and automatically. The manual calibration is the most widely used and involves visual comparison of observed and simulated data. SWAT-CUP was used to perform an automatic calibration using observed streamflow. Sequential uncertainty fitting was used as the statistical tool. The findings show a reasonable fit between the simulated and observed streamflow, although for peak events the model was under-simulating the streamflow. The post-calibration simulation (Fig. 5) provided an improved simulation; however, with some inconsistencies between peak events. This is likely due to the impact of land management, which is sensitive for such a small catchment area that is dominated by commercial agriculture. There were some missing streamflow records which were subsequently patched using the simulated data. The observed flow exceeded 4 mm or 0.035 m3-s-1 during peak rainfall events.
Observed sediment data were obtained for the site (Table 5). This showed a peak load of 26.94 g-m-2. These measurements are event-based measurements and indicate low sediment loads.

Annual water balance
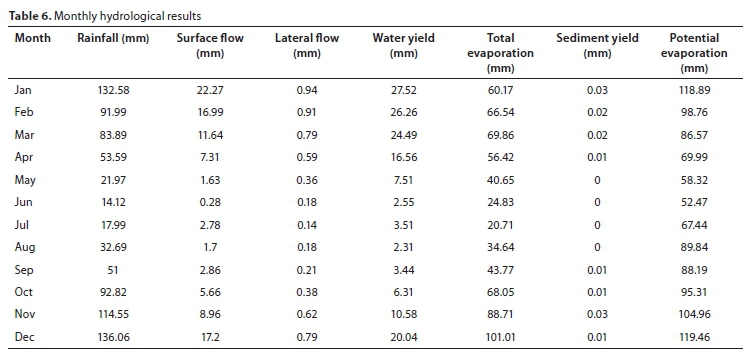
The annual water balance is the most summarized output from SWAT (Figs 6 and 7), providing a good visual representation as to how rainfall is partitioned through the hydrological cycle. The results show high amounts of total evaporation lost through the vegetation and surface evaporation. Some recharge to the shallow aquifer occurs and very little to the deep aquifer. Surface runoff in this area is high compared to the other contributions to streamflow, whilst the annual sediment balance suggests low sediment yields, possibly due to the small catchment size. These results provide an immediate indication as to whether there will be benefits from scenarios, particularly land management.

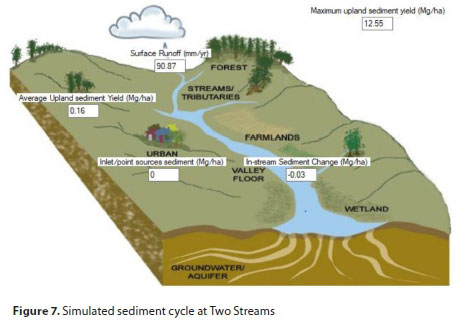
Table 6 provides an overview of the monthly hydrological components produced from this catchment. This table, along with the schematic of the hydrological cycle, indicate that catchment flow and sediment yield is low, possibly due to its small catchment area (0.75 km2). The total evaporation is high and exceeds the rainfall in the winter months.
The sediment cycle indicates that upland sediment yield is 11.01 Mg-ha-1. The in-stream sediment drops over the simulation period due to the low flow conditions. These values are sensitive to the management inputs. The nitrogen and phosphorus cycles showed a stable nitrogen state, however, with an increase in organic phosphorus.
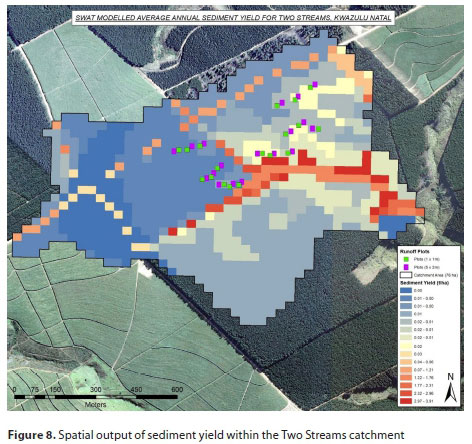
Spatially explicit output
Generating spatial output data is a useful approach, as it allows for data to be quickly and easily relayed to clients, GIS users and decision makers. The difficulty is reducing the time series to a manageable level for display purposes. Annual data of specific output parameters can be spatially outputted. Seasonal changes can also be displayed (e.g. monthly maps). Furthermore, percentage change between scenarios can be calculated and displayed. This allows for the identification of sensitive areas or areas where management will have the largest benefit. The results from the topographic reports suggest relatively high variations in slope and elevation. An important reason for the detailed terrain input and HRU creation is that output data can be linked back to the spatial distribution within the catchment. The sediment distribution at Two Streams (Fig. 8) indicates that higher sediment loads occur in the steeper slope areas, along the gravel roads and close to riparian systems. This is potentially useful as it demonstrates which areas may require erosion control measures. The land area under plantation showed an average annual sediment yield of 0.02 t-ha-1, approximately double that of the areas under sugarcane. This is likely due to the long ratoon cycle where the sugarcane maintains a high average biomass and tillage does not occur during this period. In contrast, the area under plantation has relatively less soil cover resulting in smaller rainfall events generating surface runoff.
Time-series output
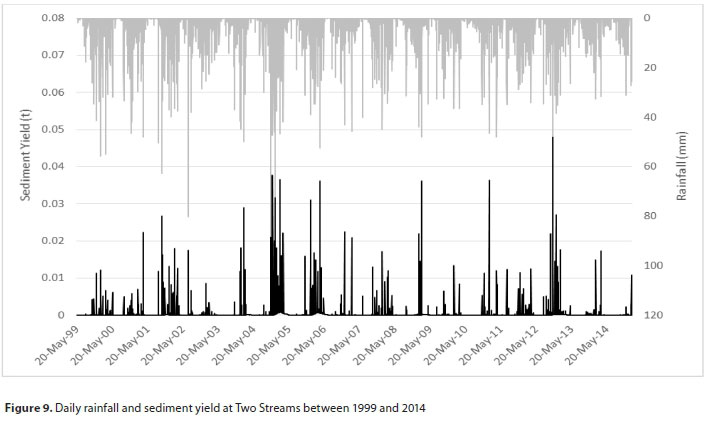
Output parameters linked to the delineated channel or reach, such as streamflow, can only be observed per segment of reach or at the catchment outlet. As such, these data cannot be viewed by HRUs. Daily time-series data of sediment yield show that on days during rainfall, sediment can reach up to 0.05 t (Fig. 9). This finding, as with the observations, is low. High rainfall peaks correspond to greater sediment loads. This is exacerbated under periods when the land is fallow or felling has taken place.
CONCLUSIONS
This modelling exercise demonstrates that the SWAT model can be effectively used in South Africa, and in particular in eroded agricultural areas of KwaZulu-Natal. The results were compared to previous model simulations undertaken at the site, where it could be seen that the SWAT model simulated flows more accurately. The ACRU model, which was run between 2000 and 2008, consistently underestimated the streamflow. ACRU at times exceeded a 40% deviation from actual streamflow with WAVES exceeding a -20% deviation between the simulated and observed streamflow (Clulow et al., 2011). The historical simulation using SWAT (1950 to 2000) was limited to one HRU. The results showed an annual overestimation of streamflow by 12 mm from the observed 20 mm (Everson et al., 2007). The overall finding was that further improvement was required and should be used together with satellite observations to up-scale the information across geographically broader regions.
The management component in SWAT is detailed and relevant to the Two Streams site. Although much time was spent on correcting input errors and translating data, if this model were to be used over a greater catchment area and a range of climatic conditions, the model could be appropriately validated and adopted for a broad range of applications in South Africa. A major limitation is the lack of SWAT-ready input data, such as soils, land use and climate. However, the data are available and would be needed to be populated into a SWAT-friendly format. Furthermore, as with any model calibration, more observations are required to validate the sub-routines of SWAT, such as sediment, nutrients and physiological properties of vegetation. An area of improvement would be a simultaneous multi-variable calibration using both streamflow and sediment yield. This would allow for input variables to be parameterized together, rather than isolating these two components.
The SWAT-CUP calibration interface provides a useful tool to determine the sensitivity of input parameters, and to improve the simulation efficiency by parameterising input variables, and provides an indication of the model uncertainty. The SWAT model is a suitable hydrological model for assessing the impacts of different land-uses in summer rainfall agricultural catchments in KwaZulu-Natal and can provide high-resolution temporal and spatial output data.
ACKNOWLEDGEMENTS
The authors wish to acknowledge the financial contribution of the Water Research Commission as this paper forms a component of the funded project KSA 4: Water Utilisation in Agriculture, Thrust 4: Water Resource Protection and Reclamation in Agriculture, Programme P2: Impact assessment and environmental management of agricultural production (Project K5/2402).
REFERENCES
ALMENDINGER JE, MURPHY MS and ULRICH JS (2014) Use of the Soil and Water Assessment Tool to scale sediment delivery from field to watershed in an agricultural landscape with topographic depressions. J. Environ. Qual. 43 9-17. https://doi.org/10.2134/jeq2011.0340 [ Links ]
ARNOLD JG and FOHRER N (2005) SWAT2000: Current capabilities and research opportunities in applied watershed modelling. Hydrol. Proc. 19 (3) 563-572. https://doi.org/10.1002/hyp.5611 [ Links ]
BEESON PC, SADEGHI AM, LANG MW, TOMER MD and DAUGHTRY CST (2014) Sediment delivery estimates in water quality models altered by resolution and source of topographic data. J. Environ. Qual. 43 26-36. https://doi.org/10.2134/jeq2012.0148 [ Links ]
BETRI GD, MOHAMED YA, VAN GRIENSVEN A and SRINIVASAN R (2011) Sediment management modelling in the Blue Nile Basin using SWAT model. Hydrol. Earth Syst. Sci. 15 807-818. https://doi.org/10.5194/hess-15-807-2011 [ Links ]
BORAH DK and BERA, M (2003) Watershed-scale hydrologic and nonpoint-source pollution models: review of mathematical bases. Trans. ASAE46 (6) 1553-1566. https://doi.org/10.13031/2013.15644 [ Links ]
CLULOW AD, EVERSON CS and GUSH MB (2011) The long-term impact of Acacia mearnsii trees on evaporation, streamflow and groundwater resources. WRC Report No. TT 505/11. Water Research Commission, Pretoria. [ Links ]
EASTON ZM, FUKA DR, WALTER MT, COWAN DM, SCHNEIDERMAN EM and STEENHUIS TS (2008) Re-conceptualizing the Soil and Water Assessment Tool (SWAT) model to predict runoff from variable source areas. J. Hydrol. 348 (3-4) 279-291. https://doi.org/10.1016/j.jhydrol.2007.10.008 [ Links ]
EVERSON CS, CLULOW AD, BECKER M, WATSON A, NGUBO C, BULCOCK H, MENGISTU M, LORENTZ S and DEMLIE M (2014) The long-term impact of Acacia mearnsii trees on evaporation, streamflow, low flows and ground water resources. Phase II: Understanding the controlling environmental variables and soil water processes over a full crop rotation. WRC Report No. K5/2022. Water Research Commission, Pretoria. [ Links ]
EVERSON CS, CLULOW AD and MENGITSU M (2009) Feasibility study on the determination of riparian evaporation in non-perennial systems. WRC Report No. TT424/09. Water Research Commission, Pretoria. [ Links ]
EVERSON CS, GUSH M, MOODLEY M, JARMAIN C, GOVENDER M and DYE P (2007) Can effective management of the riparian zone vegetation to significantly reduce the cost of catchment management and enable greater productivity of land resources. WRC Report No. 1284/1/07. Water Research Commission, Pretoria. [ Links ]
GASSMAN PW, REYERS MR, GREEN CH and ARNOLD JG (2007) The Soil and Water Assessment Tool: Historical development, applications, and future research directions. Trans. ASABE 50 (4) 1211-1250. https://doi.org/10.13031/2013.23637 [ Links ]
GASSMAN PW, SADEGHI AM and SRINIVASAN R (2014) Applications of the SWAT model special section: overview and insights. J. Environ. Qual. 43 1-8. https://doi.org/10.2134/jeq2013.11.0466 [ Links ]
LE MAITRE DC, VAN WILGEN BW, GELDERBLOM CM, BAILEY C, CHAPMAN R and NEL J (2002) Invasive alien trees and water resources in South Africa: case studies of the costs and benefits of management. For. Ecol. Manage. 160 143-159. https://doi.org/10.1016/S0378-1127(01)00474-1 [ Links ]
MUCINA L and RUTHERFORD MC (2006) The vegetation of South Africa, Lesotho and Swaziland. Strelitzia 19. South African National Biodiversity Institute, Pretoria. [ Links ]
NATIONAL RESOURCES CONSERVATION SERVICE SOIL SURVEY STAFF (1996) National Soil Survey Handbook, 430-VI. U.S. Government Printing Office, Washington, D.C. [ Links ]
NEITSCH SL, ARNOLD JG, KINIRY JR and WILLIAMS JR (2011) Soil and Water Assessment Tool Theoretical Documentation Version 2009. Technical Report Number TR-406. Texas Water Resources Institute. Texas A & M University, College Station, Texas, USA. [ Links ]
NABI G, HUSSAIN F, WU R, NANGIA, V, BIBI R and MAJID A (2017) Optimizing micro watershed management for soil erosion control under various slope gradient and vegetation cover conditions using SWAT modelling. Hydrol. Earth Syst. Sci. Discuss. https://doi.org/10.5194/hess-2017-532 [ Links ]
SCHULTZE RE (1995) Hydrology and Agrohydrology: A Text to Accompany the ACRU-3.00 Agro-Hydrological Modelling System. WRC Report No. TT 69/95. Water Research Commission, Pretoria. 552 pp. [ Links ]
SCHUOL J, ABBASPOUR KC, SRINIVASAN R and YANG H (2008) Estimation of fresh water availability in the West African subcontinent using the SWAT hydrologic model. J. Hydrol. 352 30-49. https://doi.org/10.1016/j.jhydrol.2007.12.025 [ Links ]
SCOTT-SHAW BC (2019) Water-use dynamics of alien plant invaded riparian forests in South Africa. PhD dissertation. School of Agricultural, Earth and Environmental Sciences, College of Agriculture, Engineering and Science, University of KwaZulu-Natal. [ Links ]
STRAUCH M and VOLK M (2013) SWAT plant growth modification for improved modelling of perennial vegetation in the tropics. J. Ecol. Model. 269 98-112. https://doi.org/10.1016Ai.ecolmodel.2013.08.013 [ Links ]
THAMPI SG, RANEESH SG and SURYA KY (2010) Influence of scale on SWAT model calibration for streamflow in a river basin in the humid tropics. Water Resour. Manage. 24 4567-4578. https://doi.org/10.1007/s11269-010-9676-y [ Links ]
TOLOSA D (2015) Modelling sediment yield using ArcSWAT and analyzing the most prominent remedial measures: cases of Melka Wakena reservoir, Ethiopia. MSc dissertation, Addis Ababa University, Ethiopia. [ Links ]
WAGNER PD, KUMAR S, FIENER P and SCHNEIDER K (2011) Hydrological modelling with SWAT in a monsoon-driven environment: experience from the Western Ghats, India. Trans. ASABE 54 1783-1790. https://doi.org/10.13031/2013.39846 [ Links ]
ZABALETA A, MEAURIO M, RUIZ E and ANTIGÜEDAD I (2014) Simulation climate change impact on runoff and sediment yield in a small watershed in the Basque Country, northern Spain. J. Environ. Qual. 43 235-245. https://doi.org/10.2134/jeq2012.0209 [ Links ]
 Correspondence:
BC Scott-Shaw
Email: brucecharlesss@gmail.com
Received: 9 April 2018
Accepted: 30 March 2020

