


Serviços Personalizados
Artigo
 Inglês (pdf)
 Artigo em XML
 Referências do artigo
Indicadores

Links relacionados
-
 Citado por Google
 -
 Similares em Google
Compartilhar

 Permalink
Water SA
versão On-line ISSN 1816-7950
versão impressa ISSN 0378-4738
Water SA vol.46 no.2 Pretoria Abr. 2020
http://dx.doi.org/10.17159/wsa/2020.v46.i2.8231
RESEARCH PAPER
Estimating evapotranspiration in a semi-arid catchment: A comparison of hydrological modelling and remote-sensing approaches
Richard BuganI; César Luis GarciaII; Nebo JovanovicI; Ingrid TeichIII; Manfred FinkIV; Sebinasi DzikitiI
INatural Resources and Environment, CSIR, Stellenbosch, South Africa
IIConsejo Nacional de Investigaciones Científicas y Tecnológicas (CONICET), CIDIE Universidad Católica de Córdoba, Argentina
IIIInstituto de Fisiología y Recursos Genéticos Vegetales (CIAP, INTA), CONICET. Córdoba, Argentina
IVDepartment of Geoinformatics, Hydrology and Modelling, Friedrich-Schiller-University Jena, Germany
ABSTRACT
Reliable spatial data of evapotranspiration (ET) in support of water resources management are limited. ET is a major component of the water balance, in many regions, and therefore it is critical that it be accurately quantified. To identify a product that accurately estimates spatially distributed ET for application in data-scarce regions, an inter-model comparison was conducted between the MOD16 ET dataset and the ET calculated with the calibrated and validated JAMS/J2000 hydrological model in the Sandspruit catchment (South Africa). Annual JAMS-ET and MOD16-ET data were generally consistent. Monthly JAMS-ET and MOD16-ET dynamics are influenced by the response of vegetation to precipitation as well as the atmospheric evaporative demand. The maximum correlation coefficient between JAMS-ET and MOD16-ET was 0.82 and it was evident at Lag 0, showing that both ET estimates are in phase when evaluated at the basin scale. The maximum correlation coefficients between the ET estimators and precipitation were 0.67 and 0.70 for JAMS-ET and MOD16-ET, respectively, and this was evident at Lag 2 (1 lag is 1 month) for both methods. This suggests that there is a 2-month delay in the maximum response of ET to precipitation. The models did not exhibit significant dependence on the seasonal distribution of precipitation. The complementary use of hydrological modelling and satellite-derived data may be greatly advantageous to water resources management, e.g., water allocation studies, ecological reserve determinations and vegetation water use studies. The results of the inter-model comparison also provide motivation for the use of the MOD16 ET dataset to estimate ET in data-scarce regions. Additionally, this study provides evidence for the potential use of validated satellite-based ET data as inputs in hydrological models. This may facilitate a more realistic representation of the catchment hydrological processes.
Keywords: evapotranspiration, hydrological modelling, remote sensing, J2000, MOD16-ET
INTRODUCTION
The availability of hydrological data is a critical component in water resources management. It allows for scientifically based decisions to be made concerning the availability and allocation of water resources, the long-term historic and future trends, as well as the impacts of land use change. Many regions, particularly developing countries, are however data-scarce and this poses a significant challenge to water resources management in these countries.
Rainfall and evapotranspiration (ET) are particularly critical variables, as they are major components of a catchment's water cycle. The availability of ET data is far more limited than for rainfall data (Hughes, 2008; Hughes et al., 2015). Measurements of ET are seldom available at spatio-temporal scales which are required to accurately inform water resource management decisions. This is primarily due to the costs associated with direct measuring equipment, complexities in calculating ET and the extensive data requirements (e.g. air temperature, humidity, radiation, wind speed, etc.) of commonly used estimation methods, such as those based on the Penman-Monteith equation (Monteith, 1965). The challenges associated with determining ET are further aggravated by the fact that point-measured data need to be up-scaled for large areas or catchments, producing a huge source of uncertainty, especially in arid and semi-arid areas with diverse land use where ET is highly variable spatially (Jovanovic et al., 2015). Moreover, in these arid and semi-arid areas, ET is generally the second-largest component of the water balance after rainfall (Bugan et al., 2012; Munch et al., 2013), and therefore its determination is essential for efficient water resources management.
To estimate spatially distributed variables of the water cycle, hydrological models are being used around the world at multiple spatial scales (Leavesley et al., 1983; Schulze, 1994; Arnold et al., 1998; Krause, 2002; Bugan et al., 2012). Distributed and continuous hydrological models are advanced tools that, in their basic form, have the objective of converting point precipitation data into flow estimates, but in the process they can also compute the value of many variables and hydrological processes across a catchment. For this reason, these models are widely used for estimating ET and calculating complete water balances within a catchment.
Distributed models generally compute actual evapotranspiration (ET) using many inputs such as potential evapotranspiration (PET) calculated from atmospheric conditions, land use and vegetation characteristics, soil type and properties, and soil water availability. When soil water availability is not a limiting factor, the most critical choice is the method used to calculate PET (Kingston et al., 2009), as it is computed to be the maximum possible evaporation rate from a given land cover. On the contrary, under water-limited conditions, ET is modulated mostly by the available soil water simulated by the model. The choice of a method to accurately calculate PET depends on the specific environmental characteristics of a basin (climate and land cover), but in reality, data availability and reliability represent the biggest constraints. This can lead to over- or under-estimation of ET and consequently to inaccurate calculation of simulated streamflow (Milly and Dunne, 2010). Large-scale spatial variability of ET may represent an important source of uncertainty in hydrological models (Kingston et al., 2009; Hay et al., 2010). A promising technique to overcome these difficulties is the use of earth observation (EO) data to construct ET estimation algorithms (Bastiaanssen et al., 1998a, b; Su, 2002; Allen et al., 2007a, b; Mu et al., 2007a; Miralles et al., 2011).
The increasing availability of EO data at high frequencies and large spatial scales is advantageous in data-scarce regions, in terms of catchment water management. EO data are collected via remote sensing from aircrafts/satellites and involve the measurement of reflected electromagnetic energy. Remotely sensed data can be translated into spatial variables such as land surface temperature, surface reflectance, and vegetation indices that describe vegetation activity and its energy status, allowing the development of algorithms for the estimation of ET. Another advantage is that with a high spatial resolution over wide areas these products are also significantly cheaper than maintaining ground-based monitoring stations. Furthermore, the spatial data are associated, in many products, with temporal records that allow the construction of spatial time series (Jovanovic et al., 2014).
The MOD16 product, which estimates global ET from ground-based meteorological observations and remote-sensing data from the Moderate Resolution Imaging Spectroradiometer (MODIS) satellite (Justice et al., 2002), holds potential for application in hydrological studies in data-scarce arid and semi-arid regions. The MOD16 product provides ~1 km2 global land surface ET datasets for vegetated land areas at 8-day and monthly intervals (Mu et al., 2011). This EO product is particularly attractive because data are readily available for the past in the form of a time series starting in 2000. The model is based on sound physical principles and takes into account evaporation from both the soil and plant canopies, from wet and dry surfaces, and for day and night periods.
The importance of ET data in water management, and the increasing availability of new techniques to quantify ET, fuels the need to evaluate the methods used to estimate it, particularly at large spatial scales, i.e., the catchment scale. Inter-model comparisons are often used when direct field measurements are not available and they are based on the premise that one of the models provides results that are sufficiently reliable. This study aims to compare the spatial and temporal characteristics of the MOD16 ET dataset and the ET quantified with a calibrated and validated water balance model, i.e., JAMS/J2000 (Krause, 2002). This will inform the potential use of the MOD16 ET dataset and/or the JAMS/J2000 model in water resource management activities in a data-scarce semi-arid region of the Western Cape (South Africa).
METHODS
The case study was conducted for the period 2008 to 2010 in the Sandspruit River catchment, a tributary of the Berg River. Climatic conditions evident during the study period are representative of average conditions experienced in the catchment. The approach utilises data at monthly and annual temporal scales, and at catchment and modelling-unit spatial scale.
Test catchment: Sandspruit River basin
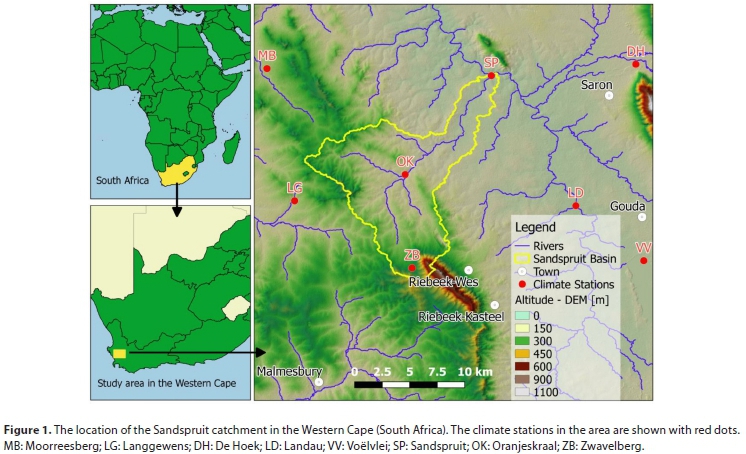
The Sandspruit catchment forms part of quaternary catchment G10J (based on the classification ofthe South African Department of Water and Sanitation), which is located in the Western Cape Province of South Africa, approximately 80 km north-east of Cape Town (Fig. 1). It is a seasonal stream, which only flows between the months of June and November, with a catchment area of approximately 152 km2. The physiographic conditions present in the Sandspruit catchment are representative of those in the mid- to lower reaches of the Berg River catchment (Fig. 1). The Berg River is a pivotal source of fresh water to Cape Town, the irrigated agricultural sector and the towns of Paarl, Wellington and Saldanha. Comprehensive management of the water resources in the catchment is therefore vital.
The topography of the Sandspruit catchment is relatively flat, exhibiting a gently undulating surface. Land use in the Sandspruit catchment is dominated by rain-fed agriculture and pastures. The catchment falls within the 'bread basket' of South Africa and wheat is the main crop produced in the area. However, the growing of lupins (L. mutabilis) and canola (B. napus) is not uncommon. Farmers in the area generally follow a 3-year planting rotation wherein cultivation only occurs every 3rd year. Lands are left fallow between planting rotations and used for grazing. Soil erosion is minimized by the use of manmade anti-erosion contour ridges, which are evident throughout the catchment (Bugan et al., 2015).
The Berg catchment experiences a semi-arid Mediterranean climate with warm dry summers and cool wet winters. Rainfall is of a cyclonic nature, extending normally over a few days with significant periods of clear weather in between. Little rain falls during summer, with the rainy season extending from May through to October. Precipitation is generally in the form of frontal rain approaching from the northwest. Mean annual precipitation in quaternary catchment G10J was 460 mm-a-1 (DWAF, 2003). Winter extreme minimum temperatures vary from 2°C to 4°C and summer extreme maximum temperatures vary from 38°C to 40°C. The Sandspruit catchment is representative of an area where ET is limited by the availability of soil water. Due to the semi-arid climate in the area, ET is a major component of the water balance, accounting for about 94% of rainfall (Bugan et al., 2012). Sparse point measurements of reference ET are available for the mid- to lower reaches of the Berg River catchment, which provides motivation for the use of EO data. Additionally, the fact that the area may generally be characterised as water limited provides further motivation for the use of remote-sensing data as, according to Glenn et al. (2011), remotely sensed ET data is more accurate in areas which exhibit fairly uniform water availability characteristics.
Hydrological model: JAMS/J2000
JAMS/J2000 is a meso- to macro-scale hydrological model developed at the Friedrich-Schiller University Jena (Germany). The model simulates the water balance in river basins at a daily time scale. It simulates the hydrological cycle in a spatially distributed process-orientated manner, with the model core focusing on runoff generation and concentration. The model accounts for the heterogeneity of a catchment's environmental parameters (Krause, 2002). The concept of the JAMS/J2000 model was extensively described by Steudel et al. (2015) and Krause et al. (2009). This model was chosen for two main reasons: (i) it was previously applied to the selected catchment and showed good performance; (ii) its open-source nature allowed for the incorporation of a local particularity like manmade anti-erosion contour ridges to the soil water movement simulation (Steudel et al., 2015).
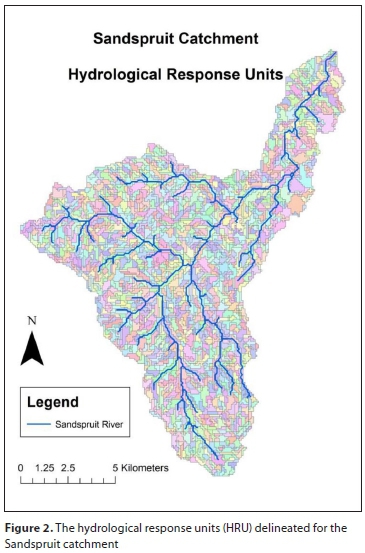
JAMS/J2000 subdivides the catchment into hydrological response units (HRUs; Flügel, 1996). HRUs are defined as distributed, heterogeneously structured entities having a common climate, land use, and underlying pedo-topo-geological associations controlling their hydrological transport dynamics (Flügel, 1996). For the delineation of HRUs the following data were used: digital elevation model (90 x 90 m, USGS, 2003), land use (30 x 30 m, CSIR and ARC, 2005), soils (1:50 000, Görgens and De Clercq, 2006) and geology (1:1 000 000, Visser, 1989). Consequently, each HRU has associated properties (e.g. soil, topographic, hydrogeological, etc.). During the set-up of the JAMS/J2000 model for the Sandspruit catchment, the catchment was subdivided into 1 660 HRUs (Fig. 2) using the methodology described in Steudel et al. (2015).
The JAMS/J2000 model is able to simulate catchment distributed rainfall, interception, ET, snow accumulation and ablation, horizontally differentiated soil water and groundwater dynamics, distributed runoff generation and flood routing in the catchment's river network (Krause et al., 2006). Reference ET is calculated according to the Penman-Monteith equation (Monteith, 1965). The input required by the Penman-Monteith equation is provided by climate input data and the parameters of the specific vegetation class of each HRU. The calculation of potential ET (PET) considers physical constraints (e.g. solar radiation, air temperature and wind speed) as well as vegetation specific parameters (e.g. aerodynamic resistance, canopy resistance and effective height). The seasonal dynamics of these vegetation parameters are derived by continuous functions, which are extrapolated from discrete values obtained from various literature sources (Krause, 2002). JAMS/J2000 also incorporates algorithms to calculate missing climatic input data, e.g., the net radiation, actual and saturated vapour pressure, heat fluxes and absolute humidity. During the simulation, ET is calculated as a function of PET and actual soil moisture (simulated), using either a linear or non-linear relationship.
The model was set up for the period 1 January 2000 - 31 December 2010. The simulation period was subdivided as follows:
• Model initialisation (1 January 2000 - 16 July 2008)
• Model calibration (17 July 2008 - 31 December 2009). Model calibration was performed using both manual and automatic techniques. Manual calibration was performed by adjusting model input parameters within a specific range at pre-defined intervals, and subsequently comparing the model response to observed data. Automatic model calibration of the JAMS/J2000 model was performed through a semi-automated assistant, i.e., OPTAS (Fischer et al., 2009). A detailed explanation of the manual and automatic calibration procedures, as well as the final model parameter values, is presented by Bugan (2014).
• Model validation (1 January 2010 - 31 December 2010)
The short calibration and validation periods create uncertainty as to whether the model is able to accurately simulate the range of hydrological and climatic conditions experienced in the catchment. The length of these periods was however restricted as a result of limited input data series.
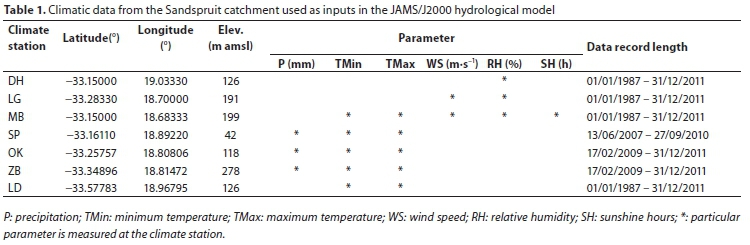
The model requires daily values of precipitation (mm), minimum and maximum air temperature (°C) , wind speed (m-s-1), relative humidity (%) and sunshine hours (h). Input data were acquired from climate stations located in the vicinity of the Sandspruit catchment (Fig. 1 and Table 1). These stations are managed by the Agricultural Research Council (ARC) for the weather data and the Department of Water and Sanitation (DWS) in South Africa for the streamflow records. Three weather stations were installed within the catchment, namely, Sandspruit (SP), Zwavelberg (ZB) and Oranjeskraal (OK) (Fig. 1 and Table 1). The model utilized regionalisation methods, e.g. inverse distance weighting interpolation, to spatially distribute these point measurements. The Sandspruit station malfunctioned on 27 September 2010. Subsequently, precipitation data for the period 27 September 2010-31 December 2010 were infilled using a regression relationship with the Zwavelberg station (R2 = 0.67). When no precipitation was recorded at Zwavelberg, it was assumed that none occurred at Sandspruit. To allow for an extended model initialisation and simulation period, climate data for the period 1 January 2000-12 June 2007 (Sandspruit) and 1 January 2000-16 February 2009 (Oranjeskraal and Zwavelberg) were calculated using regression analysis against stations located outside the catchment.
The model also requires observed runoff data with which to evaluate the simulated runoff results as the objective function. Station No. G1H043 is located immediately adjacent to Station SP (Fig. 1) and is managed by DWS. The model was parameterised using the results from numerous field investigations conducted in the study area (Flügel, 1995; Fey and De Clercq, 2004; Bugan, 2008; De Clercq et al., 2010; Bugan et al., 2012; De Clercq et al., 2013).
Satellite-derived evapotranspiration
The MOD16 ET product is created using MODIS global landcover (MOD12Q1), a daily meteorological re-analysis dataset from NASA's Global Modelling and Assimilation Office, and MODIS biophysical parameters (albedo, leaf area index, and an enhanced vegetation index) as inputs into the Penman-Monteith equation (Mu et al., 2011). The algorithm for MOD16 ET was developed by Mu et al. (2007a) and Mu et al. (2007b) from the original model of Cleugh et al. (2007), and later improved by Mu et al.
(2011). According to McCabe and Wood (2006), the MODIS
products exhibit limited capacity in capturing the spatial variability in fluxes at high resolution, however, estimates for the spatial average flux at large scales may be accurate. Mu et al. (2011) compared MOD16 data with ET measurements from 46 AmeriFlux eddy covariance flux towers located across 7 biomes. Mean average errors of 0.33 mm-d-1 (24.10%) were reported and correlation coefficients of 0.86. According to Mu et al. (2011), this error margin is within the accuracy range, i.e. 10-30%, expected from remote-sensing methods (Kalma et al., 2008). According to Glenn et al. (2011) MODIS-derived ET maps were able to capture the general actual ET, derived from meteorological data, features and trends derived at a continental scale in Australia. Although absolute values of MOD16 ET may be questionable under certain conditions (e.g. in mountainous regions or in very water-limited landscapes) and require extensive validation in semi-arid areas, the relative values of MOD16 may be useful in identifying temporal and spatial trends of ET (Jovanovic et al., 2015).
Hydrological model efficiency calculation
The criteria which were used to evaluate the objective runoff function during the calibration and validation ofthe hydrological model were the Nash-Sutcliffe Efficiency (NSE) (Nash and Sutcliffe, 1970), the coefficient of determination (R2) and the Index of Agreement (IOA; Willmott, 1981). This is in accordance with recommendations made by Janssen and Heuberger (1995), Krause et al. (2005) and Wagener et al. (2003):
• The NSE is a commonly used measure of model efficiency. Values for NSE vary from negative infinity to 1. A value of 1 indicates a perfect fit between observed and simulated data, while a value < 0 implies that the simulated value is (on average) a poorer predictor than the long-term average of the observations. A NSE of 0.4-0.6 is classified as satisfactory and a value > 0.6 is classified as good.
• The coefficient of determination (R2) is defined as the squared value of the coefficient of correlation (Krause et al., 2005). The coefficient of determination ranges between 0 (no correlation) and 1 (perfect fit). It should, however, be used with caution as a model which systematically over- or under-predicts may still exhibit an acceptable R2 value.
• The IOA (Willmott, 1981) aims to overcome the insensitivity of the NSE and R2 to differences in the observed and simulated means and variances (Legates and McCabe, 1999). The IOA ranges between 0 and 1, with a value of 0 representing no correlation and 1 a perfect fit. A value > 0.60 is regarded as representing a good fit between observed and simulated values.
Data analysis
The statistical analysis employed aimed to identify similarities and differences between the datasets. The relative agreement (e.g. correlation) as well as the absolute agreement (e.g. standard difference) was considered. The pixels of MOD16-ET monthly data were transformed to the HRU spatial pattern and resolution to allow for comparison with the simulated ET results of the JAMS/J2000 model. The process was to overlay the HRU areas (Fig. 2) and the MOD16-ET pixel areas in order to extract the spatial mean of geographically coincident data (ESRI, 2011). The extracted monthly datasets were subsequently aggregated to annual values for comparison of annual ET data, producing two temporal scales of analysis. Also, two different spatial scales of analysis were considered, i.e., the HRU scale mentioned above and an aggregation to basin scale.
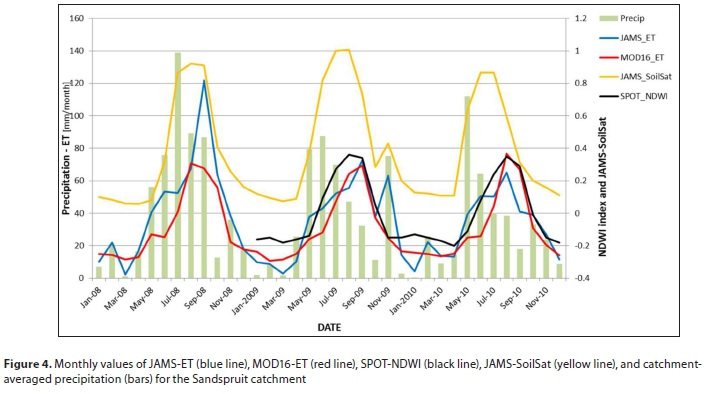
Precipitation and ET estimates were aggregated at the basin scale for each year (2008-2010) to explore the mean basin behaviour. Precipitation represents the water input to the basin and is therefore a key variable to consider in the understanding of ET dynamics, and therefore the ratio between ET and precipitation was analysed. To study the temporal variations between years, monthly values of precipitation and ET were calculated at the basin spatial scale for the study period (36 months). In addition to these variables, two ancillary variables were incorporated to aid in the interpretation of the temporal behaviour of the ET estimates. These variables were: JAMS-SoilSat (average soil saturation simulated with JAMS/J2000) and SPOT-NDWI. JAMS-SoilSat represents the availability of water in the basin's soils, according to the JAMS/J2000 hydrological model. SPOT-NDWI is the Normalized Difference Water Index computed with data and an algorithm which is different from MODIS satellite NDVI. This index was developed specifically for Africa by the European Union Framework Programme 7 VGT4Africa project (VGT4Africa, 2013) from a cloud-free 10-day composite. SPOT-NDWI has been tested in the vicinity of the study area by Jovanovic et al. (2014) and represents an independent indicator of the water-vegetation status. Due to its similitude with the Normalized Difference Vegetation Index (NDVI), which is used in the MOD16-ET algorithm, SPOT-NDWI was selected as an independent tool to analyse plant phenology and to aid in the understanding of its role in the MODIS-ET calculation. SPOT-NDWI is a proxy for vegetation response, varying from -1 to 1, where higher values relate either to surface water (not occurring in the study area) or to the water captured by surface vegetation (interception). In the latter case, higher SPOT-NDWI represents heathier vegetation that is storing water in it leaves and green tissue. A similar response as the NDVI is expected, with higher values meaning that the plant has more leaves with available water for transpiration, and also higher ET rates.
The data analysis further included:
• Cross-correlations between precipitation, JAMS-ET, MOD16-ET, JAMS-SoilSat and SPOT-NDWI were
performed to analyse and identify the lags with the maximum coefficients of correlation. Given that observations are temporally dependent, to test the significance of simple correlation coefficients a mixed linear regression model was used which considers the temporal correlation between observation pairs through the modelling of the residual covariance matrix. Several models accounting for temporal dependency were fitted and the autoregressive structure of order 1 was chosen as the best, to take into account the temporal correlation in the datasets according to the Akaike Information Criteria (AIC; Littell et al., 2006). All models were fitted by restricted maximum likelihood using the 'nlme' library of the R software (Pinheiro et al., 2017).
• To analyse the association between both ET estimates and precipitation at the HRU level, spatial datasets which represent the total annual ET estimated in each HRU for each year in the study period were produced. The correlation between JAMS-ET, MOD16-ET and precipitation in each year was evaluated with the Partial Mantel Test (Smouse et al. 1986), to take into account the spatial correlation among HRUs. The Partial Mantel Test is aimed at assessing the dependence between two matrices of distances while controlling the effect of a third distance matrix, which in our case contained geographical (Euclidean) distances between the centroids of HRUs. Euclidean distances were calculated with the 'bioDist' library (Ding et al., 2008) and Partial Mantel Tests were performed with 'vegan' (Oksanen et al., 2013) in the R software.
RESULTS AND DISCUSSION
JAMS/J2000 hydrological simulation
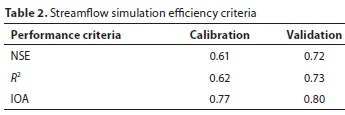
The efficiency criteria of the runoff simulation for the calibration and validation periods are presented in Table 2. In terms of the model performance evaluation criteria, the model exhibited good results during the calibration and validation periods, i.e., a good correlation between the daily simulated and observed streamflow volumes was observed. A NSE of 0.61 and 0.72 during calibration and validation, respectively, is indicative of a fairly good representation of runoff responses by the model. The IOA, which is able to account for the insensitivity of the NSE and R2 to differences in the observed and simulated means and variances (Krause et al., 2005), was 0.77 and 0.80 during calibration and validation, respectively, which confirms the sensitivity of the model to extremes.
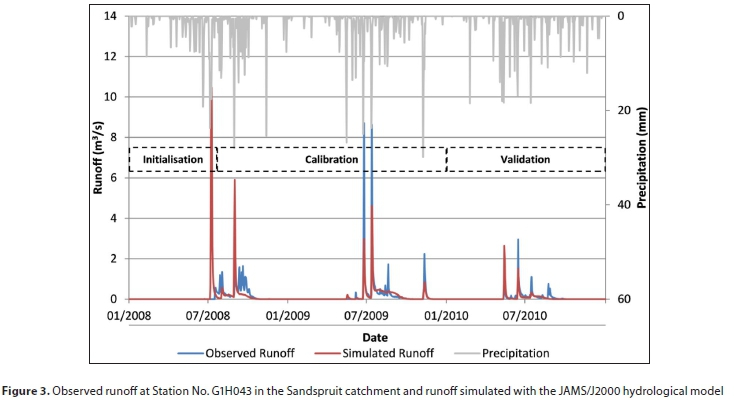
The observed and simulated streamflow are presented in Fig. 3. Good correspondence between observed and simulated runoff was observed (Fig. 3) in terms of temporal runoff dynamics. The model was able to represent the timing of initiation of increased runoff during winter. High peaks in the simulated runoff dataset correspond well with those of the observed runoff and pronounced rainfall events (Fig. 3). In general, the model under-estimated runoff volumes during extreme rainfall events. The model was also not able to entirely replicate the ephemeral characteristic of the Sandspruit River, as baseflow was simulated during the summer months. The simulation of baseflow during the dry summer months may be attributed to the use of linear storages by the model, which are never empty but decrease towards an asymptotic value. The simulated baseflow values are however interpreted to be within the same order of magnitude as further downstream migrating groundwater which is not captured by the gauge.
Bugan et al. (2012) quantified ET in the Sandspruit catchment, using a water balance approach, to be 492 mm and 407 mm during 2008 and 2009, respectively. These values are within the same order of magnitude as the JAMS-ET values, i.e., 506 mm and 408 mm, respectively. The ET clearly follows a seasonal pattern. It is highest during the winter months, i.e., May to September, during which water availability is highest. The seasonal monthly high was observed during September. JAMSET also exhibited a response to extreme rainfall, e.g., November 2009 and February 2010.
Comparison of JAMS-ET and MOD16-ET estimates at basin level
The annual balance between precipitation and evapotranspiration for the Sandspruit catchment is presented in Table 3 as a whole basin area spatial mean. The dominance of ET in terms of the catchment water balance was well replicated by the JAMS-ET and MOD16-ET models. On average, JAMS-ET accounts for 94% of precipitation while MOD16-ET represents 82%. This relationship between ET and precipitation is in accordance with results presented by Bugan et al. (2012). It should, however, be noted that JAMS-ET is calibrated against observed runoff, and therefore it is assumed that, because a good correlation is evident between the observed and simulated runoff, all processes within the model are being adequately represented. JAMS-ET is calculated as a function of the soil water content, which is required to be parametrized spatially and may be a source of error.
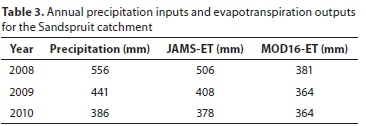
Both estimates produce a positive annual water balance at the basin scale, i.e., a surplus of water exists. During 2008 JAMS-ET amounted to 91%, while MOD16-ET amounted to 69% of precipitation. The annual total precipitation was lower in the subsequent years, i.e., 441 mm in 2009 and 386 mm in 2010. The ET estimates followed this pattern in 2009 and 2010 (Table 3). As the annual total precipitation decreases, it is noticeable that the difference between the ET estimates minimises and that ET represents a higher percentage of precipitation in the water balance.
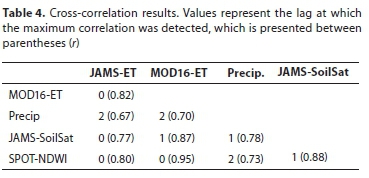
Monthly total ET calculated with the two estimation methods and the ancillary variables are graphed in Fig. 4. Rainfall is highest in the winter months, i.e., May to September, and therefore during these months water availability is the highest. The seasonal monthly high for JAMS-ET and MOD16-ET was observed during August/September. The results of the cross-correlations (lags and maximum correlation coefficients) are shown in Table 4. The maximum correlation coefficient between JAMS-ET and MOD16-ET was 0.82 and it was evident at Lag 0, showing that both ET estimates are in phase when evaluated at the basin scale (p < 0.001). The maximum correlation coefficients between the ET estimators and precipitation were 0.67 and 0.70 for JAMS-ET and MOD16-ET, respectively, and this was evident at Lag 2 (1 lag is 1 month) for both methods. This suggests that there is a 2-month delay in the maximum response of ET to precipitation (p < 0.001). These results show that both ET estimations are similarly correlated with precipitation at the basin scale and are also subjected to similar delays in response.
However, as Fig. 4 shows, MOD16-ET did not exhibit a similar response to pronounced rainfall during the dry summer months as JAMS-ET did, e.g., November 2009 and February 2010. In those atypically wet summer months, JAMS-ET increases and MOD16-ET does not. The lack of delay in the JAMS-ET response to the peak in precipitation indicates that it is probably more related to higher soil evaporation rates than to transpiration, i.e., if it were more related to transpiration then a delay would be evident which is related to plant growth.
Maximum correlation coefficients between SPOT-NDWI, the external variable used as a plant phenology proxy, and both ET estimates were found at Lag 0 (r = 0.80 and r = 0.95 for JAMS-ET and MOD16, respectively). However, the maximum correlation coefficients between both ET estimates and precipitation and JAMS-SoilSat were found at Lags 2 and 1, respectively (Table 4). The cross-correlation results indicate that at a monthly scale of observation a peak in precipitation is followed by a peak in JAMS-SoilSat approximately 1 month later. Approximately 2 months after the peak in precipitation, the SPOT-NDWI and both ET estimates exhibit an increase. This provides evidence of a close relation between both ET simulations and plant growth (Fig. 4). Dzikiti (2016) states that the MOD16-ET is particularly sensitive to the leaf area index which peaks towards the end of winter/early spring. At the whole basin scale of analysis, there is an acceptable level of agreement in the ET estimates produced by the models. Differences are mainly evident during extremely wet periods (e.g. August-September 2008, November 2009 and May-June 2010). The average monthly difference between JAMS-ET and MOD16-ET was 5 mm. During the periods April-September (wetter months) the average monthly difference was 8 mm, whereas during the drier months (October to March), it was 3 mm. Both models seem to be driven by plant attributes such as the leaf area index and canopy conductance which both influence the transpiration component, however JAMS-ET shows a closer relation to rainfall than MOD16-ET (Table 4).
The observation of a peak in JAMS-SoilSat after the general initiation of precipitation and before the peak in simulated ET represents a realistic representation of the soil water balance dynamics, as this is in accordance with field observations (De Clercq et al., 2013). It is important to simulate this process accurately, because this storage provides water for plant growth, ET and runoff generation.
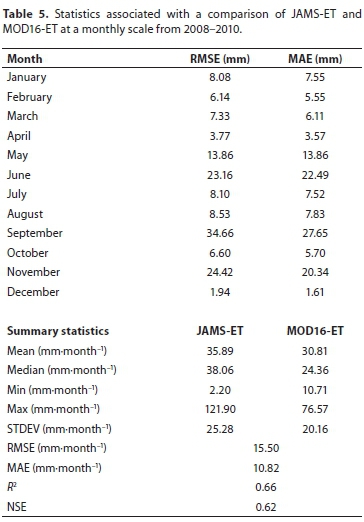
Additional indicators of the level of agreement between JAMS-ET and MOD16-ET are presented in Table 5. In terms of the R2and the NSE it is evident that over the entire period of analysis there is an acceptable level of agreement between the JAMS-ET and MOD16-ET datasets. The datasets also exhibit a relatively similar standard deviation (STDEV). The root mean square error (RMSE) and mean absolute error (MAE) are commonly used as a measure of the difference between predicted/simulated and observed values. The RMSE and MAE of the monthly average (2008-2010) JAMS-ET data as compared to the MOD16-ET data are also shown in Table 5. The largest variations, in terms of the RMSE and MAE, occur in the months of May, June, September and November. This is also evident in Fig. 4 and is interpreted to be a result of increased dependence of JAMS-ET on extreme rainfall, e.g., June 2008, September 2008, November 2009 and May 2010. However, the RMSE, in particular, is sensitive to single large outlier values (Munch et al., 2013). The overall RMSE and MAE were calculated to be 15.49 mm-month-1 and 10.82 mm-month-1, respectively.
Spatial distribution of ET estimates
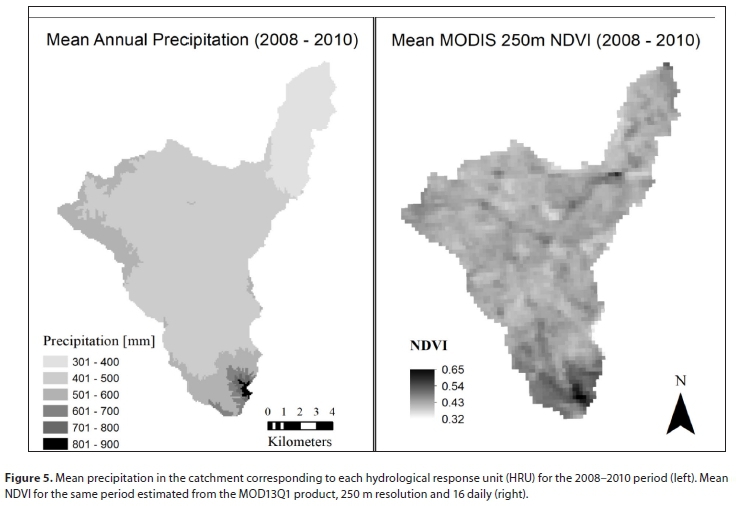
The spatial distribution of the mean annual rainfall (mm), which was calculated for each HRU during the simulation period, is presented in Fig. 5. The spatial distribution of rainfall is a function of elevation and the distance from the coastline. Thus, rainfall decreases from south to north/north-west and from west to east. Also in Fig. 5, the mean NDVI for the same period, computed from the MODIS product (MOD13Q1) at a 250 m spatial resolution, is presented. This NDVI is the 3-year mean of every 16-day image in the period and higher (darker) values are representative of higher primary productivity.
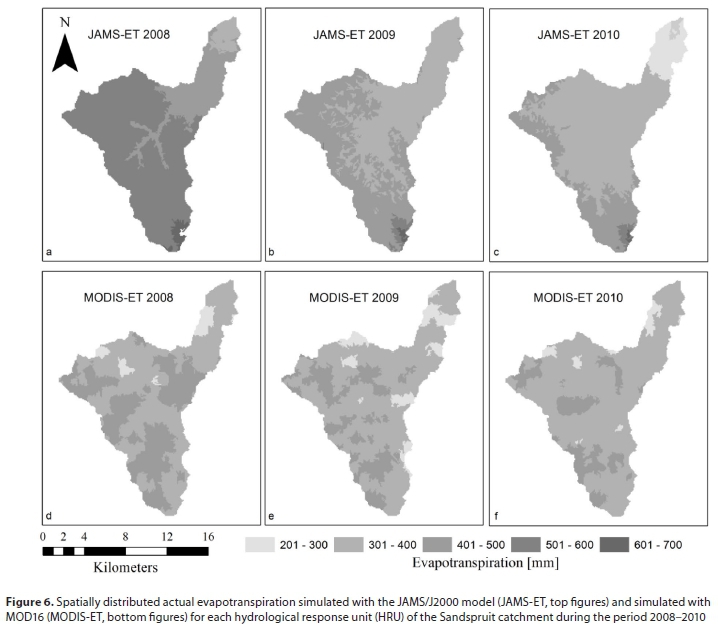
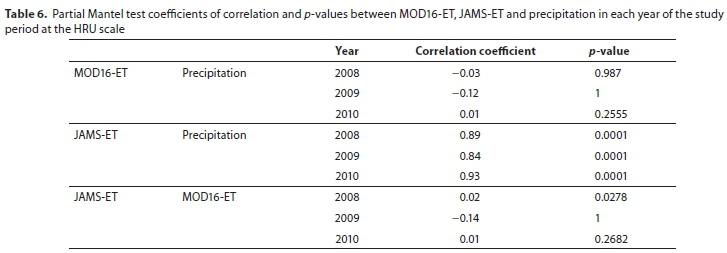
The spatially distributed JAMS-ET is presented in Fig. 6 (a, b, c) for the years 2008 to 2010, while Fig. 6 (d, e, f) presents the results for the MOD16-ET product. The spatial distribution of JAMS-ET exhibits a similar pattern as the spatially distributed precipitation. However, the spatially distributed MOD16-ET differs from JAMS-ET and no clear spatial correlation is evident with rainfall (Fig. 5). Partial Mantel tests results (Table 6) confirm that no correlation is found between precipitation and MOD16-ET (p > 0.25) when analysed at the HRU level in any of the three studied years, whereas JAMS-ET does show a significant and high correlation with precipitation at the HRU level in each of the three studied years (r > 0.83, p < 0.0001). This provides further evidence of the strong correlation between JAMS-ET and precipitation. At the basin level both ET estimates correlate well with precipitation, as expected. These results show the importance of analysing results at various spatial scales.
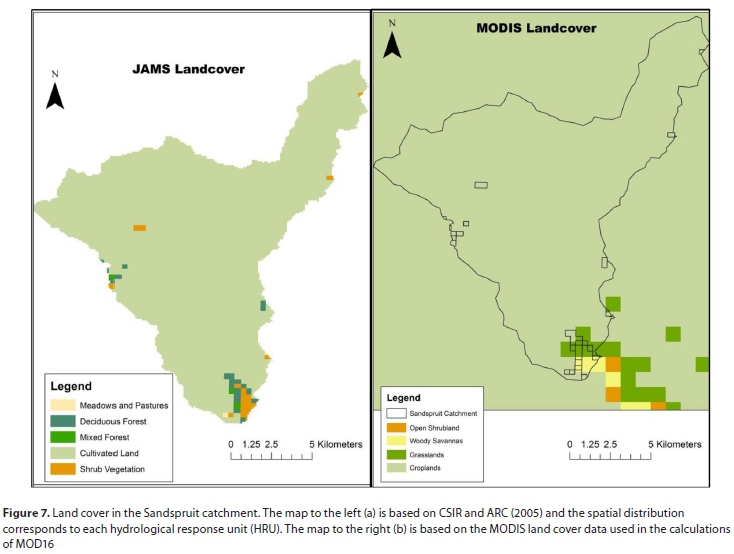
ET estimates are also influenced by land cover (Fig. 7). JAMS-ET and MOD16-ET use different land cover source data as inputs, and therefore the results are produced at different spatial resolutions and exhibit different land cover classes. However, in this case, the land cover datasets are generally in agreement, considering that most of the catchment is cultivated cropland, with the exception of the south-eastern tip of the catchment where natural vegetation occurs, coinciding with the wettest areas of the catchment as is shown in Fig. 5. The spatial distribution of JAMS-ET correlates well with land cover, while MOD16-ET exhibits some variation in this regard. The perennial deep-rooted vegetation, i.e., deciduous forest, mixed forest and shrub vegetation are expected to exhibit higher ET rates than the annual cultivated lands.
It should also be borne in mind that the land cover maps shown in Fig. 7 are related more to the land use than the actual vegetation cover at the time of ET estimation. For both models, the land cover is an environmental characteristic that is static throughout the simulation (in all time-steps). In reality, the cultivated land is managed to include land rotations of crops/winter wheat (every 3rd year) and fallow periods, during which vegetation is allowed to re-grow for animal grazing. Both models do not consider this land management practice. The wheat is generally planted in late April/early May each year, reaches full canopy development in September, and is harvested in November. The results of previous studies (De Clercq et al., 2010) indicated that ET of wheat is the highest at the stage of full canopy development, i.e., in September. At this phenological stage, the ET rates are very close to reference ET (Allen et al., 1998) values. In summer, the ET is lower than the reference ET and, as no canopy cover is present at this time (fallow land), the ET predominantly consists of the soil evaporation component. The MOD16-ET product uses the NDVI in its algorithm, i.e., a vegetation index that works as a proxy for vegetation status, health and phenology. Resultantly, the cross-correlation between SPOT-NDWI and MOD16-ET is in phase (Table 4), with both exhibiting peak values in September. This information and the spatial pattern in Fig. 6 (d,e,f) are strong indicators that the MOD16-ET is capturing the actual land management (cover) during a particular time period. When the annual JAMS-ET and MOD16-ET maps were compared with the Partial Mantel test no correlation was observed between both ET estimates at the HRU spatial scale in 2009 and 2010 (Table 6). In 2008 a statistically significant correlation was found but with a very small correlation coefficient (r = 0.02), showing that MOD16-ET and JAMS-ET exhibit different spatial distributions. The largest differences (an average of 200 mm-a-1) were observed in the south-eastern areas of the catchment, where the land cover differs from cultivated lands.
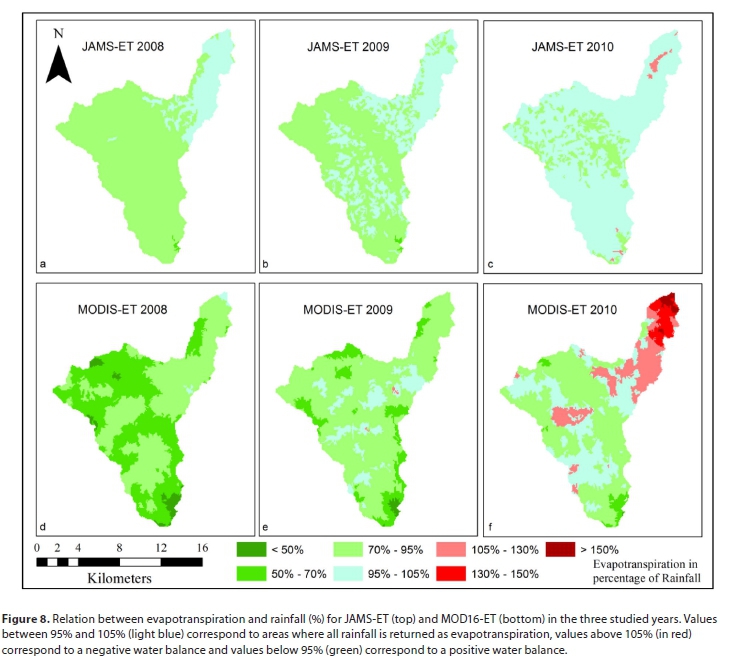
To better understand the relationship between the simulated ET and precipitation, the distributed weight of ET in the annual water balance was calculated as a percentage of rainfall (Fig. 8). It is evident that throughout the basin JAMS-ET shows minimal variation, with values between 80% and 95% of rainfall (Fig 8 a, b and c). Modelling units with a negative water balance are evident, i.e., ET is greater than rainfall. This is generally restricted to HRUs which are likely to receive water from upslope contributing areas. The distribution of modelling units with a negative water balance is more pronounced in 2010, which is interpreted to be a result of the low rainfall during this year. When analysing the relationship between the total annual ET and rainfall, MOD16-ET exhibits more spatial variability when compared to JAMS-ET (Fig. 8). Similarly to JAMS-ET, ET is a larger proportion of rainfall during drier years and the observation of modelling units with a negative water balance is also more evident during drier years (Fig. 8e, f). The results presented in Fig. 8 provide further evidence that JAMS-ET is strongly influenced by rainfall. MOD16-ET, on the other hand, exhibits more sensitivity to land use through the NDVI. Thus, MOD16-ET may exceed the rainfall, which is only realistic if groundwater is present at shallow depths or if the area receives water from upslope contributing areas. In wetter years (Fig. 8 d), the use of MOD16-ET results produces a generally positive water balance, i.e., ET is generally 50-70% of precipitation.
JAMS adopts modules from SWAT (Arnold et al., 1998) for vegetation growth, including a generic database of crop/ vegetation parameters. In the JAMS simulation, crop/vegetation parameters were assigned to HRUs based on land cover in the Sandspruit catchment. Wagner et al. (2011) highlighted that the parameters to model plant growth in SWAT were developed for temperate regions and may thus not be suitable for other climates, such as those occurring in arid and semi-arid regions, because the ET dynamics which are subjected to extreme variations in water availability and available energy may not be replicated adequately by the model. It is argued that the pattern of MOD16-ET driven by vegetation characteristics may be more realistic than the JAMS/J2000-ET, which is driven more by rainfall, given the developmental stages of wheat and pastures.
It should be highlighted that with the increase in the range of available remote-sensing products, it is important to evaluate the accuracy and uncertainty associated with these products before using them in particular studies. This is commonly done through a comparison of EO data and ground-measured data. According to Jovanovic et al. (2015), the MOD16 ET data product has not been widely used to estimate ET in Africa, especially in arid and semi-arid regions. Munch et al. (2013) stated that there are limited amounts of observed data available to evaluate the MOD16 ET data product. Gibson et al. (2013) also stated that limited studies documenting the validation of MOD16 ET in Africa have been published to date. Detailed validation of MOD16 ET should therefore be recognised as a research priority in South Africa.
CONCLUSIONS
With the increased occurrence of drought, there is a need to monitor ET as part of water balance assessments and scenario simulations for management planning. EO products are able to provide estimates of ET from irrigation areas, open water, dryland, plantation areas, wetlands, etc. (King et al., 2011). The provision of such data allows for the analysis of spatial and temporal trends in ET. In this study, the spatial and temporal characteristics of the MOD16 ET dataset and the ET quantified with a distributed water balance model, i.e., JAMS/J2000 (Krause, 2002) were compared and evaluated for the estimation of ET in the semi-arid Western Cape. The following can be concluded from the results:
• Streamflow of the Sandspruit River was simulated reasonably well by the JAMS/J2000 model, with performance criteria (NSE, R2and IOA) generally within the acceptable range. The model was not able to entirely replicate the ephemeral characteristic of the Sandspruit River. Model parameterization considered the temporal behaviour of observed ET.
• JAMS and MOD16 annual values of basin average ET were generally consistent in years when annual rainfall was within the range of the long-term annual average.
• Monthly JAMS-ET and MOD16-ET dynamics are strongly influenced by the response of vegetation to precipitation as well as the atmospheric evaporative demand. Peaks in the datasets were observed in August/September when the maximum biomass was reached. MOD16-ET is less dependent on the seasonal distribution of precipitation and its anomalies.
• No clear spatial trend was evident when comparing JAMS-ET and MOD16-ET at the HRU scale. The largest differences occurred in areas with markedly different land cover, which underlines the importance of considering the actual land cover or management adequately.
The MOD16-ET product is recommended for capturing spatial patterns due to land management. As demonstrated with the dataset of Sandspruit catchment, the monthly spatio-temporal patterns of MOD16-ET driven by vegetation characteristics are realistic. The database of vegetation characteristics of the JAMS model could be updated in order to simulate more realistic land cover and agricultural management. However, this also means a higher input data requirement for the hydrological model. The current generic database of land cover and vegetation characteristics may still be preferred in most cases due to its simplicity, especially for long time series. The JAMS/J2000 model appeared to be suitable to replicate the dynamics of runoff and ET. The JAMS model and its ET estimates were well correlated to vegetation characteristics and water movement through the catchment. JAMS is also sensitive to unusual summer rain events, which are barely captured by SPOT-NDWI and undetected by the MOD16-ET product.
In the face of high climatic variability, the complementary use of hydrological modelling and satellite-derived data may however be the best option. This will allow capturing the ET processes during both average condition and climatically anomalous years. The combination of hydrological modelling and satellite observations may aid in improving components of hydrological models, such as vegetation parameters. Great potential exists in assimilating MOD16-ET data as a direct input to a hydrological model, and thus contributing to a more realistic representation of the hydrological processes, in particular where hydrological data and inputs are scarce.
ACKNOWLEDGEMENTS
This work was supported by the National Research Foundation (NRF, South Africa) and the Ministry of Science and Technology (MINCyT, Argentina) under a South Africa/Argentina bilateral grant; the NRF and the German Federal Ministry of Education and Research under the Southern African Science Service Centre for Climate Change and Adaptive Land Management project, the Water Research Commission (South Africa) under Research Grants and the Council for Scientific and Industrial Research under a Parliamentary Grant. The authors would also like to thank the Department of Water and Sanitation (South Africa) for maintaining the runoff gauge in the study area. The authors would also like to thank the independent reviewers of the paper.
ORCID
Richard Bugan
https://orcid.org/0000-0002-9298-1525
REFERENCES
ALLEN RG, PEREIRA LS and RAES D (1998) Crop evaporation: guidelines for computing crop water requirements. Irrigation and Drainage Paper No 56. FAO, Rome. [ Links ]
ALLEN RG, TASUMI M and TREZZA R (2007a) Satellite-based energy balance for mapping evapotranspiration with internalized calibration (METRIC) - Model. J. Irrig. Drain. Eng. 133 (4) 380-394. https://doi.org/10.1061/(ASCE)0733-9437(2007)133:4(380) [ Links ]
ALLEN RG, TASUMI M, MORSE A, TREZZA R, WRIGHT J, BASTIAANSSEN W, KRAMBER W, LORITE I and ROBINSON CW (2007b) Satellite-based energy balance for mapping evapotranspiration with internalized calibration (METRIC) -Applications. J. Irrig. Drain. Eng. 133 (4) 395-406. https://doi.org/10.1061/(ASCE)0733-9437(2007)133:4(395) [ Links ]
ARNOLD JG, SRINIVASAN R, MUTTIAH RS and WILLIAMS JR (1998) Large-area hydrologic modeling and assessment: Part I. Model development. J. Am. Water Resour. Ass. 34 (1) 73-89. https://doi.org/10.1111/j.1752-1688.1998.tb05961.x [ Links ]
BASTIAANSSEN WGM, MENENTI M, FEDDES RA and HOLTSLAG AAM (1998a) A remote sensing Surface Energy Balance Algorithm for Land (SEBAL) 1. Formulation. J. Hydrol. 212-213 198-212. https://doi.org/10.1016/S0022-1694(98)00253-4 [ Links ]
BASTIAANSSEN WGM, PELGRUM H, WANG J, MA Y, MORENO JF, ROERINK GJ and VAN DER WAL T (1998b) A remote sensing Surface Energy Balance Algorithm for Land (SEBAL) 2. Validation. J. Hydrol. 212-213 213-229. https://doi.org/10.1016/S0022-1694(98)00254-6 [ Links ]
BUGAN RDH (2008) Hydrosalinity fluxes in a small scale catchment of the Berg River (Western Cape). MSc dissertation, University of the Western Cape, Cape Town, South Africa. [ Links ]
BUGAN RDH, JOVANOVIC NZ and DE CLERCQ WP (2012) The water balance of a seasonal stream in the semi-arid Western Cape (South Africa). Water SA 38 (2) 201-212. https://doi.org/10.4314/wsa.v38i2.5 [ Links ]
BUGAN RDH (2014) Modelling and regulating hydrosalinity dynamics in the Sandspruit River catchment (Western Cape). PhD dissertation, Stellenbosch University, Stellenbosch, South Africa. [ Links ]
BUGAN RDH, JOVANOVIC NZ and DE CLERCQ WP (2015) Quantifying the catchment salt balance: An important component of salinity assessments. S. Afr. J. Sci. 111 (5/6) 1-8. https://doi.org/10.17159/sajs.2015/20140196 [ Links ]
CLEUGH HA, LEUNING R, MU Q and RUNNING SW (2007) Regional evaporation estimates from flux tower and MODIS satellite data. Rem. Sens. Environ. 106 285-304. https://doi.org/10.1016/j.rse.2006.07.007 [ Links ]
CSIR and ARC (Council for Scientific and Industrial Research, Agricultural Research Council) (2005) National land cover: raster data set. CSIR, Pretoria. [ Links ]
DE CLERCQ W, JOVANOVIC N, BUGAN R, MASHIMBYE E, DU TOIT T, VAN NIEKERK A, ELLIS F, WASSERFALL N, BOTHA P, STEUDEL T, HELMSCHROT J and FLUGEL W-A (2013) Management of human-induced salinisation in the Berg River catchment and development of criteria for regulating agricultural land use in terms of salt generating capacity. WRC Report No. 1849/1/13. Water Research Commission, Pretoria. [ Links ]
DE CLERCQ WP, JOVANOVIC NZ and FEY MV (2010) Land use impacts on salinity in Berg River water. WRC Report No K5/1503, Water Research Commission, Pretoria. [ Links ]
DING Y, KRISLOCK N, QIAN J and WOLKOWICZ H (2008) Sensor network localization, euclidean distance matrix completions, and graph realization. Research Report CORR 2006-23. University of Waterloo, Ontario, Canada. https://doi.org/10.1145/1410012.1410042 [ Links ]
DWAF (Department of Water Affairs and Forestry, South Africa) (2003) Berg River baseline monitoring project. Description of geohydrological conditions. Groundwater atlas. Department of Water Affairs and Forestry, Pretoria. [ Links ]
DZIKITI S (2016) Personal communication, 29 March 2016. Dr Sebinasi Dzikiti, CSIR, Stellenbosch, South Africa. [ Links ]
FEY MV and DE CLERCQ WP (2004) Dryland salinity impacts on Western Cape rivers. WRC Report No. 1342/1/04. Water Research Commission, Pretoria. [ Links ]
FISCHER C, KRALISCH S, KRAUSE P, FINK M and FLÜGEL W (2009) Calibration of hydrological model parameters with the JAMS framework. In: Proceedings of the 18thWorld IMACS/MODSIM Congress, 13-17 July 2009, Cairns, Australia. 866-872. [ Links ]
FLÜGEL W (1996) Hydrological Response Units (HRUs) as modelling entities for hydrological river basin simulation and their methodological potential for modelling complex environmental process systems. Results from the Sieg catchment. Die Erde 127 43-62. [ Links ]
FLÜGEL W (1995) River salinity due to dryland agriculture in the Western Cape Province, Republic of South Africa. Environ. Int. 21 679-686. https://doi.org/10.1016/0160-4120(95)00073-T [ Links ]
GIBSON LA, JARMAINE C, SU Z and ECKARDT FE (2013) Review: Estimating evapotranspiration using remote sensing and the Surface Energy Balance System - A South African perspective. Water SA 39 (4) 477-484. https://doi.org/10.4314/wsa.v39i4.5 [ Links ]
GLENN EP, DOODY TM, GUERSCHMAN JP, HUETE AR, KING EA, MCVICAR TR, VAN DIJK AIJM, VAN NIEL TG, YEBRA M and ZHANG Y (2011) Actual evapotranspiration estimation by ground and remote sensing methods: the Australian experience. Hydrol. Process. 25 4103-4116. https://doi.org/10.1002/hyp.8391 [ Links ]
GORGENS AHM and DE CLERCQ WP (2006) Research on Berg River water management. summary of water quality information system and soil quality studies. WRC Report No 252/06. Water Research Commission, Pretoria. [ Links ]
HAY LE, MARKSTROM SL and WARD-GARRISON C (2010) Watershed-scale response to climate change through the twenty-first century for selected basins across the United States. Earth Interact. 15 1-37. https://doi.org/10.1175/2010EI370. [ Links ]!
HUGHES DA (2008) Modelling semi-arid and arid hydrology and water resources - The Southern African experience. In: Wheater H, Sorooshian S and Sharma KD (eds.). Hydrological Modelling in Arid and Semi-Arid Areas. IHP International Hydrology Series. Cambridge University Press, Cambridge. [ Links ]
HUGHES DA, JEWITT G, MAHÉ G, MAZVIMAVI D and D STISEN S (2015) A review of aspects of hydrological sciences research in Africa over the last decade. Hydrol. Sci. J. 60 (11) 1865-1879. https://doi.org/10.1080/02626667.2015.1072276JANSSEN [ Links ]
PHM and HEUBERGER PSC (1995) Calibration of process-orientated models. Ecol. Model. 83 55-66. https://doi.org/10.1016/0304-3800(95)00084-9 [ Links ]
JARMAINE C and MENGISTU MG (2011) Validating energy fluxes estimated using the surface energy balance system (SEBS) model for a small catchment. WRC Report No. K8/824. Water Research Commission, Pretoria. [ Links ]
JOVANOVIC N, GARCIA CL, BUGAN RDH, TEICH I and GARCIA RODRIGUEZ CM (2014) Validation of remotely-sensed evapotranspiration and NDWI using ground measurements at Riverlands, South Africa. Water SA 40 (2) 211-220. https://doi.org/10.4314/wsa.v40i2.3 [ Links ]
JOVANOVIC N, MU Q, BUGAN RDH and ZHAO M (2015) Dynamics of MODIS evapotranspiration in South Africa. Water SA 41 (1) 79-90. https://doi.org/10.4314/wsa.v41i1.11 [ Links ]
JUSTICE CO, TOWNSHEND JRG, VERMOTE EF, MASUOKA E, WOLFE RE and SALEOUS N (2002) An overview of MODIS Land data processing and product status. Rem. Sens. Environ. 83 3-1 5. https://doi.org/10.1016/S0034-4257(02)00084-6 [ Links ]
KALMA JD, MCVICAR TR and MCCABE MF (2008) Estimating land surface evaporation: a review of methods using remotely sensed surface temperature data. Surv. Geophys. 29 421-469. https://doi.org/10.1007/s10712-008-9037-z [ Links ]
KING EA, VAN NIEL TG, VAN DIJK AIJM, WANG Z, PAGET MJ, RAUPACH T, GUERSCHMAN J, HAVERD V, MCVICAR TR, MILTENBURG I, RAUPACH MR, RENZULLO LJ and ZHANG Y (2011) Actual evapotranspiration estimates for Australia: Inter-comparison and evaluation. CSIRO: Water for a Healthy Country, National Research Flagship. CSIRO, Australia. [ Links ]
KINGSTON DG, TODD MC, TAYLOR RG, THOMPSON JR and ARNELL NW (2009) Uncertainty in the estimation of potential evapotranspiration under climate change. Geophys. Res. Lett. 36 1-6. https://doi.org/10.1029/2009GL040267 [ Links ]
KRAUSE P (2002) Quantifying the impact of land use changes on the water balance oflarge catchments using the J2000 model. Phys. Chem. Earth 27 663-673. https://doi.org/10.1016/S1474-7065(02)00051-7 [ Links ]
KRAUSE P, BASE F, BENDE-MICHL U, FINK M, FLÜGEL W and PFENNIG B (2006) Multiscale investigations in a mesoscale catchment - hydrological modelling in the Gera catchment. Adv. Geosci. 9 53-61. https://doi.org/10.5194/adgeo-9-53-2006 [ Links ]
KRAUSE P, BENDE-MICHL U, FINK M, HELMSCHROT J, KRALISCH S and KUNNE A (2009) Parameter sensitivity analysis of the JAMS/ J2000-S model to improve water and nutrient transport proceses simulation - a case study for the Duck catchment in Tasmania. In: Andersen R, Braddock RD and Newham LTH (eds.) Proceedings of the 18th World IMACS Congress and MODSIM09, 13-17 July 2009, Cairo, Australia. [ Links ]
KRAUSE P, BOYLE D and BASE F (2005) Comparison of different efficiency criteria for hydrological model assessment. Adv. Geosci. 5 89-97. https://doi.org/10.5194/adgeo-5-89-2005 [ Links ]
LEAVESLEY GH, LICHTY RW, TROUTMAN BM and SAINDON LG (1983) Precipitation-Runoff Modelling System - User's Manual. Water Resources Investigation Report 83-4238, United States Geological Survey, Washington DC. [ Links ]
LEGATES DR and MCCABE GJ (1999) Evaluating the use of "goodness-of-fit" Measures in hydrologic and hydroclimatic model validation. Water Resour. Res. 35 (1) 233-241. https://doi.org/10.1029/1998WR900018 [ Links ]
LITTELL RC, MILLIKEN GA, STROUP WW, WOLFINGER RD and SCHABENBERGER O (2006) SAS for Mixed Models (2nd edn). SAS Institute Inc., Cary, NC. [ Links ]
LIN L (1989) A concordance correlation coefficient to evaluate reproducibility. Int. Biometric Soc. 45 (1) 255-268. https://doi.org/10.2307/2532051 [ Links ]
MCCABE MF and WOOD EF (2006) Scale influences on the remote estimation of evapotranspiration using multiple satellite sensors. Rem. Sens. Environ. 105 271-285. https://doi.org/10.1016/j.rse.2006.07.006 [ Links ]
MILLY PCD and DUNNE KA (2010) On the hydrologic adjustment of climate-model projections: The potential pitfall of potential evapotranspiration. Earth Interact. 15 1-14. https://doi.org/10.1175/2010EI363.1 [ Links ]
MIRALLES DG, HOLMES TRH, DE JEU RAM, GASH JH, MEESTERS AGCA and DOLMAN AJ (2011) Global land-surface evaporation estimated from satellite-based observations. Hydrol. Earth Syst. Sci. 15 (2) 453-469. https://doi.org/10.5194/hess-15-453-2011 [ Links ]
MONTEITH JL (1965) Evaporation and environment. Symp. Soc. Exp. Biol. 19 205-234. [ Links ]
MU Q, HEINSCH FS, ZHAO M and RUNNING SW (2007a) Development of a global evapotranspiration algorithm based on MODIS and global meteorology data. Rem. Sens. Environ. 111 519-536. https://doi.org/10.1016/j.rse.2007.04.015 [ Links ]
MU Q, ZHAO M, HEINSCH FS, LIU M, TIAN H and RUNNING SW (2007b) Evaluating water stress controls on primary production in biogeochemical and remote sensing based models. J. Geophys. Res. 112 1-13. https://doi.org/10.1029/2006JG000179 [ Links ]
MU QZ, ZHAO MS and RUNNING SW (2011) Improvements to a MODIS global terrestrial evapotranspiration algorithm. Rem. Sens. Environ. 115 1781-1800. https://doi.org/10.1016/j.rse.2011.02.019 [ Links ]
MUNCH Z, CONRAD J, GIBSON LA, PALMER AR and HUGHES DA (2013) Satellite earth observation as a tool to conceptualize hydrogeological fluxes in the Sandveld, South Africa. Hydrogeol. J. 21 1053-1070. https://doi.org/10.1007/s10040-013-1004-1 [ Links ]
NASH JE and SUTCLIFFE JV (1970) River flow forecasting through conceptual models. Part I-A: Discussion of principles. J. Hydrol. 10 282-292. https://doi.org/10.1016/0022-1694(70)90255-6 [ Links ]
OKSANEN J, BLANCHET FG, KINDT R, LEGENDRE P, MINCHIN PR, O'HARA RB, SIMPSON GL, SOLYMOS P, STEVENS MHH and WAGNER H (2013) Package 'vegan'. Community Ecology Package 2 (9) 1-295. [ Links ]
PALMER AR and YUNUSA I (2011) Biomass production and water use efficiency of arid rangelands in the Riemvasmaak Rural Area, Northern Cape, South Africa. J. Arid Environ. 75 1223-1227. https://doi.org/10.1016/j.jaridenv.2011.05.009 [ Links ]
PINHEIRO J, BATES D, DEBROY S, SARKAR D and R CORE TEAM (2017) nlme: Linear and Nonlinear Mixed Effects Models. R package version 3.1. URL: https://CRAN.R-project.org/package=nlme (Accessed 18 July 2018). [ Links ]
SCHULZE RE (1994) Hydrology and agrohydrology: a text to accompany the ACRU-300 agrohydrological modelling system. Agricultural Catchments Research Unit, Department of Agricultural Engineering, University of Natal, South Africa. [ Links ]
SMOUSE PE, LONG JC and SOKAL RR (1986) Multiple regression and correlation extensions of the Mantel Test of matrix correspondence. Syst. Zool. 35 (4) 627-632. https://doi.org/10.2307/2413122 [ Links ]
STEUDEL T, BUGAN RDH, KIPKA H, PFENNIG B, FINK M, DE CLERCQ WP, FLÜGEL W and HELMSCHROT J (2015) Implementing contour bank farming practices into the J2000 model to improve hydrological and erosion modelling in semi-arid Western Cape Province of South Africa. Hydrol. Res. 46 (2) 192-211. https://doi.org/10.2166/nh.2013.164 [ Links ]
SU Z (2002) The Surface Energy Balance System (SEBS) for estimation of turbulent heat fluxes. Hydrol. Earth Syst. Sci. 6 85-99. https://doi.org/10.5194/hess-6-85-2002 [ Links ]
USGS (United States Geological Survey) (2003) Shuttle Radar Topography Mission (SRTM), 90 m resolution. United States Geological Survey, Washington DC. [ Links ]
VGT4AFRICA (2013) Available from: URL: http://www.vgt4africa.org (Accessed 10 October 2013). [ Links ]
VISSER D (1989) Explanation of the 1:1 000 000 geological map, fourth edition, 1984: The geology of the Republics of South Africa, Transkei, Bophuthatswana, Venda, and Ciskei and the Kingdoms of Lesotho and Swaziland. Geological Survey, Pretoria, South Africa. [ Links ]
WAGENER T, MCINTYRE N, LEES J, WHEATER HS and GUPTA H (2003) Towards reduced uncertainty in conceptual rainfall-runoff modelling: Dynamic identifibility analysis. Hydrol. Process. 17 455-476. https://doi.org/10.1002/hyp.1135 [ Links ]
WILLMOTT CJ (1981) On the validation of models. Phys. Geogr. 2 184-194. https://doi.org/10.1080/02723646.1981.10642213 [ Links ]
 Correspondence:
Richard Bugan
Email: rbugan@csir.co.za
Received: 20 July 2018
Accepted: 30 March 2020

