


Serviços Personalizados
Artigo
 Inglês (pdf)
 Artigo em XML
 Referências do artigo
Indicadores

Links relacionados
-
 Citado por Google
 -
 Similares em Google
Compartilhar

 Permalink
Water SA
versão On-line ISSN 1816-7950
versão impressa ISSN 0378-4738
Water SA vol.46 no.1 Pretoria Jan. 2020
http://dx.doi.org/10.17159/wsa/2020.v46.i1.7894
RESEARCH PAPERS
Impact of irrigation strategies on maize (Zea mays L.) production in the savannah region of northern Togo (West Africa)
Agossou Gadédjisso-TossouI, II; Tamara AvellánI; Niels SchützeII
IUnited Nations University Institute for Integrated Management of Material Fluxes and of Resources Ammonstrasse 74, 01067 Dresden, Germany
IIInstitute of Hydrology and Meteorology, Technische Universität Dresden, 01069 Dresden, Germany
ABSTRACT
In northern Togo where rainfed maize is one of the major crops grown, agriculture is subject to frequent yield losses due to erratic rainfall. To ensure food availability and improve agricultural productivity, it is necessary to produce maize during the dry season under irrigation. A sound application of full and deficit irrigation requires a thorough understanding of the crop parameters and yield response to water. Thus, this study investigated the effect of full and deficit irrigation on maize plant above-ground biomass, leaf area index, canopy cover, plant height, and grain yield. A field experiment was carried out from December 2017 to April 2018 in northern Togo at the agronomic research institute. Full irrigation (FI), 80% FI, and 60% FI treatments were applied. The results showed that in the late-season stage, the differences in biomass between FI and 60% FI were significant (p < 0.05). On average, FI had the greatest grain yield (2 200.4 kg/ha), while the lowest grain yield was recorded under 60% FI (1 068.3 kg/ha). The grain yield differences between FI and 60% FI were significant. Nevertheless, the grain yield differences between FI and 80% FI were not significant (p > 0.05). 80% FI had water use efficiency (WUE) (0.22 kg/m3) similar to that of FI (0.21 kg/m3), on average. The results of this study illustrate that deficit irrigation must be carefully managed since slight differences in the application volumes affect the biomass and yield of maize significantly. Under a moderate level of deficit irrigation (vegetative and reproductive growth stages) the biomass and the grain yield of maize are reduced. However, a moderate level of deficit irrigation during the vegetative growth stage could result in similar values of WUE to that of FI.
Keywords: evapotranspiration, deficit irrigation, water use efficiency, crop yield, maize
INTRODUCTION
The world population is growing persistently, and people's desire for higher living standards is also increasing (UN DESA, 2015). As a result, there is a change in diet towards more meat and dairy product consumption in the developing world (Kearney, 2010). This situation is putting more stress on water resources all over the world, especially in arid areas (Rosegrant, 2016). In West Africa, the population will increase more than two-fold by 2050 (UN DESA, 2017). At the same time, the demand for cereals will almost triple, while the present levels of cereal consumption already rely on considerable imports (Van Ittersum et al., 2016). Liniger et al. ( 2011) reported that to meet the necessary caloric requirements, food production in the region, should increase by 70% by 2050. However, the agricultural sector has been subject to numerous obstacles, including water-related challenges.
Owing to the growing population, the pressure on water bodies has increased. Thus, the quality and quantity of water that can be used for irrigation has decreased in the West African region (Kotir, 2011). Additionally, this region has been described as one of the most sensitive regions to the impacts of climate variability and change because of its dependence on rainfed agriculture (Kotir, 2011). There is a change in the seasonal distribution and intensity of rainfall as well as an increase in the temperature in the region (Lobell and Gourdji, 2012). Thus, to be able to feed the increasing population, we need to produce higher crop yields with a limited amount of water. Within this context, deficit irrigation might be a strategy for addressing the issue in West Africa. Deficit irrigation practices could contribute to enhancing crop productivity in the area (Djaman et al., 2013).
Djaman et al. (2013) pointed out that limited irrigation can lead to considerably different productivities in varying climatic conditions. For instance, Howell et al. (1995) reported that limited irrigation of maize decreased yields by affecting the kernel weight and the number of kernels per ear in the semi-arid region of Bushland, Texas. Similar findings were obtained by Pandey et al. (2000a) in the Sahelian environment of Niger. Deficit irrigation and water stress affected maize grain yield significantly under semi-arid climatic conditions in the south-west of Iran (Khaksar et al., 2013). Farré and Faci (2006) indicated that maize phenology, crop water uptake, total above-ground biomass and yield were significantly affected by irrigation treatments in the semi-arid conditions of northeast Spain. The AquaCrop model has shown good performance in evaluating the effects of deficit irrigation on maize production under diverse environmental conditions, including a semi-arid climate (Ahmadi et al., 2015).
Didjeira et al. (2007) identified maize as the staple food in Togo, as it represents 60% of the cereals consumed by the population. In northern Togo, where there is only one rainy season annually, to provide maize throughout the year some farmers are cultivating it under limited irrigation in the dry season. These farmers receive little help from the scientific research community. The correct application of limited irrigation requires a thorough understanding of the crop parameters and yield responses to water. The knowledge of crop parameter response to different irrigation water levels is essential for effective on-farm limited irrigation management practices (Djaman et al., 2013). Few studies have been conducted to assess crop yield response to water in Togo, especially for the northern part.
This study assesses the maize crop response to several variables under full and limited irrigation conditions. Specifically, the study aimed to (i) quantify the effect of limited irrigation management practices on maize plant height, above-ground biomass, leaf area index (LAI), green canopy cover (CC), and yield; and (ii) evaluate the deficit irrigation stress index of these maize crop parameters concerning the growth stages.
METHODS
Site description
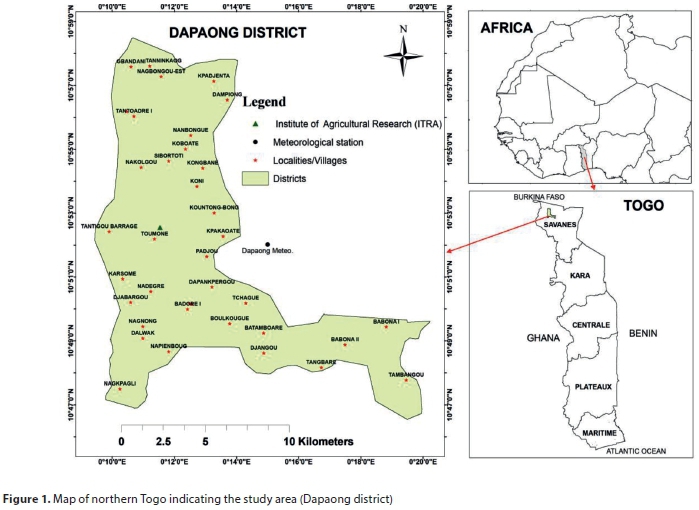
The study was conducted in Northern Togo, at ITRA (Institut Togolais de Recherche Agronomique) research station (10°52′49.13″ N, 0°11′31.90″ E, 295 m amsl) (Fig. 1). The climate is hot semi-arid (BSh) according to Köppen-Geiger's climatic classification (Kottek et al., 2006). The cropping season in the area lasts from May to October. The dry season ranges from November to April. Climate data (1983-2011) used were collected from the Dapaong climate station located 5 km from the experimental site and which is the closest station.
Experimental design
The experiment was carried out during the dry season from November 2017 to April 2018. The local maize crop short cycle variety (TZEE-W) was used for the experiment. TZEE-W has a growth cycle of 90-95 days and an average dry grain yield of 2 000 kg/ha (Didjeira et al., 2007). The experiment consisted of 3 irrigation treatments, replicated 3 times, arranged in a randomised complete block design (RCBD). There was a total of 9 plots of 20 m2 each, manually ploughed. A buffer of 2 m width was created around the perimeter of each parcel to avoid border and interaction effects.
Irrigation treatments
The treatment designs are of a single factor, where the treatment variation was based only on the volume of irrigation water applied and the irrigation scheduling. The water was applied using a micro-sprinkler system. The three irrigation levels included a full irrigation (FI) treatment and two deficit treatments as follows:
•The FI treatment

where V represents the total volume of water utilised; q is the amount of water applied for an event i.
•The first deficit treatment is Optimized Controlled Deficit Irrigation (OCDI). It consisted of 80% of the total volume of FI.

•The second deficit treatment is Controlled Deficit Irrigation (CDI). It consisted of modifying the schedule of the FI by applying 60% of the volume water of each irrigation event.

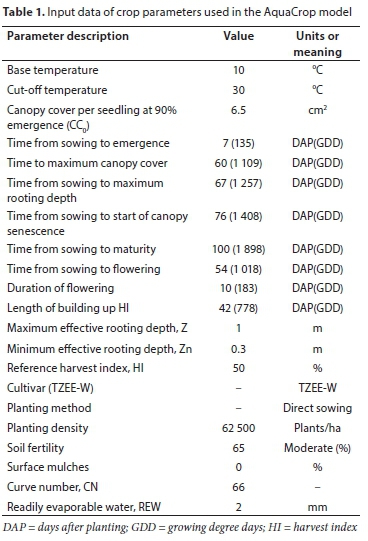
Figure 2 shows the framework used to generate the OCDI schedule for our experiment. This framework consists of: (i) a weather generator, the Long Ashton Research Station Weather Generator (LARS-WG) (Semenov et al., 1998) for simulating long climate time series; (ii) the AquaCrop model (Hsiao et al., 2009) which was used to simulate the irrigation system during the cropping season (Fig. 2, Loop 1); and (iii) a problem-specific programme for optimal irrigation scheduling under limited water supply (Fig. 2, Loop 2). The latter is named Global Evolutionary Technique for OPTimal Irrigation Scheduling (GET-OPTIS) (For more details, see Schütze et al., 2012). A maximum volume of water is given to GET-OPTIS, which produces an optimised irrigation schedule based on the climate, soil, and crop information provided. Then, this schedule is used by AquaCrop version 5.0 for yield prediction. A 100-year simulation was run using the same climate data and calibrated maize crop information from Gadédjisso-Tossou et al. (2018). The details of the observed meteorological data from the nearest station used in this study and the calibration details are reported in Gadédjisso-Tossou et al. (2018). The input data of crop parameters used in the AquaCrop model are presented in Table 1.
Since the simulations were done stochastically, an exceedance probability of 0.9 was used to reach a given maximum level of yield. Based on these simulations, the best optimised general irrigation schedule was obtained and implemented during our field experiment as OCDI. The schedule of FI treatment was also obtained from the crop simulation but without applying GET-OPTIS.
The FAO Penman-Monteith method was employed to calculate the reference evapotranspiration (ET0) (mm/day) throughout the growing season. The crop coefficient of maize (Kc) for specific growth stages was retrieved from FAO-56 standard values (Allen et al., 1998). These values were adjusted to the climate of the experimental site (semi-arid) and are similar to the values reported by Abdulmumin and Misari (1990) for maize in semi-arid tropics of Nigeria, West Africa.
•Initial stage (25 days): Kc ini = 0.5
•Crop development stage (30 days): Kc dev = 0.85
•Mid-season stage (40 days): Kc mid = 1.2
•Late season stage (15 days): Kc end = 0.9
Then, the Kc was used to compute the crop evapotranspiration (ETc) (mm/day) throughout the cropping period of the experiment. The ETc was calculated as follows (Allen et al., 1998)

The FI, 80% FI, and 60% FI treatments represent 1.4 ETc, 1.1 ETc, and 0.8 ETc, respectively.
Crop management practices
During the experiment, crops were exposed to the same field management practices, which follow the recommendation of ITRA. The maize seeds were sown with an inter-row distance of 0.8 m. The spacing within the rows was 0.35 m. Three seeds were put in each hole, then separated and adjusted to 2 plants per hole after emergence. This resulted in a plant density of 70 000 plants/ha. All plots were fertilised equally. A composite fertiliser N15P15K15 was applied at the rate of 200 kg/ha on the 15th day after sowing. Moreover, the urea (46% N) was utilised at the rate of 100 kg/ha on the 35th day after sowing (Mathe et al., 2008). The fertilisers were manually point-placed at approximately 0.05 m depth and 0.07-0.1 m distance from the plants. The plots were weeded at the time of fertiliser application to avoid the competition between the maize plants and weeds for light, nutrients, or water. Insects and diseases were rigorously controlled for the experiment to avoid crop failure and reduction in yield. Therefore, insecticide (EMACOT 050 WG: emamectin benzoate 50 g/kg) and fungicide (Calthio C 50 WS: thiram 25%, chlorpyrifos-ethyl 25%) were applied uniformly to all plots when needed.
Soil characteristics and infiltration measurements
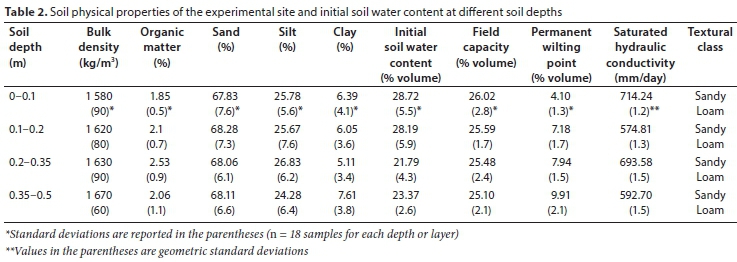
Table 2 shows the essential soil physical characteristics of the experimental site, the initial soil water content and the hydraulic properties for the experiment. The soil samples were taken at two points horizontally on a diagonal of the plots. Four soil depths were considered. Thus, 8 soil samples were taken from each plot. The soil organic matter was measured in the laboratory using the modified Walkley-Black method (Walkley and Black, 1934). The soil texture was determined by mechanical analysis using the pipette method (DIN ISO 11277) (International Organization for Standard, 2009). We followed the United States Department of Agriculture soil textural classification system (USDA, 1987). The soil moisture was determined on all plots at the beginning and the end of the experiment using the gravimetric method. The soil at the experimental field is classified as sandy loam, according to the World Reference Base for Soil Resources, dystric-ferric luvisols (IUSS Working Group WRB, 2015) (Table 2). The soil is relatively poor in organic matter at the top 0.1 m.
The infiltration rate was measured at 0.05 m and 0.15 m of soil depth using a double ring infiltrometer according to ASTM D3385-03 standard test method and DIN 19682-7 (1997). The aim of using the double ring infiltrometer is to limit the lateral spread of water after penetration. It consisted of a pair of steel infiltration rings with 0.28/0.53 m diameters. The height of the rings was 0.25 m, and they have one cutting edge. The rings were inserted into the soil partially (0.05 m) and filled with water. After that, we recorded the water depth and corresponding time of its infiltration in the soil.
Plant height, above-ground biomass, leaf area index, and green canopy cover measurements
These parameters were monitored throughout the growing season. During the experiment, the heights of plants were measured at regular 10-day intervals from 15 days after sowing to maturity. The plant height was measured using a measuring tape from the soil surface to the highest point of the arch of the uppermost leaf whose tip is pointing down. For this purpose, three randomly selected plants in the middle rows of each plot were tagged. Three plants per plot were randomly selected, clipped at the soil surface, then sun-dried until a constant weight was observed, to measure the biomass. This occurred at 20-day intervals from 15 days after sowing to maturity. The biomass included grain and stover. For LAI, the area of each of the fresh leaves of the tagged plants was determined using a non-destructive method. First, the leaf area was calculated by multiplying the manually measured length and maximal width of each leaf with a shape factor k, empirically determined to be 0.75 for maize, by the plant density (Lizaso et al., 2003) (Eq. 5).

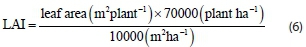
Where LA represents leaf area, L is leaf length, W stands for the maximum leaf width, and 0.75 is the coefficient used for maize (Yi et al., 2010). Then, the LAI was determined using Eq. 6.
The CC was obtained from the LAI by using the following formula (Hsiao et al., 2009).

The growth of the maize crop is strongly related to the accumulation of the daily temperature, known as growing degree day (GDD). Its cumulative form is commonly expressed as (Djaman et al., 2013):

where Tmax is maximum air temperature, Tmin is minimum air temperature, Tbase is the base temperature threshold (below which crop development does not progress), and n is the number of days. In this study, the base temperature and the maximum temperature thresholds used are 10°C and 30°C, respectively. This means, for instance, that when the temperature values exceed the upper limit, they were reset equal to 30°C (Djaman et al., 2013).
Maize yield and water use efficiency (WUE)
At the end of the growing period, maize grain yield was harvested at physiological maturity from all plots. The harvest area of 12 m2 (4 m × 3 m), including the four middle rows, was considered for the yield quantification. The harvest was executed by hand when all leaves were dry. Then, the maize grains were separated from the cobs and sun-dried until a constant weight was observed (at 12-14% moisture content). Water use efficiency (WUE), yield per unit water consumed, was also evaluated for all the irrigation treatments.
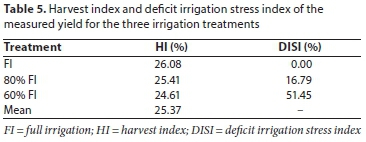
The Harvest Index (HI) was calculated by dividing the grain yield by the biomass after adjusting for moisture content. The Deficit Irrigation Stress Index (DISI) of the crop yield was calculated as follows (Pandey et al., 1984):
The DISI of the other crop growth parameters was computed similarly.
Statistical analyses
The comparison of the biomass, LAI, CC, plant height and grain yield among treatments was performed by an analysis of variance (Anova). The Shapiro-Wilk (Shapiro and Wilk, 1965) test was applied to determine if the measured quantities were normally distributed. The PROC Anova in Statistical Analytical System (SAS) (SAS Institute Inc, 2015) was used to run the analysis of variance. The treatment means were separated using Tukey's Honestly Significant Difference (HSD) at 5% significance level.
Effects of irrigation regimes and plant densities on the dry grain yield and dry above-ground biomass
The crop data collected during the experiment were used to calibrate AquaCrop in order to simulate the effects of different irrigation regimes and plant densities on the grain yield and biomass. There are two plant densities recommended by extension agents in the study area: (i) 0.8 m distance between rows and 0.35 m between two plants in a row, which gives 70 000 plants/ha (Pd1); and (ii) 0.8 m distance between rows and 0.4 m between two plants in a row, which gives 62 500 plants/ha (Pd2). These two plant densities were considered in the analysis. Following the field experiment, 3 irrigation regimes (Ir1, Ir2 and Ir3) were distinguished by withholding water at specific growth stages (Table 3). The combination of the irrigation regimes and plant densities gave 6 scenarios Pd1-Ir1, Pd1-Ir2, Pd1-Ir3, Pd2-Ir1, Pd2-Ir2, and Pd2-Ir3, which were evaluated using AquaCrop version 5.0. Also, these scenarios were assessed using the irrigation optimiser GET-OPTIS to improve the outputs.

RESULTS
Weather conditions
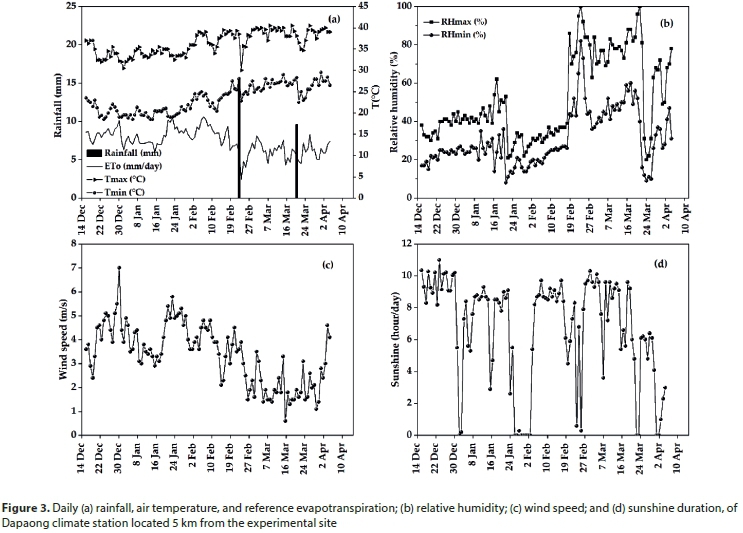
Figure 3 shows the daily rainfall, air temperature, and reference evapotranspiration, relative humidity, wind speed, and sunshine throughout the experiment. The average daily maximum and minimum air temperatures were 36°C and 23°C, respectively (Fig. 3a). The daily maximum as well as minimum temperatures were relatively low from mid-December 2017 to the end of January 2018. Both maximum and minimum temperatures reached their highest level in March 2018, at 40.5°C and 29.5°C, respectively (Fig. 3a). During the growing season, rainfall occurred only on 23 February (15.5 mm) and 21 March (9.5 mm) 2018. The daily reference evaporation, from mid-December 2017 to mid-February 2018, fluctuated between 6 and 10.5 mm/day, while from mid-February to end of March 2018 it ranged from 2.5 to 8 mm/day (Fig. 3a).
The daily maximum and minimum relative humidities, from mid-December 2017 to mid-January 2018, fluctuated around 40% and 20%, respectively. From mid-February to the end of March 2018, they reached 80% and 40%, respectively (Fig. 3b). The lowest level of daily wind speed was observed from mid-February to the end of March 2018 (Fig. 3c). Throughout the growing season, the sunshine duration fluctuated around 8 h/day. The lowest values of sunshine duration were recorded towards the end of the growing season (i.e., 1-4.8 h/day) (Fig. 3d).
Soil infiltration during the experiment
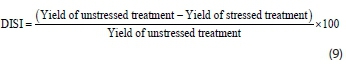
The infiltration results are shown in Fig. 4. Infiltration rates at 0.15 m soil depth were greater than the infiltration rates at 0.05 m depth soil depth at the beginning of the measurements. For instance, during the first 5 min, the infiltration rate at 0.15 m soil depth was 0.6 m/h whereas the rate at 0.05 m soil depth was 0.3 m/h (Fig. 4). However, the infiltration rates tend to be constant and similar for both soil depths after 200 min of continuous measurement.
Effect of irrigation levels on plant height, above-ground biomass, leaf area index, green canopy cover, grain yield, and water use efficiency
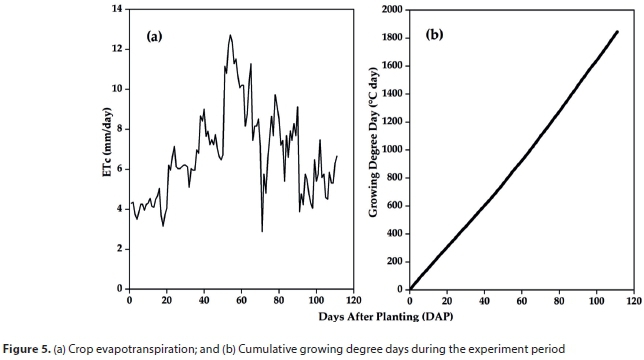
Figure 5 shows the daily maize crop evapotranspiration and the cumulative GDD during the experimental period. The daily maize crop evapotranspiration ranged from 2.9 to 12.7 mm/day, with the highest value being recorded in February 2018 (50-70 days after planting (DAP)) (Fig. 5a). This period is part of the mid-season growth stage of the maize crop during the experiment. Also known as thermal units (TU), the cumulative GDD from emergence to harvest was 1 845°C (Fig. 5b).
The crop evapotranspiration and the volume of irrigation water applied throughout the experiment for the three treatments are presented in Table 4. The maize crop FI water applied in the dry season in northern Togo was 1 038.5 mm (Table 4). From sowing (16 December 2017), it took 111 days to reach maturity (5 April 2018), which was when the plants dried up in the field. With deficit irrigation, 40% less water is applied (i.e., 632.6 mm vs. 1 038.5 mm). For all three treatments, the total volume of water applied during the mid-season stage was greater than the amount of water used in the other growth stages. The total crop evapotranspiration computed from sowing to harvest, using the meteorological station weather data as well as the adjected crop coefficients, was 755.2 mm. This value is higher than the crop evapotranspiration obtained from AquaCrop (< 730 mm) when simulating the experiment with the data collected from the field (Table 4).

The biomass, LAI, CC, and plant height during the experiment are depicted in Fig. 6. The biomass increased rapidly during the development and mid-season stages, peaked and then declined, indicating the beginning of leaf senescence, under all three treatments. The 80% FI induced a later peak compared to the other treatments (Fig. 6a) and a subsequent decline in the biomass at the end of the mid-season stage. Also, the values of the biomass at emergence were statistically similar (p > 0.05) under the FI, 80% FI and 60% FI. However, in the late season stage, the differences in the biomass were significant (p < 0.05) between FI and 60% FI (Fig. 6a). The plants under 60% FI had the lowest LAI and CC, while the greatest values of these parameters were recorded for the fully irrigated plants. From emergence, under FI, 80% FI and 60% FI, the CC and the LAI increased rapidly during the developmental and mid-season stages, peaked at mid-season stage (≈ 75 DAP, cumulative TU = 1 185°C) and then declined indicating leaf senescence (Fig. 6b,c). Similarly, under FI, 80% FI and 60% FI, plant height increased quickly during the development and mid-season stages, peaking at the end of the mid-season stage (≈ 85 DAP, cumulative TU = 1 368°C). From then on, plant height seemed to be constant until the harvest under the three treatments (Fig. 6d). Maximum plant height varied from 1.33 m (60% FI) to 2.12 m (FI).
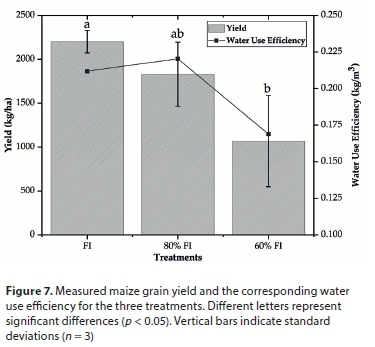
Figure 7 shows the average measured maize grain yield and WUE of the three treatments at the end of the experiment. FI had the greatest grain yield (2 200.4 kg/ha), while the lowest grain yield was recorded under 60% FI (1 068.3 kg/ha) (Fig. 7). Also, the grain yield differences between FI and 60% FI were significant (p < 0.05). Nevertheless, the grain yield differences between FI and 80% FI were not significant (p > 0.05). The 80% FI had WUE (0.22 kg/m3) similar to that of FI (0.21 kg/m3). The highest variability in the grain yield was observed under 60% FI (Fig. 7).
Evaluation of harvest index and deficit irrigation stress index of maize grain yield and crop growth parameters
The maize yield HI and DISI are presented in Table 5. The maize crop harvest index ranged between 24.61 (60% FI) and 26.08 (FI) with an average of 25.37 (Table 5). The DISI for the grain yield under 60% FI was approximately 3 times greater than that of 80% FI (Table 5). Thus, the maize grain yield under 60% FI experienced more water-related stress than that under the other treatments.
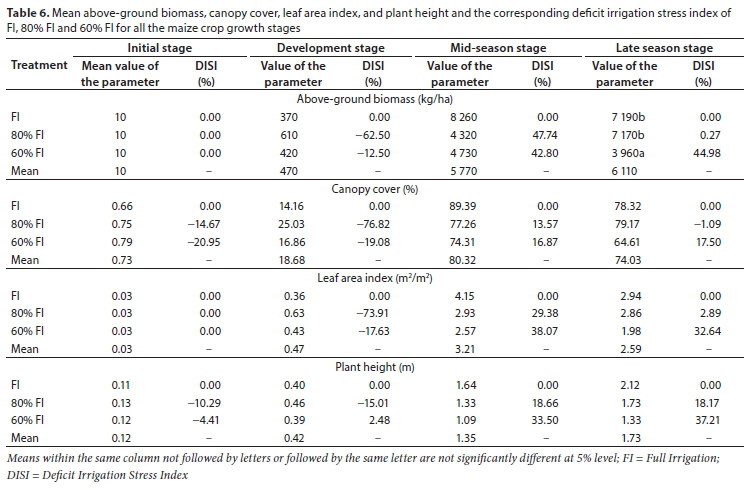
The results in Table 6 illustrate the mean biomass, CC, LAI, and plant height and the corresponding DISI of FI, 80% FI, and 60% FI for all the maize crop growth stages. The biomass, CC, LAI, and plant height differences among FI, 80% FI and 60% FI were not significant (p > 0.05) for all the crop growth stages except the biomass during the late-season stage (Table 6). Considering the fully irrigated maize as a reference treatment, the maize crops under 80% FI and 60% FI did not experience any stress due to lack of water supply during the initial and development stages. However, the plants under 80% FI and 60% FI were subject to stresses related to a shortage of water during the mid-season and late-season stages (Table 6). Mainly, these stresses were more pronounced for 60% FI than 80% FI. For instance, the DISI for LAI and plant height under 80% FI ( 60% FI) were 29.38 (38.07) and 18.66 (33.5), respectively, during the mid-season stage. Similarly, the DISI for biomass under 60% FI was approximately 40 times greater than that under 80% FI during the late-season stage (Table 6).
Effects of irrigation regimes and plant densities on the dry grain yield and dry above-ground biomass
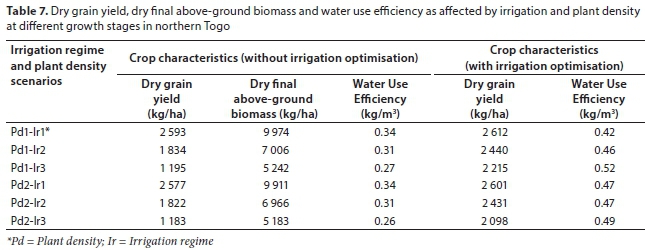
The dry grain yield, as well as the final dry biomass, were linearly affected by deficit irrigation at all plant densities (Table 7). Deficit irrigation was created by withholding water at different maize growth stages. When 4 irrigations were withheld (Ir2) at V3, V7, V11 and VT (vegetative phases), 29.3% and 29.7% reductions in the grain yield and final biomass occurred at all plant densities, respectively. When deficit irrigation was imposed during the reproductive phases in addition to the vegetative growth stages (Ir3), grain yield and final biomass reductions of up to 54% and 48%, respectively, were observed at all plant densities. Yield, as well as biomass, decreased slightly when the plant density reduced (Pd2), for all irrigation regimes assessed. Generally, WUE had not increased when irrigation was withheld during vegetative and reproductive stages (Ir2 and Ir3) compared to FI (Ir1). However, a moderate level of deficit irrigation during vegetative growth stages (Ir2) could result in similar WUE values to that of the fully irrigated treatment. Also, the results showed that the optimisation of all the irrigation regimes by applying GET-OPTIS has contributed to improving the dry grain yield and at the same time using less water as compared to the scenarios without optimisation. This is supported by the increase in the WUE for all the optimised scenarios.
DISCUSSION
A maize crop responds differently to various volumes of irrigation water applied from emergence to harvest. In this study, the biomass - including grain and stover at physiological maturity - and grain yield were significantly affected by the irrigation regimes. Regarding crop response to water performance, the 80% FI treatment was very similar to the fully irrigated treatment.
Lower temperatures in December and January caused differences in the reference and crop evapotranspirations between early and late growth stages. Although the temperatures were relatively low during the initial stage, they contributed to achieving seed germination and emergence rates of more than 90%. The fact that the biomass, LAI, and CC increased dramatically during the mid-season stage can be explained by the combined effect of higher temperatures and sufficient water supplied in this stage. Also, the wind speed was relatively high during the mid-season stage, inducing high crop evapotranspiration. A substantial amount of biomass was produced. Temperatures have no significant effect on maize crop growth during the late-season stage because senescence was reached and subsequently photosynthesis was reduced.
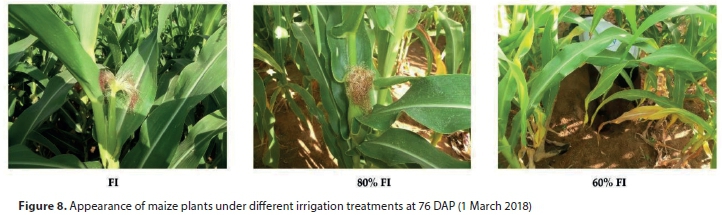
There were no significant differences (p > 0.05) in plant height, LAI, and CC between any of the treatments in all the growth stages because soil moisture might have been adequate for the plant growth. This similarity was evident by observing the various maize plots during the experiment, especially in the early growth stages. These results are in agreement with those of Djaman et al. (2013). The biomass in the late growth stages was markedly affected by irrigation regimes under our experimental conditions. Khaksar et al. (2013) reported that under severe water stress - which seems to be 60% FI for our experiment - stomata are closed, inducing a decrease in carbon dioxide uptake, and subsequently this leads to a reduction in photosynthesis. During the experiment, the plants under 60% FI reacted to the severe water stress by wrapping their leaves in the daytime at the beginning of the stress (Fig. 8). This result is in line with the findings of Worou and Saragoni (1988) who assessed maize yield response to water stress in the long dry season in southern Togo. It should be stressed that these authors did not use the same maize variety as in our experiment.
Crop yields are strictly linked to moisture availability, especially at crucial crop growth stages (Mutiro et al., 2006). These crucial growth stages for maize crop correspond to tasselling and silking (VT and R1) (Farré and Faci, 2009), which fell under the mid-season stage during our experiment for all treatments. Under deficit irrigation treatments, the plants reached tasselling-silking stages while experiencing water stress, resulting in differences in the grain yield compared to the fully irrigated plants. These differences in the grain yield were significant between 60% FI and fully irrigated plants because the water stress under the former was more pronounced. Our results are in agreement with those reported by Djaman et al. (2013) and Earl and Davis (2003). On average, the maize grain yields obtained under all the treatments are relatively low compared to the attainable potential yield reported in the literature: 3 500-5 000 kg/ha (Didjeira et al., 2007).
Nevertheless, the yields obtained at the end of our experiment for all treatments, 2 200.4 kg/ha (FI), 1 830.9 kg/ha (80% FI) and 1 068.3 kg/ha (60% FI), are greater than that of Worou and Saragoni (1988) which were 1 800 kg/ha, 900 kg/ha, and 300 kg/ha for no water stress, moderate water stress and severe water stress treatments, respectively. The Togolese Direction of Agricultural Statistics, Informatics, and Documentation, DSID (2017) reported 1 200 kg/ha as the long-term (2000-2016) average maize grain yield obtained by farmers under rainfed conditions in northern Togo. Similarly, the Global Yield Gap Atlas, GYGA (2015) reported 1 700 kg/ha, 1 800 kg/ha, 1 600 kg/ha, and 1 000 kg/ha as long-term average maize grain yields achieved by farmers under rainfed conditions in Ghana, Mali, Nigeria, and Niger, respectively. The reasons for obtaining a low level of maize yield during our experiment are threefold. Firstly, TZEE-W, the maize variety used for our experiment, is a local one. It is a short-cycle variety with a low level of yield potentials. Secondly, the plants during our experiment might have been subject to high temperature stress because TZEE-W is a rainy season variety - dry season temperatures are higher than that of the rainy season. By field observation during the experiment, it can be concluded that temperature stress was more pronounced in late vegetative growth stages (V15 and VT) and early reproductive stages (R1-R3). This finding was supported by the outputs of the simulation of the field experiment using AquaCrop. Lastly, fall armyworm (Spodoptera frugiperda), an insect pest, posed a serious threat to the plants' development during our experiment. This damage might have affected the maize grain yield measured at the end of our experiment. Fall armyworm prefers maize to other crops such as sorghum, rice, millet, and soybean. Since fall armyworm is a recently introduced pest in sub-Saharan Africa (January 2016) (Nagoshi et al., 2017), proper control methods are limited. This insect pest has the potential to cause tremendous maize yield losses if proper care is not taken (FAO, 2018).
Regarding WUE, 80% FI was similar to the FI because it appears that the plants under the 80% FI received an optimal volume of irrigation water in the crucial growth stages. Thus, deficit irrigation may be used to boost WUE. Such results are expected because plants under FI are provided with more than the required volume of water for their growth. These results are corroborated by those of Pandey et al. (2000a) who assessed the effects of deficit irrigation on maize in a Sahelian environment. The rate of infiltration, which is subject to the rate of water supply, controls how much water reaches the root zone and how much exits the field as runoff (Hillel, 1982). Since the soils have been ploughed to up to 0.15-0.25 m depth each annual season for a long time in northern Togo, they are compacted below 0.35 m depth. Therefore, maize plants tend to develop a more horizontal rooting system than a vertical one. During our experiment, on all the plots, the maximum rooting depths reached by the plants were less than 0.50 m. Also, the topsoils are poor in terms of organic matter content. In northern Togo, it appears that conservation agriculture is required to improve plant root penetration and infiltration capacity. In the area, some farmers have started using cover plants (Bracharia brizantha and Crotalaria spectabilis) in association with cereal crops or between two growing seasons to loosen the soil. It is also worth highlighting the importance of irrigation (full and deficit) for improving maize yield in West Africa using a crop modelling approach (Abdalhi and Jia, 2018).
CONCLUSIONS
A field experiment was carried out to assess the effect of full and limited irrigation management practices on maize biomass, LAI, CC, plant height and grain yield during the dry season (November 2017 to April 2018) in northern Togo, West Africa. The results of our study indicate clearly that the biomass - including grain and stover at physiological maturity - and grain yield were significantly (p < 0.05) affected by the irrigation regimes. Concerning crop response to water performance, the 80% FI was very comparable to the fully irrigated treatment. WUE for 80% FI was similar to that of FI for the field experiment as well as its simulation using AquaCrop model. Deficit irrigation during early vegetative growth stage modestly reduced the biomass, LAI, CC, plant height, and grain yield. In contrast, deficit irrigation during the mid-season stage (tasselling and silking) lessens the biomass severely at physiological maturity and final grain yield. Reductions in the plant density may result in a decline in the biomass and grain yield, while no change was observed in WUE. Optimisation of the irrigation regimes could contribute to improving the grain yield and the WUE and, at the same time, save water.
This study demonstrated that lowering irrigation during the early vegetative growth stage had less impact on biomass production than when deficit irrigation occurred during the mid-season (reproductive) stage. These reductions are a direct effect of diminished LAI. The adaptive strategy of maize under a moderate level of deficit irrigation appears to reduce the biomass and the grain yield while WUE could remain similar to that of FI in these experimental, soil and crop management, and climatic conditions. Dry season maize cultivation is a delicate practice. Its realisation is subject to water availability in the soil, especially during crucial crop growth stages. Furthermore, the framework used to simulate the irrigation schedules can be extended by adding a soil variability dimension to it. The assessment can also be made more comprehensive by taking into account farmers' socioeconomic characteristics.
When interpreting the results of this study, one should bear in mind that the results presented are based on data collected during one growing season. The approach employed in this study consisted of simulating the irrigation schedules with a calibrated crop model and then implementing them in the field. However, this study gives substantial insights into maize crop response to irrigation regimes because, to date, no work has been published on similar topics in northern Togo. Thus, there is room for conducting further studies on the same topic in the area by repeating the experiment to capture more variabilities in the measured crop growth parameters and also by testing further dry-season adapted crops and crop varieties.
ACKNOWLEDGEMENTS
This study was supported by a grant to A Gadédjisso-Tossou. PhD scholarship under the Merit Scholarship Programme (MSP) 2015/2016 of the Islamic Development Bank (IsDB). Also, this study was partially funded by the United Nations University Institute for Integrated Management of Material Fluxes and Resources (UNU-FLORES) and Technische Universität Dresden (TUD), Germany. The logistical assistance received from the UNU-FLORES, ITRA, and TUD is gratefully acknowledged.
REFERENCES
ABDALHI MAM and JIA Z (2018) Crop yield and water saving potential for AquaCrop model under full and deficit irrigation managements. Ital. J. Agron. 13 (4) 267-278. https://doi.org/10.4081/ija.2018.1288 [ Links ]
ABDULMUMIN S and MISARI SM (1990) Crop coefficients of some major crops of the Nigerian semi-arid tropics. Agric. Water Manage. 18 (2) 159-171. https://doi.org/10.1016/0378-3774(90)90028-W [ Links ]
AHMADI SH, MOSALLAEEPOUR E, KAMGAR-HAGHIGHI AA and SEPASKHAH AR (2015) Modeling maize yield and soil water content with AquaCrop under full and deficit irrigation managements. Water Resour. Manage. 29 (8) 2837-2853. https://doi.org/10.1007/s11269-015-0973-3 [ Links ]
ALLEN RG, PEREIRA LS, RAES D and SMITH M (1998) Crop evapotranspiration : guidelines for computing crop water requirements-FAO Irrigation and Drainage Paper 56. Food and Agriculture Organization of the United Nations, Rome, Italy. 293 pp. [ Links ]
DIDJEIRA A, ADOURAHIM AA and SEDZRO K (2007) Situation de référence sur les principales céréales cultivées au Togo: Maïs, Riz, Sorgho, Mil. ITRA, Lomé, Togo. [ Links ]
DIN 19682-7 (1997) Bodenuntersuchungsverfahren im Landwirtschaftlichen Wasserbau - Felduntersuchungen - Teil 7: Bestimmung der Infiltrationsrate mit dem Doppelzylinder-Infiltrometer. URL: https://www.beuth.de/de/norm/din-19682-7/2932102 (Accessed 20 July 2017). [ Links ]
DIRECTION DES STATISTIQUES AGRICOLES DE L'INFORMATIQUE ET DE LA DOCUMENTATION (DSID) (2017) Filière vivrière Niveau Region: Rendement Maïs, Savanes au Togo. URL: http://togo.opendataforafrica.org/aevgmb/filière-vivrière-niveau-region (Accessed 31 August 2018). [ Links ]
DJAMAN K, IRMAK S, RATHJE WR, MARTIN DL and EISENHAUER DE (2013) Maize evapotranspiration, yield production functions, biomass, grain yield, harvest index, and yield response factors under full and limited irrigation. Am. Soc. Agric. Biol. Eng. 56 (2) 273-293. https://doi.org/10.13031/2013.42676 [ Links ]
EARL JH and DAVIS R (2003) Effect of drought stress on leaf and whole canopy radiation use efficiency and yield of maize. Agron. J. 95 (3) 688-696. https://doi.org/10.2134/agronj2003.0688 [ Links ]
FAO (2018) Integrated Management of the Fall Armyworm on Maize. A Guide for Farmer Field Schools in Africa. Food and Agriculture Organization of the United Nations, Rome. 127 pp. [ Links ]
FARRÉ I and FACI JM (2006) Comparative response of maize (Zea mays L.) and sorghum (Sorghum bicolor L. Moench) to deficit irrigation in a Mediterranean environment. Agric. Water Manage. 83 (1-2) 135-143. https://doi.org/10.1016/j.agwat.2005.11.001 [ Links ]
FARRÉ I and FACI JM (2009) Deficit irrigation in maize for reducing agricultural water use in a Mediterranean environment. Agric. Water Manage. 96 (3) 383-394. https://doi.org/10.1016/j.agwat.2008.07.002 [ Links ]
GADÉDJISSO-TOSSOU A, AVELLÁN T and SCHÜTZE N (2018) Potential of deficit and supplemental irrigation under climate variability in Northern Togo, West Africa. Water 10 (12) 1803. https://doi.org/10.3390/w10121803 [ Links ]
GLOBAL YIELD GAP ATLAS (GYGA ) (2015) Global yield gap atlas for Sub-Saharan African countries. URL: http://www.yieldgap.org/web/guest/sub-saharan-africa (Accessed 31 August 2018). [ Links ]
HILLEL D (1982) Introduction to Soil Physics. Academic Press Inc., New York. 364 pp. https://doi.org/10.1016/B978-0-08-091869-3.50005-6 [ Links ]
HOWELL TA, YAZAR A, SCHNEIDER AD, DUSEK DA and COPELAND KS (1995) Yield and water use efficiency of corn in response to LEPA irrigation. Trans. ASAE 38 (6) 1737-1747. https://doi.org/10.13031/2013.28001 [ Links ]
HSIAO TC, HENG L, STEDUTO P, ROJAS-LARA B, RAES D and FERERES E (2009) Aquacrop - The FAO crop model to simulate yield response to water: III. Parameterization and testing for maize. Agron. J. 101 (3) 448-459. https://doi.org/10.2134/agronj2008.0218s [ Links ]
ISO (International Organization for Standard) (2009) ISO 11277:2009. Soil quality, Determination of particle size distribution in mineral soil material, Method by sieving and sedimentation. URL: https://www.iso.org/standard/54151.html (Accessed 11 July 2018). [ Links ]
IUSS WORKING GROUP WRB (2015) World Reference Base for Soil Resources 2014, update 2015 International soil classification system for naming soils and creating legends for soil maps. FAO, Rome. URL: http://www.fao.org/3/i3794en/I3794en.pdf [ Links ]
KEARNEY J (2010) Food consumption trends and drivers. Phil. Trans. R. Soc. Lond. Series B Biol. Sci. 365 (1554) 2793-807. https://doi.org/10.1098/rstb.2010.0149 [ Links ]
KHAKSAR AM, NADERI A, BAND AA and LAK S (2013) Assessment of water use efficiency in related to yield and yield components of corn in deficit irrigation condition. Scholars Research Library Ann. Biol. Res. 4 (5) 262-268. [ Links ]
KOTIR JH (2011) Climate change and variability in Sub-Saharan Africa: A review of current and future trends and impacts on agriculture and food security. Environ. Dev. Sustainability 13 (3) 587-605. https://doi.org/10.1007/s10668-010-9278-0 [ Links ]
KOTTEK M, GRIESER J, BECK C, RUDOLF B and RUBEL F (2006) World map of the Köppen-Geiger climate classification updated. Meteorol. Z. 15 (3) 259-263. https://doi.org/10.1127/0941-2948/2006/0130 [ Links ]
LINIGER H., MEKDASCHI STUDER R, HAUERT C and GURTNER M (2011) Sustainable Land Management in Practice: Guidelines and Best Practices for Sub-Saharan Africa. TerrAfrica, World Overview of Conservation Approaches and Technologies (WOCAT) and Food and Agriculture Organization of the United Nations (FAO). 243 pp. [ Links ]
LIZASO J, BATCHELOR W and WESTGATE M (2003) A leaf area model to simulate cultivar-specific expansion and senescence of maize leaves. Field Crops Res. 80 1-17. https://doi.org/10.1016/S0378-4290(02)00151-X [ Links ]
LOBELL DB and GOURDJI SM (2012) The influence of climate change on global crop productivity. Plant Physiol. 160 (4) 1686-1697. https://doi.org/10.1104/pp.112.208298 [ Links ]
MATHE EA, ADOURAHIM AA and TSATSU KD (2008) Gestion améliorée de la fertilité des sols. Collection Brochures et Fiches Techniques. ITRA: Lomé, Togo. [ Links ]
MUTIRO J, MAKURIRA H and MUL ML (2006) Water productivity analysis for smallholder rainfed systems: A case study of Makanya catchment, Tanzania. Phys. Chem. Earth, Parts A/B/C 31 (15-16) 901-909. https://doi.org/10.1016/j.pce.2006.08.019 [ Links ]
NAGOSHI RN, KOFFI D, AGBOKA K, TOUNOU KA, BANERJEE R, JURAT-FUENTES JL and MEAGHER RL (2017) Comparative molecular analyses of invasive fall armyworm in Togo reveal strong similarities to populations from the eastern United States and the Greater Antilles. PLOS ONE 12 (7) e0181982. https://doi.org/10.1371/journal.pone.0181982 [ Links ]
PANDEY R, MARANVILLE J and CHETIMA M (2000a) Deficit irrigation and nitrogen effects on maize in a Sahelian environment: II. Shoot growth, nitrogen uptake and water extraction. Agric. Water Manage. 46 (1) 15-27. https://doi.org/10.1016/S0378-3774(00)00074-3 [ Links ]
PANDEY RK, HERRERA WAT and PENDLETON JW (1984) Drought response of grain legumes under irrigation gradient: I. Yield and yield components. Agron. J. 76 (4) 549-553. https://doi.org/10.2134/agronj1984.00021962007600040009x [ Links ]
PANDEY RK, MARANVILLE JW and ADMOU A (2000b) Deficit irrigation and nitrogen effects on maize in a Sahelian environment: I. Grain yield and yield components. Agric. Water Manage. 46 (1) 1-13. https://doi.org/10.1016/S0378-3774(00)00073-1 [ Links ]
ROSEGRANT MW (2016) Challenges and policies for global water and food security. URL: https://www.kansascityfed.org/~/media/files/publicat/econrev/econrevarchive/2016/si16rosegrant.pdf (Accessed 19 June 2019). [ Links ]
SAS INSTITUTE INC (2015) SAS/IML® 14.1 User's Guide. Cary, SAS Institute Inc, New York. 1154 pp. [ Links ]
SCHÜTZE N, DE PALY M and SHAMIR U (2012) Novel simulation-based algorithms for optimal open-loop and closed-loop scheduling of deficit irrigation systems. J. Hydroinf. 14 (1) 136-151. https://doi.org/10.2166/hydro.2011.073 [ Links ]
SCHÜTZE N and SCHMITZ GH (2010) OCCASION: New planning tool for optimal climate change adaption strategies in irrigation. J. Irrig. Drain. Eng. 136 (12) 836-846. https://doi.org/10.1061/(ASCE)IR.1943-4774.0000266 [ Links ]
SEMENOV MA, BROOKS RJ, BARROW EM and RICHARDSON CW (1998) Comparison of the WGEN and LARS-WG stochastic weather generators for diverse climates. Clim. Res. 10 (2) 95-107. https://doi.org/10.3354/cr010095 [ Links ]
SHAPIRO SS and WILK MB (1965) An analysis of variance test for normality (complete samples). Biometrika 52 591-611. https://doi.org/10.1093/biomet/52.3-4.591 [ Links ]
UN DESA (2015) Integrating population issues into sustainable development. URL: https://www.un.org/en/development/desa/population/commission/pdf/48/CPD48ConciseReport.pdf (Accessed 19 June 2019). [ Links ]
UN DESA (United Nations Department of Economic and Social Affairs) (2017) World population prospects: The 2017 revision, key findings and advance tables. ESA/P/WP/248. New York. URL: https://esa.un.org/unpd/wpp/Publications/Files/WPP2017_KeyFindings.pdf [ Links ]
USDA (United States Department Of Agriculture) (1987) Soil Mechanics Level 1 Module 3 USDA Soil Textural Classification Study Guide. USDA Soil Conservation Service, Washington DC. [ Links ]
VAN ITTERSUM MK, VAN BUSSEL LGJ, WOLF J, GRASSINI P, VAN WART J, GUILPART N, CLAESSENS L, DE GROOT H, WIEBE K, MASON-D'CROZ D, and co-authors (2016) Can sub-Saharan Africa feed itself? Proc. Natl Acad. Sci. U.S.A.ca 113 (52) 14964-14969. https://doi.org/10.1073/pnas.1610359113 [ Links ]
WALKLEY A and BLACK IA (1934) An examination of the degtjareff method for determining soil organic matter, and a proposed modification of the chromic acid titration method. Soil Sci. 37 (1) 29-38. https://doi.org/10.1097/00010694-193401000-00003 [ Links ]
WOROU S and SARAGONI H (1988) La culture du maïs de contre saison est-elle possible au Togo meridional? Premières conclusions d'une experimentation sur la station de recherche agronomique d'ativémé. Institut français de recherche scientifique pour le développement en coopération (ORSTOM): Lomé, Togo. [ Links ]
YI L, SHENJIAO Y, SHIQING L, XINPING C and FANG C (2010) Growth and development of maize (Zea mays L.) in response to different field water management practices: Resource capture and use efficiency. Agric. For. Meteorol. 150 (4) 606-613. https://doi.org/10.1016/j.agrformet.2010.02.003 [ Links ]
 Correspondence:
Agossou Gadédjisso-Tossou
tossou@unu.edu
Received: 28 January 2019
Accepted: 13 November 2019

