


Services on Demand
Article
 English (pdf)
 Article in xml format
 Article references
Indicators

Related links
-
 Cited by Google
 -
 Similars in Google
Share

 Permalink
Water SA
On-line version ISSN 1816-7950
Print version ISSN 0378-4738
Water SA vol.46 n.1 Pretoria Jan. 2020
http://dx.doi.org/10.17159/wsa/2020.v46.i1.7888
RESEARCH PAPERS
Occurrence of PAHs in water samples of the Diep River, South Africa
Adetunji A AweI; Beatrice O OpeoluII; Olatunde S OlatunjiIII; Olalekan S FatokiIV; Vanessa A JacksonV; Reinette G SnymanVI
IDepartment of Chemistry, Cape Peninsula University of Technology, Cape Town, South Africa
IIDepartment of Environmental and Occupational Studies, Cape Peninsula University of Technology, Cape Town, South Africa
IIISchool of Chemistry and Physics, University of KwaZulu-Natal, Durban, South Africa
IVFaculty of Applied Sciences, Cape Peninsula University of Technology, Cape Town, South Africa
VDepartment of Biotechnology and Consumer Science, Cape Peninsula University of Technology, Cape Town, South Africa
VIDepartment of Conservation and Marine Sciences, Cape Peninsula University of Technology, Cape Town, South Africa
ABSTRACT
Occurrence of polycyclic aromatic hydrocarbons (PAHs) in freshwater may aggravate the water crisis currently being experienced in the Western Cape Province of South Africa. However, there is dearth of data on the levels of PAHs, which is necessary for effective assessment of water quality as well as remediation strategies. This study therefore assessed levels of PAHs in the Diep River freshwater system of Western Cape Province, South Africa. A liquid-liquid extraction solid-phase extraction gas chromatography flame ionisation detection (LLE-SPEGC- FID) method was developed to simultaneously determine the 16 United States Environmental Protection Agency (USEPA) listed priority PAHs in water samples. The SPE-GC-FID method allowed an acceptable linearity (R2 > 0.999) within the calibration range of 1 to 50 μg/mL. Instrument detection limits ranged between 0.02 and 0.04 μg/mL and instrument quantification limits between 0.06 and 0.13 μg/mL. Recovery study results were also acceptable (83.69-96.44%) except for naphthalene, which had recovery of 60.05% in spiked water matrix. The seasonal averages of individual PAH detected at the studied sites ranged between not detected (nd) and 72.38 ± 9.58 μg/L in water samples.
Keywords: PAHs, Diep River, GC-FID, freshwater
INTRODUCTION
Contamination of water limits the availability of this important resource, with an attendant possibility of causing human and wildlife health problems, reduced biodiversity, environmental degradation, hunger and poverty, amongst others. Among the list of prioritised emerging micro-contaminants that have been identified to degrade water quality is the polycyclic aromatic hydrocarbons (PAHs) group (Christensen and Arora, 2007).
The global widespread contamination of the environment, including inland streams, rivers and marine environments, and in South Africa especially, by PAHs has been reported severally (Shi et al., 2005; Degger et al., 2011; Zeng et al., 2013; Karaca and Tasdemir, 2014). The concentrations of different PAH fractions and the sum total of PAHs detected in different aquatic environment varies. In the study of Nekhavhambe et al. (2014), for example, the individual PAH levels detected in river water samples ranged between 0.1 µg/L and 137 µg/L (anthracene fraction being the dominant PAH); varied concentrations of PAHs have also been measured elsewhere in the world (Zhang et al., 2004; Chen et al., 2007; Li et al., 2012; Adeniji et al., 2019).
Data on contaminants are crucial in identifying pollution sources, mapping out clean-up strategies, meeting environmental management and policy objectives as well as formulating policy and guidelines for freshwater ecosystems. Reports from most studies have further stressed the fact that there is a paucity of data on PAH occurrence in many of Africa's environments and that there is a need to generate more data on PAHs in aquatic ecosystems in order to achieve a logical and reliable characterisation of these compounds. The United States Environmental Protection Agency (US EPA) listed 16 PAHs as priority pollutants in wastewaters and 24 in soils, sediments, hazardous solid waste and groundwater, based on their potential health hazards to animals and humans (Christensen and Bzdusek, 2005; US EPA, 2014). PAHs have been shown to be carcinogenic, mutagenic and teratogenic (Yamada et al., 2003).
This study therefore measured the levels of the 16 priority US EPA PAHs in water samples from the Diep River, South Africa. Spatial and seasonal variations of the compounds were also monitored.
METHOD OF ANALYSIS
Chemicals
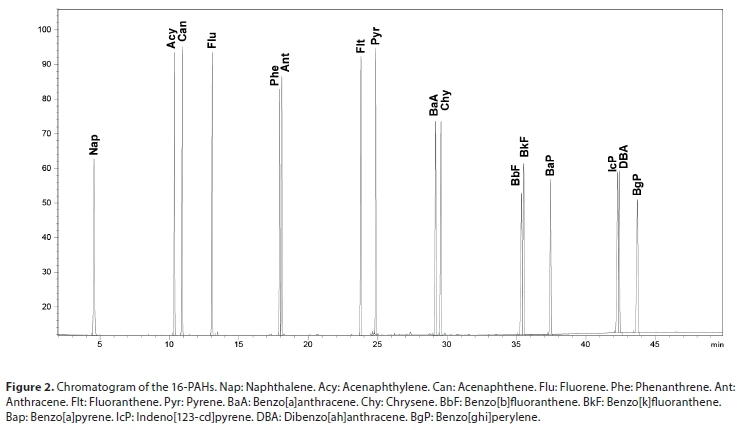
The 16 PAHs, naphthalene (Nap), acenaphthylene (Acy), acenaphthene (Can), fluorene (Flu), phenanthrene (Phe), anthracene (Ant), fluoranthene (Flt), pyrene (Pyr), benzo[a]anthracene (BaA), chrysene (Chy), benzo[b]fluoranthene (BbF), benzo[k]fluoranthene (BkF), benzo[a]pyrene (BaP), dibenzo[ah]anthracene (DBA), benzo[ghi]perylene (BgP) and indeno[123-cd]pyrene (IcP), standards were purchased from Supelco, Bellefonte, PA, USA. Dichloromethane (DCM), n-hexane, other solvents and chemicals were obtained from Sigma-Aldrich (South Africa).
Method development on GC-FID
A SPE-GC-FID method was developed for the simultaneous recovery and determination of the 16 PAHs, while a GC coupled to FID was optimised for the separation of the PAH extracts, and quantitation of each of the separated fractions.
Standards and calibration solutions
Stock solutions (1 000 µg/mL) of the 16 PAHs were prepared by dissolving 0.01 g of each PAH in dichloromethane (DCM) in 10 mL standard flask. A working mixture (cocktail), containing the 16-PAHs mix at 1 000 µg/mL was also prepared. The stock solutions were subsequently transferred into amber vials and kept refrigerated at 4°C until use. The calibration standards (1 µg/mL, 2 µg/mL, 5 µg/mL, 10 µg/mL and 50 µg/mL) were serially prepared from the stock solution by successive dilution with appropriate volume of dichloromethane and stored at 4°C prior to GC-FID analysis.
GC-FID instrumentation and analytical conditions
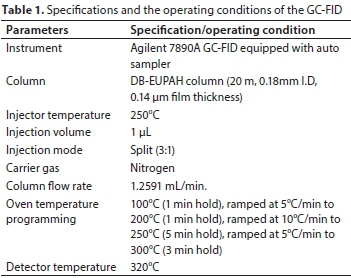
Chromatographic analysis was performed on Agilent 7890A GC-FID system equipped with an auto- sampler and Agilent Chemstation software. An Agilent DB-EUPAH column (20 m × 0.18mm I.D) with 0.14 µm film thickness was utilised for the separation. The GC-FID parameters (injector temperature, injection type (split/splitless), oven temperature programme, carrier gas flow and detector temperature) were optimised for the simultaneous detection and quantification of the 16 PAHs in a cocktail. Nitrogen gas was used as carrier gas at a constant flow of about 1.26 mL/min. Split injection (3:1) was used with injection volume of 1 µL. Hydrogen (32 mL/min), air (380 mL/min) and nitrogen (auxiliary gas; 28 mL/min) were the gases used for the flame ionisation detector. A summary of the GC-FID operating parameters utilised is presented in Table 1.
Analyte identification and calibration
The GC-FID conditions were optimised for the detection of 16 PAHs in a cocktail, whereby several cocktail injections of the 16 PAHs were done and parameters adjusted until good resolution of separation was obtained, after which about 1 µL of 2 µg/mL each of the standard solutions of the 16 PAHs were individually injected online the GC-FID to determine the average retention time of each, as well as to identify each analyte. The injection was performed 10 times for each standard solution.
The identified average retention time for each analyte was subsequently used to set up a calibration method with the Chemstation software on the GC-FID with the calibration standards (1 µg/mL, 2 µg/mL, 5 µg/mL, 10 µg/mL and 50 µg/mL).
Extraction and SPE clean-up of PAHs
A solid phase extraction (SPE) method was developed for the recovery of the 16 PAHs. The clean-up of PAHs was carried out with C18 solid phase extraction tubes (Supelclean ENVI -18 SPE tubes 6mL), purchased from Supelco, Bellefonte, USA.
The extraction of PAHs was carried out with n-hexane in 5 extraction sequences (25, 20, 15, 10 and 10 mL) and utilised 250 mL of Milli-Q water as matrix for the recovery procedure. Clean-up was done on SPE tubes that have been pre-conditioned with n-hexane and DCM (3 mL each of DCM, n-hexane and DCM/hexane (1:1) sequentially).
The extraction was carried out by measuring a 250-mL water sample into a pre-cleaned 500-mL separating funnel, followed by the addition of the required volume of the extracting solvent. The content of the funnel was thoroughly mixed for 1 min and allowed to stand for 2 h to allow for phase separation between the organic phase and the polar phase. The organic phase was then carefully collected, by letting out the polar phase from the funnel. The combined organic phase from 5 extractions was then cleaned up.
The PAH extract was cleaned-up using SPE tubes, fitted onto a vacuum manifold with the vacuum regulated to give a flow rate of 4-5 mL/min. About 1 g Na2SO4 was spread over each SPE column to remove water residue in extracts. Extracts were then loaded on the n-hexane and DCM preconditioned SPE tubes and eluted. This was followed by column wash to release trapped analyte residue, by rinsing the solid phase column in 3 cycles with 3 mL DCM. The resulting eluents were concentrated to less than 1 mL in a rotary evaporator at 100 r/min and water bath temperature of 30°C. The extract concentrates were reconstituted to 1 mL using DCM and transferred into 1 mL amber vials for GC-FID analysis separation and quantitation.
The extraction methods described above are based on the methods described by Manoli and Samara (1999) Zhou et al. (2000) and Chen et al. (2007).
Method validation
The optimised analytical method for the separation and quantitation of the 16 PAHs was validated for the established International Conference on Harmonisation (ICH) parameters such as; linearity range, detection limit, quantification limit, precision, accuracy and recovery (ICH, 2005).
Linearity, detection limit and quantification limit
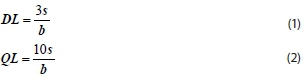
The linearity of method response to analyte's quantitation was obtained from the plot of peak areas against the concentrations of working calibration standards of analytes using the Chemstation software, while the detection limits (DL) and quantification limits (QL) were obtained from the standard deviation of the analyte's blank (s) and slope of the calibration curve (b) using the formulae below:
Precision
The precision of the GC-FID for simultaneous analysis of the 16 PAHs in DCM was evaluated from the relative standard deviation (RSD) of repeatability (within-run precision) and reproducibility (between-run precision) data, obtained from 6 runs. The repeatability was evaluated in 1 day, while reproducibility was evaluated over 6 days.
Accuracy
The accuracy of the method was evaluated by recovery of analytes from spiked Milli-Q water, which was carried out in triplicate. Analytes from spiked matrices were extracted and cleaned up as described above, while the unspiked matrix was utilised as blank. Analytes recovered from the spiked matrix were analysed through external standard calibration method as described by Zakeri-Milani et al. (2005) to validate the method.
Procedural blanks were run concurrently with field water samples during the analyses.
Study area: Diep River
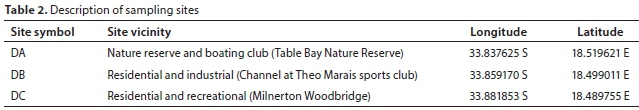
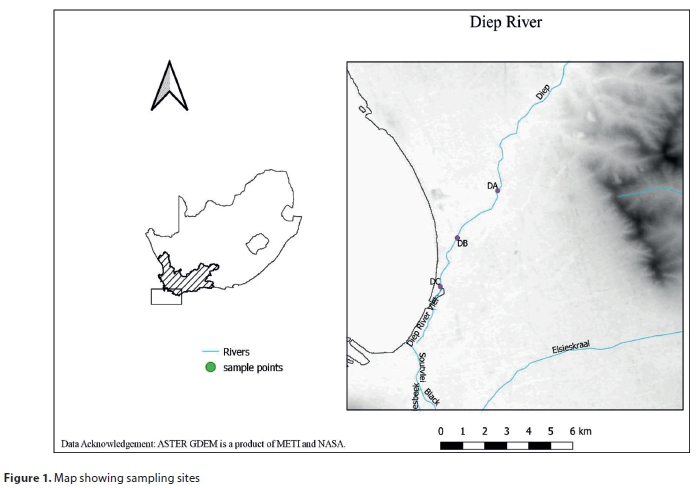
Studies have shown that the Diep River, an important freshwater ecosystem (utilised for irrigation and recreation) in the Western Cape, South Africa, has been impacted as a result of anthropogenic activities (Jackson et al., 2009; Shuping et al., 2011; Daso et al., 2016). Wastewater effluents from residential and industrial areas have been reported as major point sources of contaminants into the Diep River (Paulse et al. 2009). Water samples were therefore collected in order to investigate the level of anthropogenic source inputs of the 16 PAHs into this freshwater ecosystem. Description of the three sampling sites (DA, DB and DC) in the Diep River is presented in Table 2 and Fig. 1.
Sampling and sample pre-treatment
Surface water samples were collected from selected sites (DA, DB and DC) for this study. The choice of sampling bottles, sample preservation method, holding time and analytical method were carried out based on established procedures described by Hildebrandt et al. (2006). All sampling tools were washed with phosphate-free detergent and rinsed with tap water. The tools were subsequently soaked in 0.1 M HNO3 for 24 h, rinsed in Milli-Q water and again soaked in acetone for 30 min, rinsed with DCM and dried. Amber bottles with Teflon-lined lids were utilised for water sampling.
Water was sampled in triplicate and collected consistently at intervals of 30 days (once a month) over a year, from December 2015 to November 2016. The sampling regime was grouped into summer (Dec, Jan, and Feb), autumn (March, April and May), winter (June, July and August) and spring (Sept, Oct and Nov). Physicochemical parameters such as temperature, pH, total dissolved solids (TDS), salinity and conductivity of water samples were measured in situ using a PCS teslr 35 handheld multi-parameter gauge. Samples were collected in pre-cleaned 500 mL amber bottles, by carefully tilting and submerging the sampling containers below the water surface and allowing them to fill to brim. About 1 mL of 100 mg/L NaN3 was added to each water sample to inhibit bacterial growth. Samples were stored in ice-packed containers at 4°C and during transfer to the laboratory for further processing and analyses. The extraction, clean-up and GC-FID analyses were done within 24 h of sample collection. Water samples were analysed from each triplicate sample bottle, in order to normalise for possible matrix variability at each sampling site.
RESULTS AND DISCUSSION
GC-FID method optimisation and validation
Chromatographic separation
The chromatogram of the investigated 16 priority PAHs obtained from the GC-FID is presented in Fig. 2. The separation of the various component PAHs is distinct (sharp peaks), within acceptable resolution and adequate sensitivity for the detection and quantitation of the PAH analytes.
Linearity, detection limit and quantification limit
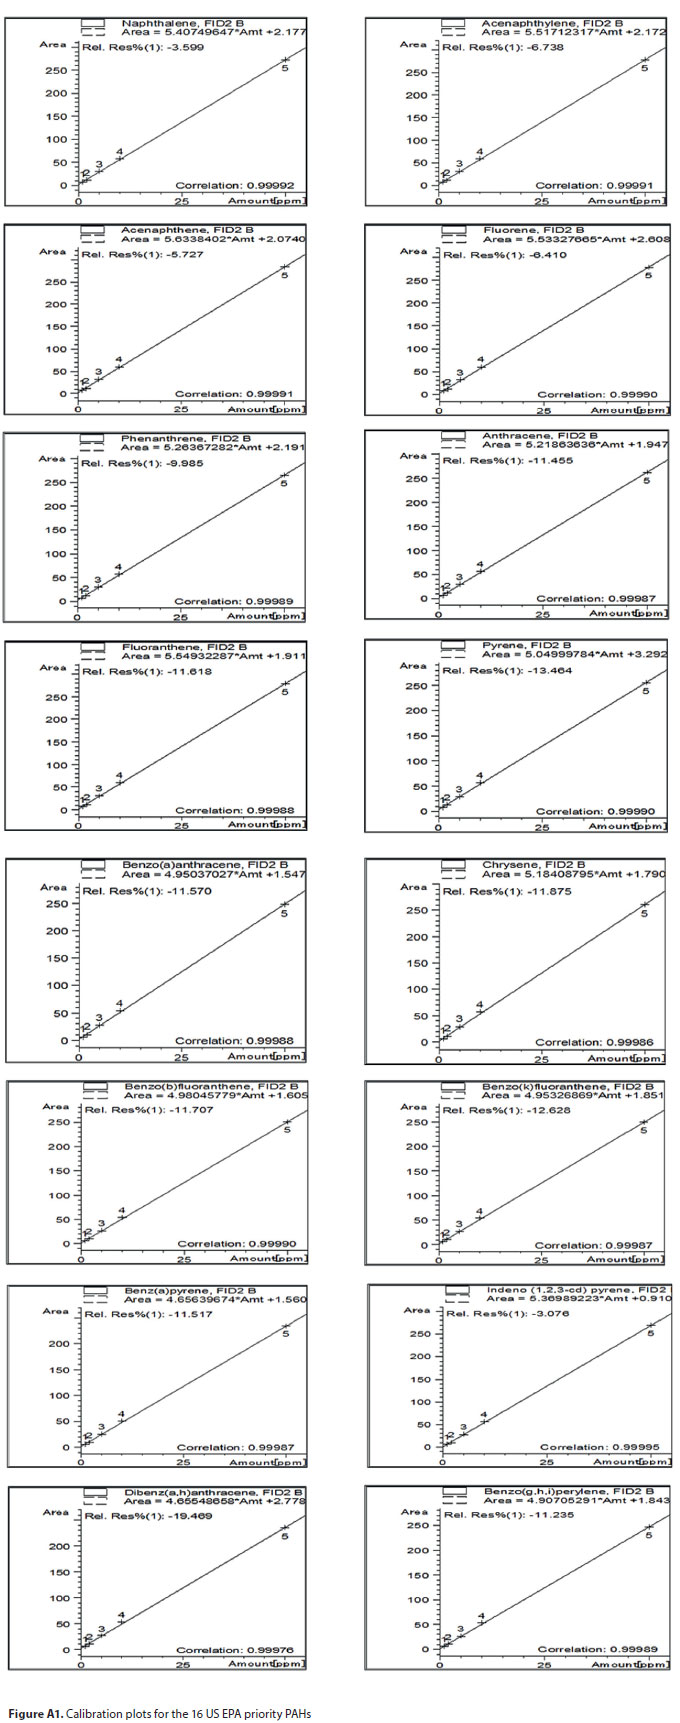
The developed method was validated according to ICH-prescribed procedures for parameter linearity, detection limits, quantification limits, precision and accuracy, etc. (ICH, 2005). The calibration range, regression plot, retention time, goodness of fit (R2), detection limit (DL) and quantification limit (QL) for each analyte are included in the Appendix (Table A1). The detector response to all the analytes in the concentration range studied was linear, with R2 values greater than 0.999 for each of the analytes. The calibration plots obtained using the instrument software are also included in the Appendix (Fig. A1). This implies that the developed method is suitable for the determination of the 16 PAHs (Opeolu et al., 2010).
The DL for the analytes ranged between 0.02 and 0.04 µg/mL, while the QL were between 0.06 and 0.13 µg/mL. Hence, the method's sensitivity was at near-zero concentration, thereby confirming the method's suitability and adequacy for the detection and quantification of trace level PAHs in environmental samples.
Precision
The repeatability and reproducibility data obtained were used for precision measurement by calculating the relative standard deviation (RSD) (see Table A2, Appendix). The %RSD for repeatability ranged between 1.15 for BbF and 2.04 for Nap while reproducibility ranged between 1.11 for Flu and 3.22 for Pyr. The precision achieved compares well with those previously utilised in chromatography analyses, with %RSD range of 0.48-5.30 and 0.22-1.33 for repeatability and reproducibility, respectively, as reported by Zakeri-Milani et al. (2005); Wei and Jen (2007); and Opeolu et al. (2010). This indicates that the method is robust.
Recovery of PAHs
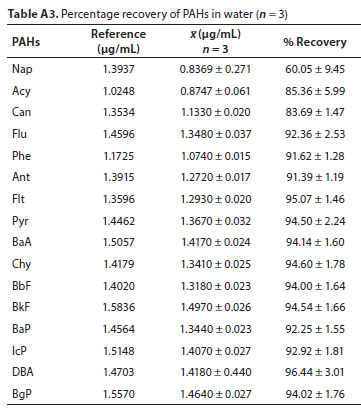
The efficiency of the SPE procedure for the concentration of the PAH analytes was inferred from average percentage recovery obtained from triplicate analysis of PAHs extracted from spiked matrices. The recovery of the 16 PAHs from the aqueous matrices is included in the Appendix (Table A3).
The lowest average percentage recovery was 60.05 ± 9.45% for Nap, while average percentage recovery for all other PAH analytes ranged between 83.69 ± 1.47% (Can) and 96.44 ± 3.01% (DBA). The high volatility of Nap, and high bias relative to other larger PAHs, was suspected to be responsible for its low recovery. A smaller recovery percentage (36.28%) was reported for Nap by Karyab et al.(2013). These recoveries were consistent and in some cases relatively higher than those reported in literature (Wei and Jen, 2007; Qiao et al., 2008; Liu et al., 2013; Ma et al., 2013). For instance, Qiao et al. (2008) reported recovery ranges of 62.1 to 106.5% for the USEPA individual PAHs in water samples. The recovery range for four surrogate PAH standards (naphthalene-d8, phenanthrene-d10, fluororene-d10 and perylene-d12) in water samples by Liu et al. (2013) was between 51.5 and 97.8%. The described methods are therefore suitable for the analysis of the 16 listed priority PAHs in water samples.
Water quality parameters of the Diep River water samples
Water is of great socio-economic and environmental importance, hence water quality assessment is imperative in order to ensure informed resource management decisions (Korkanç et al., 2017).
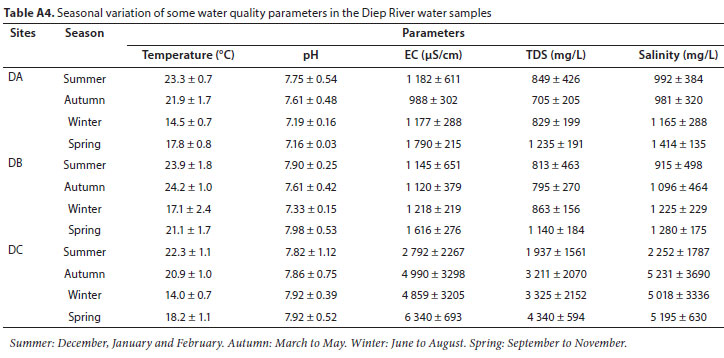
The quality of surface water depends on a combination of factors, namely; physical (temperature, pH, salinity, amongst etc.); chemical and biological characteristics (Korkanç et al., 2017). The water physical-chemical quality parameters measured in situ at the sampling sites are included in the Appendix (Table A4).
Temperature
One of the indices that defines the health and functionality of the aquatic ecosystem is temperature. Aquatic biota are particularly sensitive to temperature fluctuations, which are often occasioned by thermal pollution or climatic conditions. Changes in temperature may cause death, algal blooms and introduction of alien species in certain instances (Hester and Doyle, 2011; Wolf et al., 2014). Also, many physical and chemical water characteristics, such as solubility of oxygen and other gases, chemical reaction rate and toxicity, and microbial activities, are strongly influenced by temperature (Dallas, 2008). Hence, bioavailability and toxicity of PAHs in the aquatic environment may be influenced by temperature profiles of water bodies.
Temperature measurement at different study sites on Diep River ranged from 22.3±1.1-23.9±1.8°C; 20.9±1.0-24.2±1.0°C; 14.0±0.7-17.1±2.4°C; and 17.8±0.8-21.1±1.7°C during summer, autumn; winter, and spring, respectively (see Table A4, Appendix). Average temperature of water during the different seasons ranged between 14.0°C and 24.2°C. Temperatures were generally highest in summer and lowest in winter. Water temperatures at Site DB (17.1-24.2°C) were generally higher than at other sites. This may be due to its proximal location to a refinery, thus suggesting anthropogenic impact. The observed water temperature were however below the 25°C acceptable limit for no risk, recommended in the South African water quality guidelines for aquatic ecosystems (Department of Water Affairs and Forestry (DWAF), 1996a).
pH
The pH of surface water influences the availability of nutrients and toxins to plants and animals (Sallam and Elsayed, 2018). Metal contaminants, for instance, are more bioavailable to plants at pH5.5-6.5. The pH of natural waters may be influenced by temperature-dependent complex acid-base balances of dissolved compounds, and the carbon dioxide-bicarbonate-carbonate equilibrium system (DWAF, 1996b). Also, parameters such as carbon dioxide, alkalinity and hardness may facilitate acidification or alkalinisation of natural water through conditions that favour H+/OH- production (lower/higher pH), and/or neutralisation of H+/OH- equilibrium (Wurts and Durborow, 1992).
The average water pH values recorded at the selected sites on the Diep River ranged from 7.16 to 7.98 (Table A4). This pH range fell within the 6-9 recommended level, set by the Department of Water and Sanitation of South Africa for domestic, recreational and agricultural water use (DWAF, 1996b), and the optimum levels of 6.5 to 9.5 set by the World Health Organisation for water meant for recreational activities (WHO, 2006). The hydrolysis of released organic contaminants coupled with rivers' natural pH buffering mechanism could be responsible for pH values of over 7.50 recorded in most instances in the Diep River. High pH levels of up to 9.02, attributed to the hydrolysis of organic-derived wastes, were previously reported in surface water samples from Msunduzi River (South Africa) (Munyengabe et al., 2017). Azizi et al. (2018) reported average pH value of 8.4, across the four seasons of summer (8.27), autumn (8.35), winter (8.27) and spring (8.71) in water samples from Cala Iris in Northern Morocco. Wang et al. (2018) reported mean pH values in autumn (8.30) and winter (8.26) that were higher than those in spring (8.21) and summer (8.10) in water samples from the Yellow River Estuary, China.
Seasonal random flunctuation in pH was observed in this study. Catchment activities and sundry environmental effects may therefore be responsible for variations in pH values recorded.
Electrical conductivity (EC)
The EC of surface waters is a function of multiple factors, including the geology of the terrain of the river course and the population of dissolved ions in water (Edokpayi et al., 2015). Anthropogenic discharges and runoff of wastewater into water resources can result in conductivity increase, thus rendering the water unsuitable for irrigation and domestic use (Korkanç et al., 2017). Seawater intrusion into rivers in coastal lines and delta regions may also lead to changes in pH, EC, and TDS regimes (Kumar et al., 2015; Sylus and Ramesh, 2015). The EC values at the selected sites ranged between 988 and 6 340 µS/cm (see Table A4, Appendix). The total seasonal average EC values obtained in spring were the highest (3 249 µS/cm). Electrical conductivity values at Site DC were above the permissible level (0 to 1 500 µS/cm) stipulated by the Department of Water and Sanitation of South Africa (DWAF, 1996b), while Sites DA and DB were below 1 500 µS/cm during all seasons except spring. Apart from wastewater runoff into the rivers, tidal waves and river flows, which are influenced by sundry and dynamic environmental conditions, possibly contributed to the high EC values recorded. These effects were more pronounced at Site DC, which can be regarded as the zone of dispersion based on its closeness to the sea, with an EC value of 2 792 in summer and 6 340 µS/cm in spring. The EC range from this study is higher than that reported by Kumar et al. (2015) (49.8 to 1 926 µS/cm) and Sylus and Ramesh (2015) (10 to 2 500 µS/cm) in coastal aquifers influenced by seawater intrusion. The measured range of EC values was, however, lower than the average EC value of up to 7 186.7 µS/cm observed by Tauhid Ur Rahman et al. (2017) in their assessment of rivers, ponds and tube wells, in the coastal region of Bangladesh.
Total dissolved solids (TDS)
The TDS is a measure of various dissolved substances in water and has a direct relationship with EC. Inorganic salts are often present in natural water due to the dissolution of minerals in rocks, soils and decomposing vegetation. TDS levels in surface water may therefore be partly accounted for as a function of the geology of the water course (DWAF, 1996b). Undesirable elevation in the levels of TDS in river water could arise from salt intrusion, mining, irrigation water, oil refineries, and domestic wastewater discharges (Kent and Landon, 2013; Feng et al., 2014; Sharma et al., 2017). TDS values obtained from selected sites during different seasons are included in the Appendix (Table A4). The measured TDS range (705 to 4 340 mg/L) was higher than that observed by Kumar et al. (2015) (1.21 to 774 mg/L) and Sylus and Ramesh (2015) (25 to 1 800 mg/L). Higher TDS values were observed in winter and spring relative to summer and autumn. This observation is consistent with that of Kut et al. (2019), with a higher TDS range of 121 to 1 924 mg/L in the wet season, relative to 121 to 1 467 mg/L in the dry season. The higher wet season TDS values may be connected to stormwater input, which probably has an elevation effect.
Elevated levels of TDS have been reported to impact water with odour and colour, resulting in poor growth performance of animals and post-egg-fertilisation impairment in aquatic organisms (Brix et al., 2010; Sharma et al., 2017). Total dissolved solids are therefore an index of water quality, with permissible limits ranging from 600 to < 1 000 mg/L (Kut et al., 2019).
Salinity
Salinity measures the amount of dissolved salts (NaCl, KCl and MgCl2) in water (Hussain et al., 2017). Washing of un-adsorbed salt from irrigation water in soils into rivers can also result in high salinity (Ruiz et al. 2011). Salinity impacts physical attributes, such as density, heat capacity, temperature and pressure, of surface water bodies. Changes in salinity influence the development and growth of many aquatic organisms, as well as crop production (Bœuf and Payan, 2001). Al-Dakheel et al. (2015) reported delayed germination, high seedling mortality, poor crop stand, stunted growth and reduced yields in plants exposed to highly saline water. Hence, crop irrigation and aquaculture using high salinity water threatens food security. Reliance on irrigation for crop production and rising groundwater tables are also important causes of river salinisation (Cañedo-Argüelles et al., 2013).
The recorded seasonal salinity measured at the different study sites on the Diep River ranged from 915 to 5 231 mg/L (Table A4). Most of the observed seasonal salinity values across the studied sites of the Diep River exceeded the recommended permissible value (<1 000 mg/L) for the protection of freshwater life (Kaushal et al., 2005). Spring salinity values were generally higher relative to other seasons, in contrast with the report of Ruiz et al. (2011). The highest measured salinity range of 2 252 to 5 231 mg/L was measured in Site DC. This could be attributed to seawater intrusion, which is evident at Site DC (zone of dispersion). Higher than recommended values observed at Sites DA and DB during autumn, winter and spring may be attributed to wastewater/stormwater runoff into the aquatic system. Higher average salinity values of up to 4 236.4 mg/L, except for Site DC, were reported for waters in the coastal regions of Bangladesh (Tauhid Ur Rahman et al., 2017). Salinity intrusion was suggested to be responsible for the measured high salinity levels.
Levels of PAHs in surface water samples of the Diep River
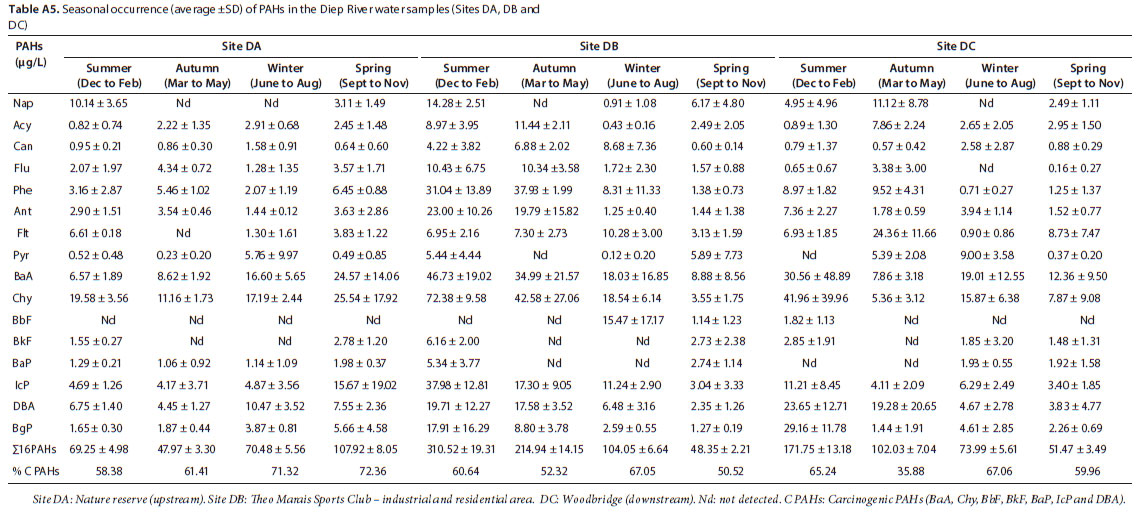
The seasonal average levels of 16 measured PAHs in surface water at the different sampling sites on the Diep River is summarised in Table A5 (see Appendix). The seasonal averages of individual PAH detected at the studied sites ranged between Nd and 72.38 µg/L. The concentration of Chy was the highest at all sampling sites and ranged from 11.16 ± 1.73-25.54 ± 17.92 µg/L, 3.55 ± 1.75-72.38 ± 9.58 µg/L, and 5.36 ± 3.12-41.96 ± 39.96 µg/L at Sites DA, DB and DC, respectively. BbF was not detected at Site DA, while it was only detected during winter and spring at Site DB, at 15.47 ± 17.17 and 1.14 ± 1.23 µg/L, respectively, and only during summer at Site DC, at 1.82 ± 1.13 µg/L. BkF also had low concentrations of 1.55 ± 0.27 µg/L and 2.78 ± 1.20 µg/L at Site DA, and 6.16 ± 2.00 µg/L and 2.73 ± 2.38 µg/L at Site DB, during summer and spring, respectively, while it was not at detectable levels during autumn and winter at both sites. BkF levels at Site DC during all seasons except autumn (nd) ranged from 1.48 ± 1.31-2.85 ± 1.91 µg/L. The concentrations of Pyr and Can were also low and ranged from 0.23 ± 0.20-5.76 ± 9.97 µg/L, Nd-5.89 ± 7.73 µg/L, Nd-9.00 ± 3.58 µg/L and 0.64 ± 0.60-1.58 ± 0.91 µg/L, 0.60 ±0.14- 8.68 ± 7.36 µg/L, 0.57 ± 0.42-2.58 ± 2.87 µg/L, respectively, at Sites DA, DB and DC. Nap (Site DA, Nd-10.14 ± 3.65 µg/L; Site DB, Nd-14.28 ± 2.51 µg/L; Site DC, Nd-11.12 ± 8.78 µg/L), Flt (Site DA, Nd-6.61 ± 0.18 µg/L; Site DB, Nd-5.89 ± 7.73 µg/L; Site DC, 0.90 ± 0.86-24.36 ± 11.66 µg/L), BaA (Site DA, 6.57 ± 1.89-24.57 ± 14.06 µg/L; Site DB, 8.88 ± 8.56-46.73 ± 19.02 µg/L; Site DC, 7.86 ± 3.18-30.56 ± 48.89 µg/L), BaP (Site DA, 1.06 ± 0.92-1.98 ± 0.37 µg/L; Site DB, Nd-5.34 ± 3.77 µg/L; Site DC, Nd-1.93 ± 0.55 µg/L), IcP (Site DA, 4.17 ± 3.71-15.67 ± 19.02 µg/L; Site DB, 3.04 ± 3.33-37.98 ± 12.81 µg/L; Site DC, 3.40 ± 1.85-11.21 ± 8.45 µg/L), DBA (Site DA, 4.45 ± 1.27-10.47 ± 3.52 µg/L; Site DB, 2.35 ± 1.26-19.71 ± 12.27 µg/L; Site DC, 3.83 ± 4.77-23.65 ± 12.71 µg/L) and BgP (Site DA, 1.65 ± 0.30-5.66 ± 14.06 µg/L; Site DB, 1.27 ± 0.19-17.91 ± 16.29 µg/L; Site DC, 1.44 ± 1.91-29.16 ± 11.78 µg/L) were also detected across all the sampling sites.
Study site DB near the refinery was the most contaminated site on the Diep River, with an annual average of 169.47 µg/L for the sum of the 16 PAHs (Σ16PAHs), followed by the downstream site (Site DC) with an average of 99.81 µg/L Σ16PAHs, while the lowest level was recorded upstream (Site DA), traversing the nature reserve with an annual average of 73.91 µg/L, Σ16PAHs (Fig. 3). This suggests that the detected levels of PAHs were site-specific, and this correlates with the nature of anthropogenic activities around the sampling sites. For instance, the highest levels of BaA (46.73 µg/L), Chy (72.38 µg/L) and IcP (37.98 µg/L) were all detected in summer at Site DB.

Although Nap, the smallest of the PAHs, is relatively volatile compared to others, it was considerably magnified, reaching 14.28 µg/L at Site DB during summer. This may be linked to high petrogenic emission of lower molecular weight PAHs with increased industrial and vehicular activities, coupled with low or no rainwater dilution during the summer months. The detected levels of Nap exceed the USEPA regulatory threshold limit of 1.10 µg/L for naphthalene in water for the protection of aquatic life, except during autumn and winter at Sites DA/DB and winter at Site DC (US EPA, 2006). Phe and Ant, which differ structurally (isomers), were the two 3-ringed PAHs detected at higher concentrations compared to Acy, Can and Flu. The detected levels reached a maximum of 37.93 µg/L (in autumn) and 23.00 µg/L (in summer) for Phe and Ant, respectively, at Site DB, exceeding the threshold limit of 0.400 µg/L and 0.012 µg/L for phenanthrene and anthracene, respectively (USEPA, 2006). The prevalence of these 3-ringed PAHs at Site DB may be linked to PAH emission from the petrochemical refinery which is proximal to the site. The detected concentrations of other PAHs among the measured 16 in water samples from the Diep River were extremely high relative to the USEPA water quality guideline (USEPA, 2006). The observed levels of some of the measured PAH fractions exceeded the 0.015 to 5.800 µg/L threshold range of the CCME (Canadian Council of Ministers of the Environment) water quality guideline recommended for the protection of aquatic life (CCME, 1999). Hence, water samples of the Diep River may be considered highly polluted with PAHs and capable of impacting aquatic life adversely.
In general, suggested probable carcinogenic PAHs (C PAHs), namely, BaA, Chy, BbF, BkF, BaP, IcP and DBA, were prevalent in the Diep River water (see Table A5, Appendix), and contribute up to 72.36% of the total PAHs evaluated. This implies the potential of risk to native and mobile aquatic life as well as an impact on humans who may depend on these water resources.
The observed concentration range of the PAHs is consistent with other studies (ranging from 0.1 µg/L to 137 µg/L) in some South African surface waters, such as the Mutshundudi, Mutale, Nzhelele and Dzindi Rivers, amongst others (Nekhavhambe et al. 2014; Amdany et al. 2014) and in selected surface waters worldwide (Freitas et al., 2007; Olajire et al., 2007; Zhang et al., 2007; Li et al., 2010; Kafilzadeh et al., 2011; Qin et al., 2013; Tongo et al., 2017; Santos et al., 2018). Lower concentration ranges of between 33.5 ng/L and 126.8 ng/L were reported for bioavailable PAHs amongst other bioavailable fractions of persistent organic pollutants (POPs) in the Ifafi and Eagles Dams, the Homestead and Centurion Lakes, and the Jukskei, airport and Centurion rivers in the Johannesburg area, South Africa (Amdany et al. 2014).
Seasonal regimes influenced the detected levels of PAHs, with highest levels recorded in summer. The seasonal levels measured were in the order of summer > autumn > winter > spring, except for Site DA (Fig. 3). The higher PAHs levels observed during summer may be related to the elevated temperatures and low precipitation, which result in the critically low water column levels; this was much more pronounced downstream (Fig. 3). This could be responsible for more concentrated levels of PAH contaminants. Liu et al. (2016) also reported high PAH concentrations during elevated temperature periods and low PAH concentrations during flood periods.
Polycyclic aromatic hydrocarbon partitioning and distribution by ring size
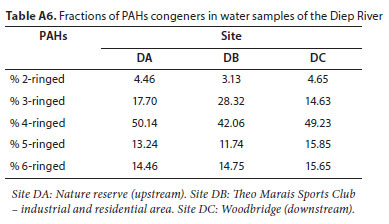
PAH distribution in water samples from the studied sites was relatively comparable. The 4-ringed PAHs were the most abundant, followed by the 3-ringed congeners, at all study sites, except for Site DC where more of the 5-ringed congeners occurred relative to the 3-ringed congeners. The least abundant was the 2-ringed PAH as shown in the Appendix (Table A6).
The abundance of 4-ringed PAHs in water samples has been reported previously (Santos et al., 2018). The dominance of the 4-ringed PAHs is obvious amongst the investigated PAHs, however the prevalence of the 3-ringed PAHs at Site DB, relative to Sites DA and DC, suggests a petrogenic contribution from anthropogenic activities near Site DB. The 3-ringed PAHs are dominant in petroleum; their prevalence is usually linked to atmospheric deposition and petroleum contamination, while the prevalence of the 4-ringed PAHs at all the sampling sites suggested that PAH contamination was predominantly from pyrogenic sources. This observation is in line with that of Santos et al. (2018), who assessed the distribution and seasonal variations of PAHs in a tropical estuarine system. The prevalence of 4-ringed and heavier PAHs in aquatic systems has been attributed to biomass combustion, but the poor solubility of PAHs in water will result in the high molecular weight (HMW) PAHs (≥5 rings) settling into the sediment compartment (Guo et al., 2007; Chen and Chen, 2011; Santos et al., 2018).
CONCLUSIONS
The USEPA-listed PAHs were detected in water samples collected from the Diep River. The Diep River flows through different land-use areas; upstream the river is dominated by agricultural activities, and formal and informal settlements as well as industrial establishments (oil refinery, chemical and clothing factories, as well as wastewater treatment plant) are the anthropogenic sources of PAHs downstream. Industrial activities were major sources of PAH contamination.
The spatial and temporal levels of PAHs in water samples from the Diep River showed seasonal variations. The annual average detected levels of chrysene (Chy) and benzo[a]anthracene (BaA) in water samples from all sampling sites were higher compared to other PAHs. The surface water samples of the Diep River were heavily contaminated with carcinogenic PAHs.
ACKNOWLEDGEMENTS
Prof BO Opeolu. acknowledges the National Research Foundation (NRF), South Africa, through the Thuthuka Research Grant No. 84185. The authors thank Mr David Kok for his technical assistance.
REFERENCES
ADENIJI AO, OKOH OO and OKOH AI (2019) Levels of polycyclic aromatic hydrocarbons in the water and sediment of Buffalo River Estuary, South Africa and their health risk assessment. Arch. Environ. Contam. Toxicol. 76 (4) 657-669. https://doi.org/10.1007/s00244-019-00617-w [ Links ]
AL-DAKHEEL AJ, IFTIKHAR HM and ABDUL RAHMAN AQM (2015) Impact of irrigation water salinity on agronomical and quality attributes of Cenchrus ciliaris L. accessions. Agric. Water Manage. 159 148-154. https://doi.org/10.1016/j.agwat.2015.06.014 [ Links ]
AMDANY R, CHIMUKA L, CUKROWSKA E, KUKUČKA P, KOHOUTEK J, TÖLGYESSY P and VRANA B (2014) Assessment of bioavailable fraction of POPs in surface water bodies in Johannesburg City, South Africa, using passive samplers: An initial assessment. Environ. Monit. Assess. 186 5639-5653. https://doi.org/10.1007/s10661-014-3809-3 [ Links ]
AZIZI G, LAYACHI M, AKODAD M, YÁÑEZ-RUIZ DR, MARTÍN-GARCÍA AI, BAGHOUR M, MESFIOUI A, SKALLI A and MOUMEN A (2018) Seasonal variations of heavy metals content in mussels (Mytilus galloprovincialis) from Cala Iris offshore (Northern Morocco). Mar. Pollut. Bull. 137 688-694. https://doi.org/10.1016/j.marpolbul.2018.06.052 [ Links ]
BŒUF G and PAYAN P (2001) How should salinity influence fish growth? Comp. Biochem. Physiol. Part C 130 411-423. https://doi.org/10.1016/S1532-0456(01)00268-X [ Links ]
BRIX KV, GERDES R, CURRY N, KASPER A and GROSELL M (2010) The effects of total dissolved solids on egg fertilization and water hardening in two salmonids-Arctic Grayling (Thymallus arcticus) and Dolly Varden (Salvelinus malma). Aquat. Toxicol. 97 109-115. https://doi.org/10.1016/j.aquatox.2009.12.011 [ Links ]
CAÑEDO-ARGÜELLES M, KEFFORD BJ, PISCART C, PRAT N, SCHÄFER RB and SCHULZ C-J (2013) Salinisation of rivers: An urgent ecological issue. Environ. Pollut. 173 157-167. https://doi.org/10.1016/j.envpol.2012.10.011 [ Links ]
CCME (Canadian Council of Ministers of the Environment) (1999). Canadian Water and Sediment Quality Guidelines for the Protection of Aquatic Life: Summary. [ Links ]
CHEN C-W and CHEN C-F (2011) Distribution, origin, and potential toxicological significance of polycyclic aromatic hydrocarbons (PAHs) in sediments of Kaohsiung Harbor, Taiwan. Mar. Pollut. Bull. 63 (5) 417-423. https://doi.org/10.1016/j.marpolbul.2011.04.047 [ Links ]
CHEN Y, ZHU L and ZHOU R (2007) Characterisation and distribution of polycyclic aromatic hydrocarbon in surface water and sediment from Qiantang River, China. J. Hazardous Mater. 141 (1) 148-155. https://doi.org/10.1016/j.jhazmat.2006.06.106 [ Links ]
CHRISTENSEN ER and ARORA S (2007) Source apportionment of PAHs in sediments using factor analysis by time records: application to Lake Michigan, USA. Water Res. 41 (1) 168-176. https://doi.org/10.1016/j.watres.2006.09.009 [ Links ]
CHRISTENSEN ER and BZDUSEK PA (2005) PAHs in sediments of the Black River and the Ashtabula River, Ohio: source apportionment by factor analysis. Water Res. 39 (4) 511-524. https://doi.org/10.1016/j.watres.2004.11.016 [ Links ]
DALLAS H (2008) Water temperature and riverine ecosystems: An overview of knowledge and approaches for assessing biotic responses, with special reference to South Africa. Water SA 34 (3) 393-404. https://doi.org/10.4314/wsa.v34i3.180634 [ Links ]
DASO AP, FATOKI OS and ODENDAAL JP (2016) Polybrominated diphenyl ethers (PBDEs) and hexabromobiphenyl in sediments of the Diep and Kuils Rivers in South Africa. Int. J. Sediment Res. 31 (1) 61-70. https://doi.org/10.1016/j.ijsrc.2013.10.001 [ Links ]
DEGGER N, WEPENER V, RICHARDSON BJ and WU RSS (2011) Brown mussels (Perna perna) and semi-permeable membrane devices (SPMDs) as indicators of organic pollutants in the South African marine environment. Mar. Pollut. Bull. 63 91-97. https://doi.org/10.1016/j.marpolbul.2011.04.024 [ Links ]
DWAF (Department of Water Affairs and Forestry, South Africa) (1996a) South African Water Quality Guidelines. Volume 7: Aquatic ecosystems. DWAF, Pretoria. [ Links ]
DWAF (Department of Water Affairs and Forestry, South Africa) (1996b) South African Water Quality Guidelines Volume 1: Domestic Water Use. DWAF, Pretoria. [ Links ]
EDOKPAYI JN, ODIYO JO, MSAGATI TAM and POTGIETER N (2015) Temporal variations in physico-chemical and microbiological characteristics of Mvudi River, South Africa. Int. J. Environ. Res. Public Health 12 (4) 4128-4140. https://doi.org/10.3390/ijerph120404128 [ Links ]
FENG L, ZHANG W, LIANG D and LEE J (2014) Total dissolved solids estimation with a fiber optic sensor of surface plasmon resonance. Optik 125 3337-3343. https://doi.org/10.1016/j.ijleo.2013.12.040 [ Links ]
FREITAS T, SILVA D, DE D, AZEVEDO A, RADLER F and NETO A (2007) Distribution of Polycyclic Aromatic Hydrocarbons in Surface Sediments and Waters from Guanabara Bay, Rio de Janeiro, Brazil. J. Braz. Chem. Soc. 18 (3) 628-637. https://doi.org/10.1590/S0103-50532007000300021 [ Links ]
GUO W, HE M, YANG Z, LIN C, QUAN X and WANG H (2007) Distribution of polycyclic aromatic hydrocarbons in water, suspended particulate matter and sediment from Daliao River watershed, China. Chemosphere 68 (1) 93-104. https://doi.org/10.1016/j.chemosphere.2006.12.072 [ Links ]
HESTER ET and DOYLE MW (2011) Human impacts to river temperature and their effects on biological processes: A quantitative synthesis. J. Am. Water Resour. Assoc. 47 (3) 571-587. https://doi.org/10.1111/j.1752-1688.2011.00525.x [ Links ]
HILDEBRANDT A, LACORTE S and BARCELÓ D (2006) Sampling of water, soil and sediment to trace organic pollutants at a river-basin scale. Anal. Bioanal. Chem. 386 (4) 1075-1088. https://doi.org/10.1007/s00216-006-0486-2 [ Links ]
HUSSAIN I, DAS M, AHAMAD KU and NATH P (2017) Water salinity detection using a smartphone. Sensors Actuators B 239 1042-1050. https://doi.org/10.1016/j.snb.2016.08.102 [ Links ]
ICH (International Conference on Hormonization) (2005) Validation of Analytical Procedures: Text and Methodology. International Conference on Harmonization (ICH) Q2(R1), Geneva. [ Links ]
JACKSON VA, PAULSE AN, ODENDAAL JP and KHAN W (2009) Investigation into the metal contamination of the Plankenburg and Diep Rivers, Western Cape, South Africa. Water SA 35 (3) 289-300. https://doi.org/10.4314/wsa.v35i3.76766 [ Links ]
KAFILZADEH F, SHIVA AH and MALEKPOUR R (2011) Determination of Polycyclic Aromatic Hydrocarbons (PAHs) in Water and Sediments of the Kor River, Iran. Middle-East J. Sci. Res. 10 (1) 1-7. [ Links ]
KARACA G and TASDEMIR Y (2014) Temporal and spatial variations in PAH concentrations in the sediment from the Nilufer Creek in Bursa, Turkey. J. Environ. Sci. Health A 49 (8) 900-912. https://doi.org/10.1080/10934529.2014.894330 [ Links ]
KARYAB H, YUNESIAN M, NASSERI S, MAHVI AH, AHMADKHANIHA R, RASTKARI N and NABIZADEH R (2013) Polycyclic aromatic hydrocarbons in drinking water of Tehran, Iran. J. Environ. Health Sci. Eng. 11 (25) 1-7. https://doi.org/10.1186/2052-336X-11-25 [ Links ]
KAUSHAL SS, GROFFMAN PM, LIKENS GE, BELT KT, STACK WP, KELLY VR, BAND LE and FISHER GT (2005) Increased salinisation of fresh water in the northeastern United States. Proc. Natl Acad. Sci. 102 (38) 13517-13520. https://doi.org/10.1073/pnas.0506414102 [ Links ]
KENT R and LANDON MK (2013) Trends in concentrations of nitrate and total dissolved solids in public supply wells of the Bunker Hill, Lytle, Rialto, and Colton groundwater subbasins, San Bernardino County, California: Influence of legacy land use. Sci. Total Environ. 452-453 125-136. https://doi.org/10.1016/j.scitotenv.2013.02.042 [ Links ]
KORKANÇ SY, KAYIKÇI S and KORKANÇ M (2017) Evaluation of Spatial and Temporal Water Quality in the Akkaya Dam Watershed (Niğde, Turkey) and Management Implications. J. Afr. Earth Sci. 129 481-491. https://doi.org/10.1016/j.jafrearsci.2017.01.034 [ Links ]
KUMAR KSA, PRIJU CP and PRASAD NBN (2015) Study on Saline Water Intrusion into the Shallow Coastal Aquifers of Periyar River Basin, Kerala Using Hydrochemical and Electrical Resistivity Methods. Aquat. Proc. 4 32-40. https://doi.org/10.1016/j.aqpro.2015.02.006 [ Links ]
KUT KMK, SARSWAT A, BUNDSCHUH J and MOHAN D (2018) Water as key to the Sustainable Development Goals of South Sudan - A water quality assessment of Eastern Equatoria State. Groundwater Sustainable Dev. 8 255-270. https://doi.org/10.1016/j.gsd.2018.07.005 [ Links ]
LI B, FENG C, LI X, CHEN Y, NIU J and SHEN Z (2012) Spatial distribution and source apportionment of PAHs in surficial sediments of the Yangtze Estuary, China. Mar. Pollut. Bull. 64 (3) 636-643. https://doi.org/10.1016/j.marpolbul.2011.12.005 [ Links ]
LI J, SHANG X, ZHAO Z, TANGUAY RL, DONG Q and HUANG C (2010) Polycyclic aromatic hydrocarbons in water, sediment, soil, and plants of the Aojiang River waterway in Wenzhou, China. J. Hazardous Mater. 173 (1-3) 75-81. https://doi.org/10.1016/j.jhazmat.2009.08.050 [ Links ]
LIU M, FENG J, HU P, TAN L, ZHANG X and SUN J (2016) Spatial-temporal distributions, sources of polycyclic aromatic hydrocarbons (PAHs) in surface water and suspended particular matter from the upper reach of Huaihe River, China. Ecol. Eng. 95 143-151. https://doi.org/10.1016/j.ecoleng.2016.06.045 [ Links ]
LIU Y, SHEN J, CHEN Z, REN N and LI Y (2013) Distribution of polycyclic aromatic hydrocarbons in surface water and sediment near a drinking water reservoir in Northeastern China. Environ. Sci. Pollut. Res. 20 2535-2545. https://doi.org/10.1007/s11356-012-1164-x [ Links ]
MA W-L, LIU L-Y, QI H, ZHANG Z-F, SONG W-W, SHEN J-M, CHEN Z-L, REN N-Q, GRABUSKI J and LI Y-F (2013) Polycyclic aromatic hydrocarbons in water, sediment and soil of the Songhua River Basin, China. Environ. Moni. Assess. 185 8399-8409. https://doi.org/10.1007/s10661-013-3182-7 [ Links ]
MANOLI E and SAMARA C (1999) Polycyclic aromatic hydrocarbons in natural waters: Sources, occurrence and analysis. Trends Anal. Chem. 18 (6) 417-428. https://doi.org/10.1016/S0165-9936(99)00111-9 [ Links ]
MUNYENGABE A, MAMBANDA A and MOODLEY B (2017) Polycyclic aromatic hydrocarbons in water, soils and surface sediments of the Msunduzi River. J. Environ. Anal. Chem. 4 (4) 1-13. https://doi.org/10.4172/2380-2391.1000227 [ Links ]
NEKHAVHAMBE TJ, VAN REE T and FATOKI OS (2014) Determination and distribution of polycyclic aromatic hydrocarbons in rivers, surface runoff, and sediments in and around Thohoyandou, Limpopo Province, South Africa. Water SA 40 (3) 415-424. https://doi.org/10.4314/wsa.v40i3.4 [ Links ]
OLAJIRE AA, ALADE AO, ADENIYI AA and OLABEMIWO OM (2007) Distribution of polycyclic aromatic hydrocarbons in surface soils and water from the vicinity of Agbabu bitumen field of Southwestern Nigeria. J. Environ. Sci. Health A 42 (8) 1043-1049. https://doi.org/10.1080/10934520701418474 [ Links ]
OPEOLU BO, FATOKI OS and ODENDAAL J (2010) Development of a solid-phase extraction method followed by HPLC-UV detection for the determination of phenols in water. Int. J. Phys. Sci. 5 576-581. [ Links ]
PAULSE AN, JACKSON VA and KHAN W (2009) Comparison of microbial contamination at various sites along the Plankenburg-and Diep Rivers, Western Cape, South Africa. Water SA 35 (4) 469-478. https://doi.org/10.4314/wsa.v35i4.76808 [ Links ]
QIAO M, HUANG S and WANG Z (2008) Partitioning characteristics of PAHs between sediment and water in a shallow lake. J. Soils Sediments 8 (2) 69-73. https://doi.org/10.1065/jss2008.03.279 [ Links ]
QIN N, HE W, KONG XZ, LIU WX, HE QS, YANG B, OUYANG HL, WANG QM and XU FL (2013) Ecological risk assessment of polycyclic aromatic hydrocarbons (PAHs) in the water from a large Chinese lake based on multiple indicators. Ecol. Indic. 24 599-608. https://doi.org/10.1016/j.ecolind.2012.08.019 [ Links ]
RUIZ Y, SUAREZ P, ALONSO A, LONGO E, VILLAVERDE A and SAN JUAN F (2011) Environmental quality of mussel farms in the Vigo Estuary: Pollution by PAHs, origin and effects on reproduction. Environ. Pollut. 159 (1) 250-265. https://doi.org/10.1016/j.envpol.2010.08.031 [ Links ]
SALLAM GAH and ELSAYED EA (2018) Estimating relations between temperature, relative humidity as independed variables and selected water quality parameters in Lake Manzala, Egypt. Ain Shams Eng. J. 9 (1) 1-14. https://doi.org/10.1016/j.asej.2015.10.002 [ Links ]
SANTOS E, SOUZA MRR, VILELA AR, SOARES LS, FRENA M and ALEXANDRE MR (2018) Polycyclic aromatic hydrocarbons (PAHs) in superficial water from a tropical estuarine system: Distribution, seasonal variations, sources and ecological risk assessment. Mar. Pollut. Bull. 127 352-358. https://doi.org/10.1016/j.marpolbul.2017.12.014 [ Links ]
SHARMA A, KUNDU SS, TARIQ H, KEWALRAMANI N and YADAV RK (2017) Impact of total dissolved solids in drinking water on nutrient utilisation and growth performance of Murrah buffalo calves. Livestock Sci. 198 17-23. https://doi.org/10.1016/j.livsci.2017.02.002 [ Links ]
SHI Z, TAO S, PAN B, FAN W, HE XC, ZUO Q, WU SP, LI BG, CAO J, LIU WX, XU FL, WANG XJ, SHEN WR and WONG PK (2005) Contamination of rivers in Tianjin, China by polycyclic aromatic hydrocarbons. Environ. Pollut. 134 (1) 97-111. https://doi.org/10.1016/j.envpol.2004.07.014 [ Links ]
SHUPING LS, SNYMAN RG, ODENDAAL JP and NDAKIDEMI PA (2011) Accumulation and distribution of metals in Bolboschoenus maritimus (Cyperaceae), from a South African river. Water Air Soil Pollut. 216 (1-4) 319-328. https://doi.org/10.1007/s11270-010-0535-5 [ Links ]
SYLUS KJ and RAMESH H (2015) The study of sea water intrusion in coastal aquifer by electrical conductivity and total dissolved solid method in Gurpur and Netravathi River basin. Aquat. Proced. 4 57-64. https://doi.org/10.1016/j.aqpro.2015.02.009 [ Links ]
TAUHID UR RAHMAN M, RASHEDUZZAMAN M, HABIB MA, AHMED A, TAREQ SM and MUNIRUZZAMAN SM (2017) Assessment of fresh water security in coastal Bangladesh: An insight from salinity, community perception and adaptation. Ocean Coast. Manage. 137 68-81. https://doi.org/10.1016/j.ocecoaman.2016.12.005 [ Links ]
TONGO I, EZEMONYE L and AKPEH K (2017) Levels, distribution and characterisation of polycyclic aromatic hydrocarbons (PAHs) in Ovia river, Southern Nigeria. J. Environ. Chem. Eng. 5 (1) 504-512. https://doi.org/10.1016/j.jece.2016.12.035 [ Links ]
USEPA (United States Environmental Protection Agency) (2014) Priority Pollutant List. Toxic and Priority Pollutants Under the Clean Water Act: 2.URL: https://www.epa.gov/eg/toxic-and-priority-pollutants-under-clean-water-act [ Links ]
USEPA (United States Environmental Protection Agency) (2006) EPA Region III BTAG FRESHWATER SEDIMENT SCREENING BENCHMARKS. [ Links ]
WANG X, ZHAO L, XU H and ZHANG X (2018) Spatial and seasonal characteristics of dissolved heavy metals in the surface seawater of the Yellow River Estuary, China. Mar. Pollut. Bull. 137 465-473. https://doi.org/10.1016/j.marpolbul.2018.10.052 [ Links ]
WEI M-C and JEN J-F (2007) Determination of polycyclic aromatic hydrocarbons in aqueous samples by microwave assisted headspace solid-phase microextraction and gas chromatography/flame ionisation detection. Talanta 72 1269-1274. https://doi.org/10.1016/j.talanta.2007.01.017 [ Links ]
WHO (World Health Organization) (2006) Guidelines for Drinking-water Quality: First addendum to Third Edition Volume 1. Geneva, Switzerland. [ Links ]
WOLF MA, SFRISO A and MORO I (2014) Thermal pollution and settlement of new tropical alien species: The case of Grateloupia yinggehaiensis (Rhodophyta) in the Venice Lagoon. Estuar. Coast. Shelf Sci. 147 11-16. https://doi.org/10.1016/j.ecss.2014.05.020 [ Links ]
WURTS WA and DURBOROW RM (1992) Interactions of pH, carbon dioxide, alkalinity and hardness in fish ponds. South. Regional Aquacult. Center (SRAC) Publ. 464 1-4. [ Links ]
YAMADA M, TAKADA H, TOYODA K, YOSHIDA A, SHIBATA A, NOMURA H, WADA M, NISHIMURA M, OKAMOTO K and OHWADA K (2003) Study on the fate of petroleum-derived polycyclic aromatic hydrocarbons (PAHs) and the effect of chemical dispersant using an enclosed ecosystem, mesocosm. Mar. Pollut. Bull. 47 (1) 105-113. https://doi.org/10.1016/S0025-326X(03)00102-4 [ Links ]
ZAKERI-MILANI P, BARZEGAR-JALALI M, TAJERZADEH H, AZARMI Y and VALIZADEH H (2005) Simultaneous determination of naproxen, ketoprofen and phenol red in samples from rat intestinal permeability studies: HPLC method development and validation. J. Pharm. Biomed. Anal. 39 (3) 624-630. https://doi.org/10.1016/j.jpba.2005.04.008 [ Links ]
ZENG S, ZENG L, DONG X and CHEN J (2013) Polycyclic aromatic hydrocarbons in river sediments from the western and southern catchments of the Bohai Sea, China: toxicity assessment and source identification. Environ. Monit. Assess. 185 (5) 4291-4303. https://doi.org/10.1007/s10661-012-2869-5 [ Links ]
ZHANG S, ZHANG Q, DARISAW S, EHIE O and WANG G (2007) Simultaneous quantification of polycyclic aromatic hydrocarbons (PAHs), polychlorinated biphenyls (PCBs), and pharmaceuticals and personal care products (PPCPs) in Mississippi river water, in New Orleans, Louisiana, USA. Chemosphere 66 (6) 1057-1069. https://doi.org/10.1016/j.chemosphere.2006.06.067 [ Links ]
ZHANG Z, HUANG J, YU G and HONG H (2004) Occurrence of PAHs, PCBs and organochlorine pesticides in the Tonghui River of Beijing, China. Environ. Pollut. 130 249-261. https://doi.org/10.1016/j.envpol.2003.12.002 [ Links ]
ZHOU J, HONG H, ZHANG Z, MASKAOUI K and CHEN W (2000) Multi-phase distribution of organic micropollutants in Xiamen Harbour, China. Water Res. 34 (7) 2132-2150. https://doi.org/10.1016/S0043-1354(99)00360-7 [ Links ]
 Correspondence:
Adetunji A Awe
tunjyaweson2007@gmail.com
Received: 26 August 2019
Accepted: 10 December 2019


