


Serviços Personalizados
Artigo
 Inglês (pdf)
 Artigo em XML
 Referências do artigo
Indicadores

Links relacionados
-
 Citado por Google
 -
 Similares em Google
Compartilhar

 Permalink
Water SA
versão On-line ISSN 1816-7950
versão impressa ISSN 0378-4738
Water SA vol.46 no.1 Pretoria Jan. 2020
http://dx.doi.org/10.17159/wsa/2020.v46.i1.7887
RESEARCH PAPERS
National Wetland Map 5: An improved spatial extent and representation of inland aquatic and estuarine ecosystems in South Africa
Heidi van DeventerI, II; Lara van NiekerkIII, IV; Janine AdamsV; Millicent Ketelo DinalaVI; Ridhwannah GangatII; Stephen J LamberthIV, VII, VIII; Mervyn LötterIX; Namhla MbonaVI; Fiona MacKayX, XI; Jeanne L NelXII, XIII; Carla-Louise RamjukadhIII; Andrew SkownoVI, XIV; Steven P WeertsXV, XVI
ICouncil for Scientific and Industrial Research (CSIR), PO Box 395, Pretoria 0001, South Africa
IISchool of Geography, Archaeology and Environmental Studies, University of the Witwatersrand (WITS), Private Bag 3, Johannesburg 2050, South Africa
IIICouncil for Scientific and Industrial Research (CSIR), PO Box 320, Stellenbosch 7600, South Africa
IVInstitute for Coastal and Marine Research (CMR), Nelson Mandela University, Private Bag X6531, Port Elizabeth 6530, South Africa
VDepartment of Botany, Nelson Mandela University, PO Box 77000, Port Elizabeth 6031, South Africa
VISouth African National Biodiversity Institute, Private Bag x101, Pretoria, 0001, South Africa
VIIDepartment of Environmental Affairs: Fisheries Research and Development, Private Bag X2, Vlaeberg 8018, Cape Town, South Africa
VIIISouth African Institute for Aquatic Biodiversity, Private Bag 1015, Grahamstown 6140, South Africa
IXMpumalanga Tourism and Parks Agency (MTPA), Private Bag X1088, Lydenburg 1120, South Africa
XOceanographic Research Institute, South African Association for Marine Biological Research, PO Box 10712, Durban 4056, South Africa
XISchool of Life Sciences, University of KwaZulu-Natal, Durban, 3630, South Africa
XIIWageningen Environmental Research, Postbus 47, 6700 AA, Wageningen, The Netherlands
XIIISustainability Research Unit, Nelson Mandela University, Private Bag X6531, George 6530, South Africa
XIVDepartment of Biological Sciences, University of Cape Town, Private Bag X3, Rondebosch, South Africa
XVCouncil for Scientific and Industrial Research (CSIR), 359 King George V (5th) Avenue, Durban 400, South Africa
XVIDepartment of Zoology and CRUZ, University of Zululand, Private Bag X1001, Kwadlangezwa 3886, South Africa
ABSTRACT
The improved representation of freshwater and estuarine ecosystems and associated data was a key component of the 2018 National Biodiversity Assessment, and is an essential step in enhancing defensible land use planning and decision making. This paper reports on the enhancement of the National Wetland Map (NWM) version 5 for South Africa and other data layers associated with the South African Inventory of Inland Aquatic Ecosystems. Detail is provided on (i) the extent of wetlands mapped in NWM5, compared to previous versions of the NWMs; (ii) the improved extent of inland wetlands mapped in focus areas in NWM5 relative to NWM4; (iii) the type of cover associated with the wetlands (inundated, vegetated or arid); (iv) the ecotone between rivers and estuaries; and (v) level of confidence for the inland wetlands in terms of how well the extent and hydrogeomorphic units were captured for each sub-quaternary catchment of South Africa. A total of 4 596 509 ha (3.8% of South Africa) of inland aquatic ecosystems and artificial wetlands have now been mapped, with NWM5 delineating 23% more inland wetlands (2 650 509 ha or 2.2% of SA) compared with NWM4. The estuarine functional zone, which encapsulates all estuarine processes, and associated habitats and biota, was refined for 290 systems totalling 200 739 ha, with the addition of 42 micro-estuaries totalling 340 ha. Nearly 600 000 ha (0.5% of SA) of artificial wetlands were mapped in SA. Inland wetlands are predominantly palustrine (55%), with some arid (34%) and a few inundated systems (11%). Ecotones between rivers and estuaries, ecotones where biota and processes continuously vary from freshwater to estuarine, formed a small fraction (<1.5%) of river total extent (164 018 km). Most inland wetlands (~70%) had a low confidence ranking for designation of extent and typing, because they were not mapped by a wetland specialist and not verified in the field. Future improvements of the map should be focused on catchment-based improvements, particularly in strategic water-source areas, areas of high development pressure and those with low confidence designation.
Keywords: wetland inventory, National Wetland Map, inland aquatic ecosystems, estuarine functional zone, macro estuaries, micro estuaries, National Biodiversity Assessment, Sustainable Development Goal (SDG) reporting, Ramsar
INTRODUCTION
The South African National Wetland Map (NWM) provides information on the location, spatial extent and ecosystem types of two of the three broad aquatic ecosystems, namely, estuarine and inland aquatic (freshwater) ecosystems. An aquatic ecosystem is defined as 'an ecosystem that is permanently or periodically inundated by flowing or standing water, or which has soils that are permanently or periodically saturated within 0.5 m of the soil surface' (Ollis et al., 2013 p.1). In South Africa, inland aquatic ecosystems comprise both rivers and inland wetlands and are distinguished from estuarine systems, although a transition ecotone exists amongst these systems where biotic and abiotic processes vary over hydrological cycles. The NWM represents the extent and ecosystem types of the estuarine and inland wetlands, collectively known as wetlands, and informs decision makers in assessing development applications, land use and conservation planning and policy making (Nel et al., 2016). Wetlands are protected under the National Water Act (Act 36 of 1998; RSA, 1998a), and estuaries receive additional protection under the Marine Living Resources Act (Act No. 18 of 1998; RSA, 1998b) and National Environmental Management: Integrated Coastal Management Act (Act No. 24 of 2008; RSA, 2008). The spatial representation of the aquatic ecosystems in NWMs is crucial for the assessment of the threat status and protection levels, the two headline indicators of the National Biodiversity Assessments (NBA), as well as the listing of threatened ecosystem types under the National Environmental Management: Biodiversity Act (NEMBA), Act 10 of 2004 (RSA, 2004). Owing to the poor representation of inland wetlands in previous NWMs (Mbona et al., 2015; Schael et al., 2015; Van Deventer et al., 2016; Melly et al., 2016), as well as the need to improve the representation of South Africa's estuaries, a significant effort was made to improve the National Wetland Map version 5 (NWM5) in preparation for the NBA 2018.
In addition to national obligations in the improvement of the NWM, South Africa also has international obligations in reporting the extent, biodiversity and integrity of its wetlands (inland wetlands and estuaries). The results of the NBAs are used by the Department of Environment, Forestry & Fisheries (DEFF) to inform the global Convention on Biological Diversity (CBD), whereas the extent and quality of wetland types are important for monitoring and reporting on the Sustainable Development Goals (SDGs) to the United Nations Environment Programme (UNEP) (UN, 2015). The extent of vegetated and inundated wetlands is, for example, required under indicators related to SDG6 ('Ensure availability and sustainable management of water and sanitation for all'), whereas ecosystem diversity, protection and restoration is reported under SDG15 ('Protect, restore and promote sustainable use of terrestrial ecosystems, sustainably manage forests, combat desertification, and halt and reverse land degradation and halt biodiversity loss'). The improvements to NWM5, therefore, had to include both ecosystem diversity information, ecological condition, as well as cover type, including types that are inundated (lacustrine), vegetated (palustrine) or arid.
The National Freshwater Ecosystems Priority Areas (NFEPA) atlas compiled in 2011 (Nel et al., 2011) used a number of sub-national datasets to improve the spatial extent of inland wetlands mapped in NWM3, and modelled some of the wetland ecosystem types to Level 4A of the Classification System (Ollis et al., 2013). The NFEPA wetlands dataset was subsequently used in the NBA 2011 for the assessment of the headline indicators of inland wetlands (Driver et al., 2012) and adopted by the South African National Biodiversity Institute (SANBI) as NWM4. Several studies indicated that NWM4 showed up to 46% omission errors compared to wetlands mapped at finer scales and that the hydrogeomorphic (HGM) units were incongruent between the modelled and fine-scale mapped wetlands (Mbona et al., 2015; Schael et al., 2015; Van Deventer et al., 2016; Melly et al., 2016). The shortcomings of the NWM4 could be attributed, on the one hand, to the modelling of the extent of the wetlands using space-borne Satellite Pour l'Observation de la Terre-5 (SPOT) and Landsat multispectral imagery with inappropriate spatial resolution for detecting some of the small-scale inland wetlands in the semi-arid to arid South Africa (Thompson et al., 2002). Apart from omission errors, an evaluation of the NWM4 for Gauteng also revealed a commission error (a false presence of inland wetlands) of 32% (Van Deventer et al., 2018a). Essentially, the spectral bands of these multispectral images are unable to distinguish vegetated wetlands from adjacent terrestrial vegetation, resulting in poor representation of these systems in NWM4. Extrapolating these statistics to the rest of the country suggested that about half of the South African inland wetlands might not be represented in the NWM, of which two-thirds are truly wetlands, resulting in only a third of South Africa's wetlands being represented in NWM4. Thus, the improved representation and typing of inland wetlands was crucial for improved assessment of the Ecosystem Threat Status (ETS) and Ecosystem Protection Levels (EPL) for the NBA 2018.
Since the NFEPA wetland maps of 2011, several national and sub-national wetland datasets have been published, which have enabled the improvement of the extent and wetland types across the country (Van Deventer et al., 2018a; Van Deventer et al., 2018a,b). The NFEPA wetlands had a tremendous impact at several levels (Nel et al., 2016). In addition, several funding sources, made available during the onset of the NBA 2018, facilitated the improvement of the extent of the wetland map in a number of district municipalities. Other examples are the National Land Cover data (GTI, 2015; 2016), which mapped the open water bodies of natural and artificial wetlands, and the Leaf Area Index (LAI), as a proxy for vegetation biomass, which was generated for South Africa through inversion modelling from the Moderate Resolution Imaging Spectroradiometer (MODIS) imagery (Cho et al., 2017). In addition to the vegetation bioregions included in the National Vegetation Map update for the NBA 2018 (Dayaram et al., 2019), cover types for wetlands could be estimated. Thus several opportunities were aligned to improve the extent of the wetlands in the NWM5, the typing of inland wetland ecosystems and the determination of the cover type.
Estuaries require a more accurate delineation of the spatial extent as the estuarine functional zone represents a 'development setback line' and feeds into supporting estuarine and coastal management processes and legislation (Van Niekerk et al., 2018; 2019a; Harris et al., 2019). Since there are less than 300 functional estuaries in South Africa, it was achievable to place extensive effort into addressing previous deficiencies in the updated estuary delineation of 2018 (Van Niekerk et al., 2019a, in press). As in the case of the inland wetlands, several projects enabled improvement in assessment of coverage of estuarine functional zones (EFZs) and the demarcation of micro-estuaries for the first time in the NBA process (Van Niekerk et al., in press). An estuary is a partially enclosed permanent water body, either continuously or periodically open to the sea on decadal time scales, extending as far as the upper limit of tidal action, salinity penetration or back-flooding under closed-mouth conditions (Van Niekerk et al., 2013, modified from Cameron and Prichard, 1963). Extremes to this generic definition are during floods, when an estuary can become a river mouth with no seawater entering the formerly estuarine area, or, when there is little or no fluvial input, an estuary can be isolated from the sea by a sandbar and become fresh or hypersaline (modified from Van Niekerk and Turpie, 2012; Van Niekerk et al., 2013). Veldkornet et al. (2015) highlighted that critical estuarine habitats, such as salt marshes and swamp forest, were excluded from the NBA 2011, thereby under-representing the functional zones of these systems. Additional supporting information, available since the conclusion of the previous NBA 2018, is the significant effort that has gone into updating the National Estuarine Botanical Database with field observations and more detailed mapping (Adams et al., 2016), the Light Detection and Radar (LiDAR) data collection for parts of the coast, promising a spatial accuracy in mapping between 5 and 10 cm in the x, y and z spatial components, the use of supporting datasets (such as the 5 and 10 m interval above mean sea level contours [DRDLR:NGI, 2017]) and the Shuttle Radar Topography Mission (STRM) 30 m data which is readily available in digital format (USGS, 2004). Estuaries are dynamic ecosystems and without a proper understanding of changes over time, these ecosystems cannot be assessed and managed appropriately. Google Earth provided such a time-series dataset, allowing the mapping of the ever-changing processes that characterise South African estuaries, e.g., changes in mouth configuration and inundation patterns.
Micro-estuaries (i.e. estuaries < 500 m in length and/or < 2 ha in size), river outlets, coastal seeps, ephemeral systems, and waterfalls, were only represented as x,y point data in 2011, but in the current NWM5 iteration effort was made to map some of these smaller features (Van Niekerk et al., 2019a; Harris et al., 2019). It was also deemed important that transition zones above estuaries and into coastal freshwaters be identified and demarcated. These are essentially river-estuary ecotones immediately upstream of estuaries but not including the river-estuarine interface (REI). The REI is defined as the area in an estuary within which salinity ranges from 10 to zero under the influence of the upstream limits of back-flooding or tidal intrusion.
An ecotone is a 'zone of transition between adjacent ecological systems, having a set of characteristics uniquely defined by time and space scales, and by the strength of the interactions between adjacent ecological systems' (Di Castri et al., 1988 p.19). Previous research dealt with processes within relative homogenous landscapes (Holland et al., 2012), but a growing appreciation is that abiotic and biotic components move through heterogeneous landscapes and the boundaries (ecotones) between such units are dynamic. In aquatic ecosystems, physicochemical change for animals is far more pronounced than in the terrestrial environment; an example is the freshwater and estuary ecotone with a substantial change in chemical condition (e.g. salinity) (Thorp, 2015). This ecotone is critical for satisfying the life-cycle needs of many organisms and can be characterised by high productivity and ecological diversity (due to edge effects). River-estuary ecotones are areas which, during any time of their hydroperiod, would host estuarine and riverine biota but only have abiotic characteristics of freshwater ecosystems. These ecotones have previously been poorly defined, owing to their dynamic nature over long hydrological cycles and research being largely deficient with respect to their nature and characteristics (see also Rundle et al., 1998). They are essential supporting habitats to estuarine systems, and require proper mapping for the purpose of policy formulation and their protection. In addition, coastal aquatic ecosystems are also poorly understood and mapped for South Africa. A number of coastal depressions were identified according to the criterion '…organisms of estuarine origin (algae, crustaceans, and fish, which are relicts in the case of lakes cut off from the sea since the last Ice Age) but are normally uninfluenced by the sea' (Noble and Hemens, 1978 p. 37).
SANBI, in collaboration with the Council for Scientific and Industrial Research (CSIR), coordinated the improvement of the NWM5, supported by several other institutions. The aim was to improve the representation of the spatial extent and type of inland wetland and estuarine ecosystem types of South Africa in NWM5. We report the total spatial extent of inland wetlands and estuaries mapped in NWM5 as follows:
•The extent of wetlands mapped in NWM5 in comparison to previous versions of the NWMs
•The improvement in the representation of inland wetlands mapped in focus areas in NWM5 relative to NWM4
•The type of cover associated with the wetlands (inundated, vegetated or arid)
•Ecotones between rivers or inland wetlands and estuaries mapped as river-estuary ecotones
•The level of confidence for the inland wetlands in terms of how well the extent and hydrogeomorphic units were captured for each sub-quaternary catchment of South Africa
Our intention is to inform users of the improvements and shortcomings of NWM5 so that it is appropriately used in planning and decision making, whilst enabling better planning for the wetland inventory of South Africa.
METHODS
Improving representation of inland wetlands
For inland wetlands, features mapped by the former Department of Land Affairs: Chief Directorate of Surveys and Mapping (DLA:CDSM, 2006) and incorporated in NWM4 were extracted and retained for use in the NWM5. These included all types of pans, river areas, lakes, marshes, and vleis. This dataset was readily available at a national scale, since it was merged and used in mapping of the NFEPA wetlands (NWM4). The other updates from the present Department of Rural Development and Land Reform: Directorate National Geo-Information (DRDLR:NGI) of 2009 and 2012 were, however, not yet merged and topologically cleaned for use at a national scale. Updated versions of these hydrological features were collected from the DRDLR:NGI (2016) as provincial geodatabases at the end of March 2016. Hydrological features related to inland wetlands included dry, salt, non-perennial and perennial pans, water-course features, flood banks, lakes, marshes or vleis, mudflats, pools, river areas, and swamps. The DRDLR:NGI MapInfo provincial geodatabases were imported and merged into a single feature class in ArcGIS 10.3 (ESRI, 1999-2014). The data were projected to the South African coordinate system used by the NBA 2018, the Albers Equal Area (AEA) Conical projection with the spheroid and datum being the World Geodetic System of 1984 (WGS84). This coordinate system least distorts the surface area extent calculated for ecosystems (Waywell, 2009). It uses the 25°E as central meridian with two standard parallels including 24°S and 33°S. The topology was cleaned to avoid duplicate or overlapping polygons, and subtypes were defined to enable consistent distribution mapping by multiple data capturers, trained in wetland mapping and GIS, across the country.
Firstly, all nationally available datasets were incorporated, including the Working for Wetlands data available from the Biodiversity Geographical Information System which have been mapped by SANBI since 2006, peatlands data from Water Research Commission (WRC) Report No. 2346/1/17 (Grundling et al., 2017) and the extent of the estuaries mapped for the NBA 2011 (Van Niekerk and Turpie, 2011; Van Niekerk et al., 2013). The spring points from the DRDLR:NGI 2016 dataset were buffered by 2 m and classified as seeps. The pans and river areas, mapped in 2006 and 2016 by DLA:CDSM and DRDLR:NGI respectively, were translated to Level 4A (HGM units) of the Classification System as depressions and rivers. HGM units assigned by the Working for Wetlands teams were kept as is. All feature names were corrected, and the version was called NWM version 5.2. NWM5.2 was clipped to provinces and distributed to data capturers.
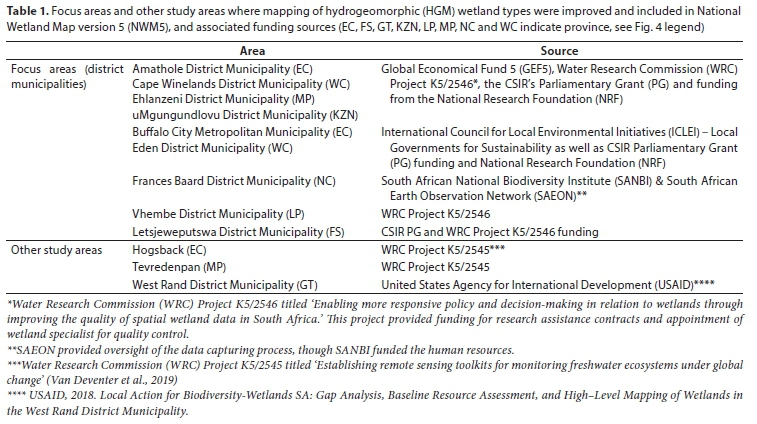
Secondly, all available fine-scale datasets (see Van Deventer et al., 2018a; Van Deventer et al., 2018a,b) were merged with the clipped version of NWM5.2, into version 5.3. A merge was used to easily identify overlapping areas where the data capturer then evaluated the multiple, overlapping polygons from diverse studies and judged which one should be retained, if not all. Available inland wetland data were integrated and additional wetlands were mapped by data capturers for nine focus areas (Table 1) for the period between 1 September 2016 and 31 March 2017. Datasets from three other study areas also improved the NWM5 draft versions. These were the West Rand District Municipality (USAID, 2018) and two study areas from the WRC K5/2545 project, the southern part of the sub-quaternary catchment (SQ4) 7439 (in quaternary catchment S32D) around the town Hogsback and the western part of the SQ4 1375 (in quaternary catchment W55A) in which Tevredenpan is situated (Van Deventer et al., 2017).
During the integration and mapping phase, the attributes of inland wetland types had to be completed for Levels 1, 3 and 4A of the Classification System. Back-drop imagery included the freely available 50 cm colour orthophotography available through the ArcGIS online web map service from DRDLR:NGI dated from 2012 to 2013. SPOT imagery was also used in some instances, dated to similar years. Unfortunately, most of these images were largely taken during the dry season, possibly to avoid cloud cover, and therefore were less suitable for the purpose of wetland mapping. Where the data capturer found it difficult to judge the extent or HGM type of the wetland, historical images available through Google Earth were accessed to support the mapping of inland wetlands.
Decisions regarding the extent and ecosystem type for features were guided primarily by three principles: to always map the maximum extent of a wetland, if possible, to map the original extent (historic maximum), and to retain the extent and typing done in fine-scale datasets. The focus areas were then reviewed by national wetland experts (Freshwater Consultancy Group Pty Ltd (FCG) and Wetland Consultancy Services (Pty) Ltd (WCS)) and corrections implemented by data capturers. Subsequently, the available data for the remainder of the provinces were integrated with limited mapping of large floodplains, wetlands in Ramsar sites, and nine limnetic depressions. Limnetic depressions were considered unique wetland types where the maximum depth exceeds 2 m at the average annual low-water level of an open waterbody (Ollis et al., 2013). The nine limnetic depressions mapped in NWM5 included Barberspan (North West), De Hoop (Western Cape), Groenvlei (Western Cape), Lake Banagher, Lake Chrissie and Tevredenpan (Mpumalanga), Lake Fundudzi (Limpopo), Lake kuZilonde (KwaZulu-Natal), and Lake Sibaya (KwaZulu-Natal) (compiled from Hill, 1969; Miller, 1998; Noble and Hemens, 1978; https://www.lakepedia.com/). Following the integration of the provincial datasets, these were reviewed and edits implemented.
Mapping artificial wetlands as a separate layer
To better represent the original wetland extent for the NBA 2018, artificial wetlands were compiled as a separate feature class layer in the ArcGIS geodatabase. This was to assess disturbance effects on wetland ecosystem types in the NBA 2018 assessment report. Artificial wetlands were compiled from the DLA:CDSM 2006 dataset included in NWM4, and from updated hydrological data received from DRDLR:NGI in 2016, the large dams register (approximately 159 dams) dataset from the Department of Water and Sanitation (DWS, 2015), as well as farm dams mapped for the DWS Verification and Validation project for selected tertiary catchments in the Breede-Gouritz Water Management Area and the KwaZulu-Natal Province (DWS, unpublished results). Overall, the features included in this dataset are large, closed and open reservoirs, large state dams, smaller farm dams, fish farms, pools, purification plants, sewage works, slimes dams, tailing impoundments and water tanks. Where artificial wetlands were situated within an inland wetland ecosystem type, the artificial wetland polygon had to be merged with the adjacent polygon to represent the original extent prior to the modification. Isolated artificial wetlands were completely deleted from the NWM5.
Improving the representation of estuaries
The mapping convention for determining the 'estuary functional zone' (EFZ) was based on a precautionary approach with the departure point being the first inland 5 m contour above mean sea level, to capture all estuarine processes and biotic responses. This dataset was then adjusted to address the shortcomings identified by Veldkornet et al. (2015), e.g., exclusions of swamp forest (freshwater mangrove) and salt marsh areas contiguous to estuaries. In addition, all habitat features excluded from ground-truthed vegetation maps were also incorporated in the new delineation (Adams et al., 2016). The EFZ boundary, where possible, mapped the maximum extent of the historical and present geographical boundary (although resources were only available to do this accurately in KZN). The location of estuary outlets was determined by the maximum extent of migration of the estuary mouth or outlet (furthest north and south) as identified from any historical image, i.e., Google Earth or historic aerial photographs. Areas identified by coastal LiDAR datasets (corrected to mean sea level and verified by experts) or the 1:100 year flood line delineation (only available for the Groot Berg or Breede estuaries) were also incorporated. All 'island' type features created by high elevation areas surrounded by estuarine floodplains were incorporated into the EFZ. In addition, in the case of small, incised estuaries (i.e. where the 0 m, 5 m and 10 m contour are close to one another) with relatively high river inflow, delineation was based on the 10 m contour above mean sea level to accommodate mapping uncertainty and lateral movement. The EFZ was also extended to incorporate environments that are predominantly surrounded by estuarine habitats or processes (i.e. more than 75% of feature is surrounded by S- and U-bends). In addition, habitat features that support estuarine functioning were also included to ensure future health, i.e., upstream inland wetlands that influence estuarine water quality by filtering nutrients. This included the incorporation of small areas of inland aquatic ecosystems contiguous to estuaries, e.g., seeps and springs. Overall, the 2018 revised EFZs strived to incorporate all vegetation ecotones that have elements of estuarine habitat, e.g., mosaics of swamp and dune forest. The EFZ was broadened to include novel ecosystems such as marinas and harbours adjacent to estuaries as they directly influence estuarine functionality and biodiversity. Where possible, names were changed to provincial standards, e.g., the KwaZulu-Natal (KZN) provincial gazettes and Eastern Cape conservation plan.
Estuarine and provincial inland aquatic datasets, now including inland wetlands and the extent of some large rivers, were merged into a national dataset. The draft NWM5 was checked for overlapping polygon (topology) errors, features aligned along provincial boundaries as well as between inland aquatic ecosystems and estuaries. The total extent (hectares) of all the NWM versions 1 to 5 was updated in ArcGIS and calculated as a percentage of the total of South Africa's extent. Similarly, the surface area of each estuarine and inland aquatic ecosystem type is summarised and the percentage calculated for the total extent of South Africa. These statistics of NWM4 and NWM5 are then reported for the 10 focus areas to highlight the improvements of the digitising efforts.
Determining inundated, arid and palustrine wetland extent for SDG reporting
To determine the extent of inundated wetlands, the seasonal and permanent water and wetland classes from the 30 m National Land Cover data of 2013/14 (GTI, 2015) were extracted. The extent of the inundation was then calculated as a percentage of the extent of all inland wetlands. Subsequently, the remaining extent of the inland wetlands was combined with the LAI predicted using the 463 m spatial resolution MODIS image of 13 March 2013 (Julian Day 73) to indicate potential ranges of vegetation biomass (Cho et al., 2017). A LAI range of 0-1 was used to distinguish low to no vegetation and therefore likely to be arid, whereas a LAI range from 1 to 8 was considered to indicate dense grass to tree cover, and therefore more likely to be palustrine wetlands (Cho, 2018). The total amount of pixels for both processes was extracted using the zonal statistics tool in ArcGIS 10.3 (ESRI, 1999-2014).
Mapping river-estuary ecotones
In addition to the EFZs, the transition zones between the rivers or inland wetlands and estuaries were also mapped as river reaches where riverine abiotic processes dominate, and where riverine and estuarine biota occur (during any time of their hydroperiod). These areas are not subjected to tidal action or back flooding and at no stage experience an increase in salinity as a result of tidal penetration. These river-estuary ecotones are poorly understood and have previously not been delineated, owing to their dynamic nature over long hydrological cycles. River lengths, varying between 0.5 km and 30 km, were defined based on sampling data, topography and expert opinion. The steeper the gradient, the smaller the ecotone. Thus rivers with extensive lowland reaches such as the Breede have longer ecotones. Ephemeral rivers upstream of estuaries were excluded from this delineation. The extent of the river-estuary ecotone was mapped and included in the national rivers database of the NBA 2018 (Smith-Adao et al., 2018).
River-estuary ecotones were identified based on expert knowledge of the occurrences of estuarine-associated fish and invertebrate assemblages. These assemblages within river-estuary ecotones are a mixture of typically estuarine species (e.g. moony Monodactylus falciformis), species adept at completing their entire lifecycle in both habitats (e.g. estuarine roundherring Gilchristella aestuaria), freshwater species that may have an estuarine phase of their life-history (e.g. multi-specific freshwater prawns of the genus Macrobrachium) and catadromous Anguillidae eels and swimming crabs Varuna litterata that are either resident, or migrate through coastal freshwaters whilst recruiting to the upper catchment or migrating back as adults to spawn far offshore in the abyssal depths. Typically estuarine species include, but are not limited to, 'facultative catadromous' fish such as freshwater mullet Pseudomyxus capensis that may opportunistically spend most of their life in freshwater but return to spawn in estuaries or the sea. Supplementary Material I lists systems where these species assemblages have been observed, and hence where river-estuary ecotones exist.
River-estuary ecotones were not incorporated into the EFZ, as they are not subject to estuarine abiotic processes, but they should be highlighted as estuarine supporting areas in planning legislation and approaches to ensure that future developments, or discharges or abstractions, do not disrupt or degrade estuarine connectivity and ultimately condition.
Coastal depressions were refined from Noble and Hemens (1978) using available grey and scientific literature, as well as expert opinion (Van Deventer et al., 2018a). The limnetic status of these systems has been added to the NWM5 database under fields related to the hydroperiod. Other inland wetlands located on sandy coastal plains near the coast or estuarine systems were also attributed as 'coastal' in the NWM5 dataset.
Confidence ranks of the inland wetlands
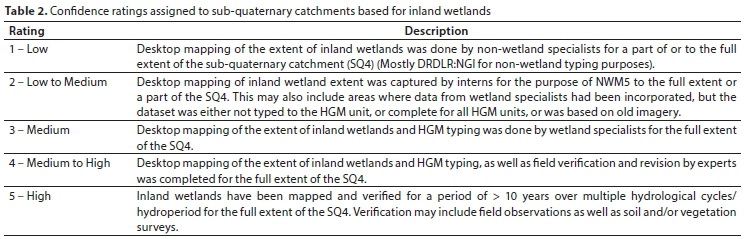
The final step was a confidence map, generated for the inland wetlands based on the extent of a sub-quaternary catchment (SQ4) that was mapped in full, as well as the degree of expertise involved in the wetland mapping, the completeness of the HGM unit and extent to which the hydroperiod is known for a wetland (Table 2). Statistics are reported for the number of SQ4s relative to the total number of SQ4s in South Africa for each of the five ranks, as well as the percentage of surface area of South Africa which is likely to be mapped according to the ranks.
RESULTS
Improvement of the National Wetland Map 5 compared to previous versions
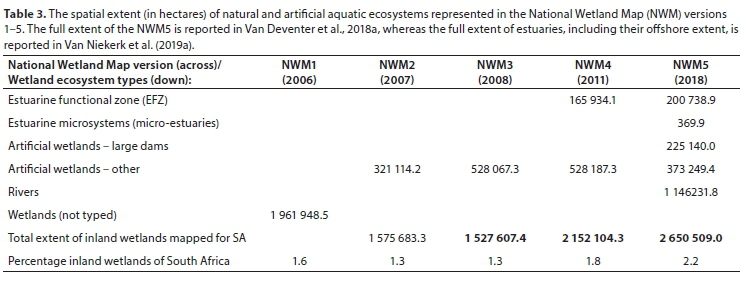
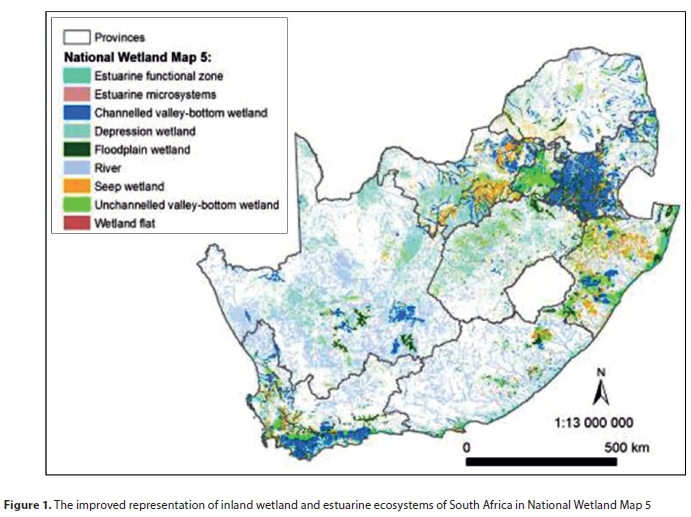
A total of 4 596 509 ha of inland aquatic ecosystems and artificial wetlands has been mapped in South Africa, constituting about 3.8% of the surface area of the country (Table 3; Fig. 1; Supplementary Material II). The extent of South Africa has been calculated as 121 973 563.7 ha using the provincial boundaries of the Municipal Demarcation Board (MDB) of 2011, however the marine reserves have been excluded from the shapefile by the CSIR. Aquatic ecosystems, including estuaries, inland wetlands, and some river channels, totalled 3 998 120 ha (3.3%), while wetlands (inland wetlands and estuaries) totalled 2 851 888 ha (2.3%). The extent of the ecosystems and attributes represented in NWM5 has increased compared with the previous versions of the NWMs (Fig. 3). In addition, the artificial layer has been separated from the inland aquatic data, and now forms part of a collection of datasets in a geodatabase called the South African Inventory of Inland Aquatic Ecosystems (SAIIAE) (Van Deventer et al., 2018a; Van Deventer et al., 2018a,b).

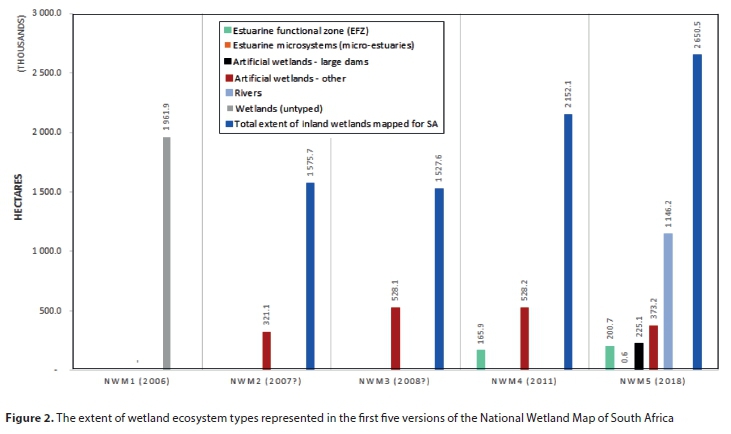
In the NWM5, inland wetlands constituted more than 157 000 polygons, totalling more than 2,6 million ha or 2.2% of South Africa (Table 3). The inland wetlands have increased in extent from NWM4 (NFEPA wetlands of 2011) to NWM5 by 23%; now comprising 2.2% of the surface area of South Africa (Fig. 2). The extent of the 290 EFZs in NWM5, which falls within the boundary of South Africa, increased by 21% from the previous version (from 0.14% to 0.16% of the country's surface area) (Table 3), although this may increase further if the offshore extent (marine transition) is also reported (Harris et al., 2019; Van Niekerk et al., unpublished). Forty-two microsystems (micro-estuaries) have been added in NWM5, which represents 213 ha of estuarine area. The representation of artificial wetlands increased by 13% from 528 187 ha in NWM4 to 598 389 ha in NWM5, making up 0.5% of South Africa's surface area. Artificial wetlands show a minor overlap with natural inland systems of 37 172 ha or 0.03% of SA. Large dams comprise 0.18% of the surface area of the country, and the remaining artificial wetlands 0.3%.
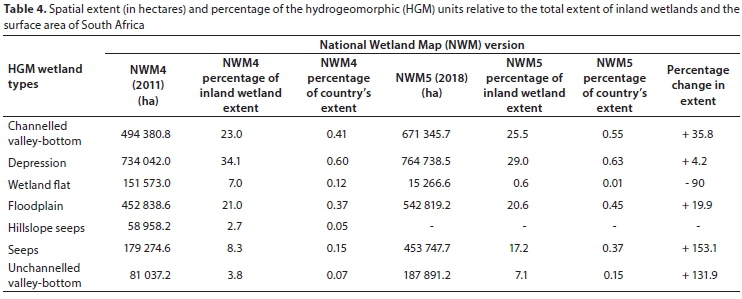
Improvement in the spatial extent of inland wetland ecosystems per HGM type
Depressions were the HGM unit with the highest percentage of representation relative to the surface area of South Africa (764 739 ha; 29% of the extent of inland wetlands), followed by channelled valley-bottom systems (671 346 ha), floodplains (542 819 ha), seeps (453 748 ha) and unchannelled valley-bottom wetlands (187 891 ha) (Table 4). Wetland flats showed the lowest percentage representation (15 267 ha), comprising only 0.6% of the spatial extent of inland wetlands mapped in NWM5, and 0.01% of the extent of the country's surface area. The majority of these are located in the Western Cape Province (80%, results not shown here), with 12% of the wetland flats mapped in the Northern Cape Province, 6% in the north-western parts of the Free State Province, and <2% mapped in the Eastern Cape, KwaZulu-Natal and Limpopo Provinces combined.
When comparing the spatial extent of the HGM units of NWM5 with NWM4, all HGM types showed a marked increase in extent of >20%, except the wetland flats (Table 4; Fig. 3). Wetland flats modelled in NWM4 were corrected to depressions in NWM5 resulting in a marked decrease of 90%. Hillslope seeps have been amalgamated into the seeps category, resulting in a 153% increase in the spatial extent, when comparing the combination of hillslope seeps and seeps of NWM4, to seeps of NWM5 (Fig. 3). When the percentage of HGM units are compared between NWM4 and NWM5, relative to the total extent of inland wetlands mapped, NWM5 mapped more valley-bottom and seep systems (3-9% more in the extent) compared to NWM4. The extent of depressions, wetland flats and floodplains were greater in NWM4 compared to NWM5 (0-6% more in extent). It is interesting to note that floodplain wetlands achieved a similar percentage (21%) of the total spatial extent of inland wetlands.
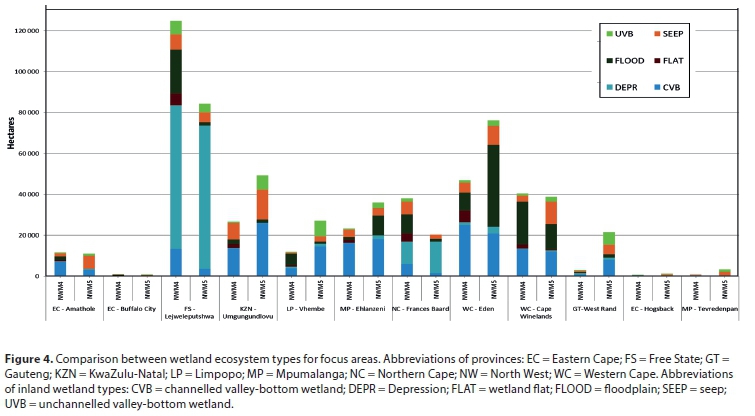
Improvement of the representation of inland wetlands in focus areas
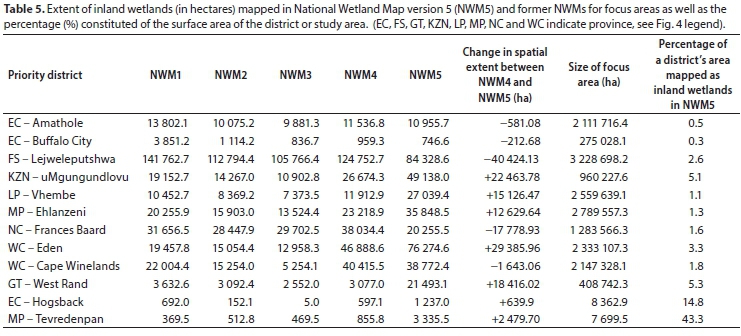
The majority of the 10 focus areas, where wetlands data were integrated and additional wetlands mapped in NWM5 for the NBA 2018, showed an increase in the extent of inland wetlands compared to NWM4 (Table 5; Fig. 4). Five of the ten focus areas (Amathole, Buffalo City, Cape Winelands, Lejweleputshwa, and the Frances Baard municipalities), however, showed a reduction in the extent of inland wetlands. For these areas, commission errors from remote sensing and probability mapping, which had been included in previous versions of the NWM, were removed in NWM5. The four focus areas (Eden, Ehlanzeni, Vhembe, and the West Rand District municipalities) showed increases in the extent of inland wetlands of between 54% and 127%. The West Rand District Municipality achieved the largest increase in extent of nearly 600% compared to NWM4. The extent of inland wetlands for the Hogsback and Tevredenpan study areas increased from the NFEPA (NWM4) wetlands to NWM5 by 107% and 290%, respectively, following in-field visits and corrections (Table 5). The total extent of inland wetlands ranged from <1% to 43% of the surface area of the respective study areas.
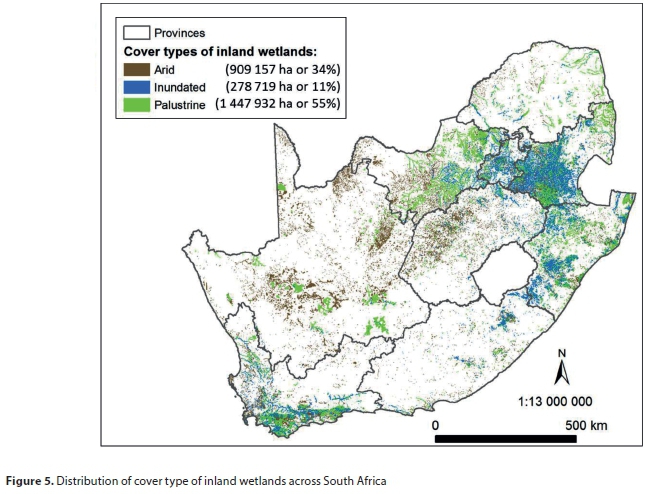
Cover types of inland wetlands (inundated, palustrine or arid) for SDG reporting
Inundated wetlands made up an estimated 278 719 ha or 11% of the extent of South African inland wetlands (Fig. 5) and are distributed across the country. Inland wetlands which are more likely to be vegetated or palustrine (LAI > 1) are found in the Fynbos, Grassland and Savanna Biomes of South Africa, totalling an estimated 1 447 932 ha or 55%. Arid systems are in the central Karoo and Northern Cape Provinces primarily, and a total of 909 157 ha or 34% have been estimated where the LAI < 1.
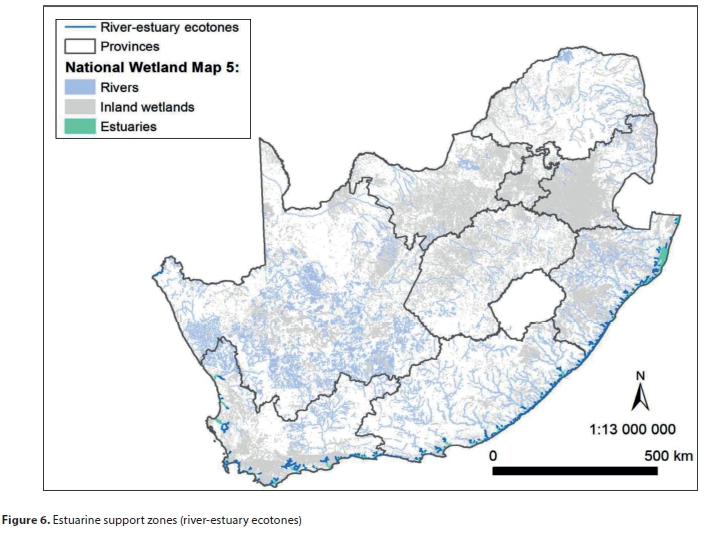
Estuarine support areas (river-estuary ecotones) and coastal depressions
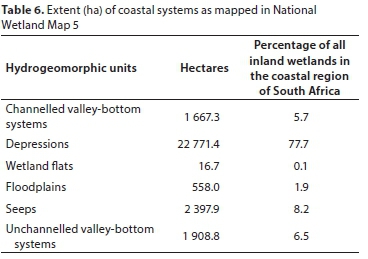
A total of 1 931 km of transition rivers (Fig. 6) have been identified (Supplementary Material I) which constitutes about 1% of the total length (164 018 km) of rivers as identified by Smith-Adao et al. (2018). Almost 30 000 ha of inland wetlands were found to coincide with the coastal regions of South Africa (Table 6). The majority of these are coastal depressions, of which Groenvlei (357 ha) and Lake Sibaya (8 233 ha) were the only limnetic depressions.
Confidence ranking of the inland wetlands of NWM5
Much of the country has been mapped by non-wetland-experts with limited understanding of wetlands with a low confidence overall (76% of country's surface area, Fig. 7, Table 2). Almost 17% of the surface area of the country has been attended to at a desktop level through the integration of existing data and/or the mapping of wetlands by interns trained during the update of NWM5 (representing low-medium confidence). Only 7% of the country has been mapped and typed to HGM units by wetland experts (i.e. medium confidence), and a further 0.04% of the country including site visits and subsequent improvements to the representation (extent and ecosystem typing) of the map. No area has been mapped and refined following long-term research (Category 5 = 0%) (i.e. high confidence).
DISCUSSION
In the past four years, a significant effort has been made to improve the representation of various datasets in the South African Inventory of Inland Aquatic Ecosystems (SAIIAE), particularly the National Wetland Map version 5 (NWM5) in preparation for the National Biodiversity Assessment 2018, and for reporting to international conventions on behalf of South Africa. The effort involved more than 30 data capturers from more than 10 organisations, at a total estimated cost of R7 million (Van Deventer et al., 2018a). The results paid off, in that a total amount of 4 596 509 ha (3.8% of South Africa) of inland aquatic ecosystems and artificial wetlands have been mapped for South Africa. Despite this tremendous effort, the majority of sub-quaternary catchment extents were at a low confidence that the extent and hydrogeomorphic unit have been well represented at a desktop level. Wetlands in arid to semi-arid regions are poorly detected through remote sensing indices, which often use open water indices for extracting wetland extent. As a result, few palustrine and arid systems are well represented in regional to global wetland maps. The extent of wetlands for Africa, for example, has been estimated at 22 440 000 ha or 0.7% of the surface extent of Africa in the Global Lakes and Wetlands Database (GLWD) (Lehner and Döll, 2004). The more recent Global Inundation Extent from Multi-Satellites (GIEMS) dataset (Fluet-Chouinard et al., 2015), at a spatial resolution of 420 x 460 m (total about 19.3 ha per pixel), estimates the extent of wetlands in South Africa at 4.2% of the surface area. It does not, however, distinguish between natural or artificial wetlands, or amongst estuaries, rivers or inland wetlands. Previous wetland maps for South Africa, done using remote sensing and prediction modelling, have proved to underrepresent the full extent of arid and palustrine wetlands. In semi-arid to arid countries, such as South Africa, heads-up digitising and in-field verification are essential to improve our national maps.
The investment made in the NWM5 showed that a significant improvement in the representation of inland wetlands can be achieved. Commission errors associated with the extent of wetlands were removed for some focus areas, resulting in a decrease of the incorrect representation of inland wetlands. Several focus areas, however, showed an increase in the extent of wetlands. During the update of the NWM5, the base data of wetlands for the West Rand District Municipality was combined with the wetlands probability map of Collins (2018), resulting in an increase in extent by nearly 600%; though without in-field verification, the confidence ranges between low and moderate. In-field verification of wetlands by wetland ecologists (Mr Anton Linström and Ms Nancy Job) for the Tevredenpan and Hogsback study areas, resulted in an increase of more than 100% and a moderately high confidence rank (Van Deventer et al., 2019). Investment in similar efforts is therefore crucial for improving the representation of wetland extent to a moderate confidence level. Further improvements should be done for selected priority areas, at catchment levels, particularly in the strategic water source areas (Nel et al., 2017; Le Maitre et al., 2018), areas of high development pressures, and others identified through the NBA 2018 assessment of threatened ecosystems.
Mapped estuarine area increased by almost 5% from the previous version. Some smaller systems moved to the micro-estuaries category and four new small estuaries were mapped and added. However, significant improvements were made in the incorporation of all estuarine and estuarine-associated habitats in the updated delineation. In addition, the dataset now includes 42 micro-estuaries. The use of time-series data vastly improved the mapping of the estuarine extent and allowed for the incorporation of dynamic features such as the river or estuary mouth position. LiDAR data showed significant promise, but unfortunately the datasets were not post-processed adequately, e.g., included the return signal from treetops instead off ground level, to be used without expert judgment. In the future, this type of dataset would benefit from extensive post-processing to increase reliability and assist with increasing mapping accuracies. The incorporation of 1:100 year flood lines allowed for the incorporation of all relevant sediment processes but was unfortunately only limited to two large systems. However, they supported the use of the 5 m contour above mean sea level as a proxy for sedimentary and inundation processes. While the 5 and 10 m above mean sea level contour dataset (DRDLR:NGI, 2017) proved to be useful in supporting the delineation of estuaries in the lower reaches where the floodplain opens up on the coastal plain, it was less useful for delineating the incised, upper reaches correctly, e.g., the Palmiet was delineated a third shorter than the measured extent. The use of expert judgement in combination with a precautionary approach is advisable in delineating the upper reaches of most systems with limited extent. Estuary delineation in South Africa is still largely based on spatial and habitat features, as detailed information on soil moisture, sediment particle size, redox potential, and total organic matter are not available on a national scale. The latter have been used in international approaches on regional-scale delineations and therefore highlight future research requirements (Adam, 1992; Caeiro et al., 2003; Junk et al., 2013).
Although the index on SDG6, 'Ensure availability and sustainable management of water and sanitation for all', requires only the reporting of lakes (the open water) and vegetated wetlands at a national scale, we propose the inclusion of arid systems which are not permanently or seasonally inundated, nor vegetated, as an additional category. The results showed that 11% of South Africa's inland wetlands are inundated and, of the remaining wetlands, 55% could be vegetated and 34% arid. Both the land cover (GTI, 2015) and LAI (Cho et al., 2017) products, at 30 m and 463 m spatial resolution, are unfortunately at a very coarse spatial resolution and considered inadequate to accurately determine the true extent of inundation and vegetation cover of inland wetlands. Closer inspection of sites showed an underrepresentation of the inundated waterbodies and an over-estimation of the vegetated and arid systems. Finer-scale data or in-field verification is therefore required to verify the extent of inundation and vegetation of wetlands, whereas in-field verification of the limnicity of systems is crucial. Time-series analysis should be incorporated to determine the full hydroperiod and phenology of wetlands. These results are therefore only potentially broad-scale indicators of inundation, vegetation, and arid systems for the purpose of reporting at a national scale.
Demarcating the river-estuary ecotones highlights the importance of river reaches just above estuaries and the need to consider their role in maintaining estuary condition. In the past five years, there has been a trend to plan new wastewater discharge points out of estuaries, but in freshwater reaches just above them (i.e. in river-estuary ecotones) to allow for the application of less stringent treatment standards and license agreements applicable to river discharges rather than the more onerous requirements applicable to estuaries as the receiving environments. Benefits of these transition zones include refuge offered to estuarine biota from adverse conditions such as hypersalinity, eutrophication, hypoxia and temperature extremes sometimes experienced in estuarine environments. They are also areas used by estuarine and marine biota to clean themselves of pathogens and parasites that cannot withstand osmotic stress in these transitional freshwater reaches. Fish and invertebrates can also benefit from greater diversity and abundance of grazing and prey that may be unavailable or limited in the adjacent estuarine habitat. Euryhaline species benefit from lower predation levels from stenohaline predators. These river-estuary ecotones also provide extended habitat for euryhaline estuarine and marine species, a function particularly important during low-flow and drought periods when the REI breaks down and/or the estuary may be cut off from the sea. Weirs, impoundments and other instream obstacles in the transition zone may greatly reduce the availability and benefits of this habitat to estuarine-associated species. This includes a reduction in the production and transport of detritus from the ecotone to the estuary downstream. Recruitment of estuarine-associated species will be limited to animals that are able to complete their entire lifecycle in this habitat. Alien and extralimital fish may have a similar impact. Many of these fish are predatory, out-compete their indigenous counterparts and thrive in transitional waters where they can provide an effective barrier to any larval or juvenile fish and invertebrates trying to recruit from downstream. Identifying these ecotones requires that the relevant lead agents, i.e., DWS and DEFF, collaborate more closely on issues within these support areas that can potentially impact on estuaries.
CONCLUSION
A total of 4 596 509 ha (3.8% of South Africa) of inland aquatic ecosystems, including inland wetlands, estuaries and some river channels in the National Wetland Map version 5, and an artificial wetlands data layer, have been mapped as part of the South African Inventory of Inland Aquatic Ecosystems (SAIIAE). The datasets and associated attributes have informed the National Biodiversity Assessment for 2018, as well as the Sustainable Development Goal reporting for Indicator 6 through the Department of Water and Sanitation to the United Nations Environment Programme. Significant effort is required to improve the confidence of the representation of the inland wetlands in the future updates of the National Wetland Map.
ACKNOWLEDGEMENTS
Data sources have been duly acknowledged in the South African Inventory of Inland Aquatic Ecosystems (SAIIAE) Report (Van Deventer et al., 2018a) and journal paper (Van Deventer et al., 2018b). This study was funded by the Parliamentary Grant funding of the CSIR (Project EEEO053), funding allocated by the South African National Biodiversity Institute (SANBI) to the National Biodiversity Assessment for 2018 (NBA 2018) and the Water Research Commission (WRC) under the project WRC K5/2546 'Enabling more responsive policy and decision making in relation to wetlands through improving the quality of spatial wetland data in South Africa', WRC Project No. K5/2187 'Desktop provisional EcoClassification of the temperate estuaries of South Africa' (Van Nierkerk et al., 2015) and WRC Project No. K5/2464. 'A multi-sectoral resource planning platform for South Africa's estuaries' (Van Niekerk et al., 2018).
ICLEI collaborated strongly with SANBI and the CSIR, and funded the mapping and review of the Eden District Municipality in the Western Cape. The mapping of wetlands in the Amathole (EC), Cape Winelands (WC), Ehlanzeni (MP) and Umgungundlovu (KZN) District Municipalities had been funded by the Global Economic Fund 5 (GEF 5). The National Research Foundation (NRF) funded a number of internships to the CSIR. WRC Project K5/2545 titled 'Establishing remote sensing toolkits for monitoring freshwater ecosystems under global change' contributed the updated wetlands data for Hogsback and Tevredenpan study areas.
A number of data capturers have spent months on improving the representation of inland aquatic ecosystem types for districts and provinces. We acknowledge the hard and tedious work of the following people: Ms Millicent Ketelo Dinala (SANBI), Ms Ridhwannah Gangat (CSIR, SANBI), Ms Kedibone Lamula (SANBI), Mr Leolin Qegu (NRF, CSIR & SANBI), Mr Phumlani Zwane (CSIR), Mr Mthobisi Wanda (ICLEI), Mr Gcobani Nzonda (SAEON), Mr Frikan Erwee (SANBI), Ms Carla-Louise Ramjukadh (CSIR), Mr Nhlanganiso Biyela (SANBI), Mr John April (NRF-CSIR), Ms Bongiwe Simka (NRF-CSIR), Ms Sinekhaya Maliwa (NRF-CSIR), Dr Heidi van Deventer (CSIR); Mr Tumisho Ngobela, Ms Kate Snaddon and Mr Dean Ollis from the Freshwater Consultancy Group (FCG) for the integration and improvement of the Cape Winelands District; interns from the Department of Water and Sanitation Directorate: Spatial & Land Information Management (SLIM) under supervision of Ms Carey Rajah for mapping systems in the North-West Province. Dr Mervyn Lötter and Mr Hannes Marais from the Mpumalanga Tourism and Parks Agency (MTPA) are particularly thanked for pulling the wetlands of the Mpumalanga Province together and fixing the data at a desktop level during their review of the province.
We are indebted to other reviews of the inland wetlands mapped, including Dr Brian Colloty (Scherman, Colloty and Associates), Ms Nancy Job (SANBI), Ms Kate Snaddon (FCG) and Dr Nacelle Collins (FS DESTEA). Dr Andrew Skowno has integrated the artificial wetlands and contributed to the improvement and edge-matching of the provinces, whereas Dr Heidi van Deventer corrected the large dams and smaller errors thereafter.
Mr John April has mapped the river-estuary ecotones as listed in Supplementary Material II. Drs Taryn Riddin and Meredith Fernandes, as well as Ms Carla-Louise Ramjukadh, Dr Lara van Niekerk, Ms Fiona McKay and Prof Janine Adams spent hours mapping, reviewing and correcting the estuarine ecosystem types and extent. The KZN Department of Economic Development, Tourism and Environmental Affairs and the Oceanographic Research Institute funded the LiDAR acquisition and data capturers for mapping the KZN EFZs. Dr Stephen Lamberth, Dr Lara van Niekerk and Mr Steven Weerts compiled the list and extent of the river-estuary ecotones which Dr Heidi van Deventer implemented in NWM5. The inland wetlands reference committee has provided guidance through the update of the NWM, including Dr Nacelle Collins (Department of Economic, Small Business Development, Tourism and Environmental Affairs), Mr Dean Ollis (Freshwater Consultancy Group), Ms Nancy Job (SANBI), Dr Mervyn Lötter (Mpumalanga Tourism and Parks Agency), Dr Erwin Sieben (University of KwaZulu-Natal) and Ms Kate Snaddon (Freshwater Consultancy Group). Prof Moses Cho (CSIR) for sharing the LAI dataset and advising on appropriate use.
Lastly, we are grateful to the reviewers who provided comments and suggestions to the improvement of this manuscript.
ORCID
Heidi van Deventer: http://orcid.org/0000-0002-7854-2155
Lara van Niekerk: http://orcid.org/0000-0001-5761-1337
Janine Adams: http://orcid.org/0000-0001-7204-123X
Ridhwannah Gangat: http://orcid.org/0000-0003-3334-5956
Namhla Mbona: http://orcid.org/0000-0001-8760-7857
Jeanne L Nel: http://orcid.org/0000-0001-6220-770X
Andrew Skowno: http://orcid.org/0000-0002-2726-7886
Steven P Weerts: http://orcid.org/0000-0002-9826-3209
REFERENCES
ADAM P (1992) Wetlands and wetland boundaries: problems, expectations, perceptions and reality. Wetlands (Australia) 11 60-67. https://doi.org/10.31646/wa.148 [ Links ]
ADAMS JB, VELDKORNET D and TABOT P (2016) Distribution of macrophyte species and habitats in South African estuaries. S. Afr. J. Bot. 107 5-11. https://doi.org/10.1016/j.sajb.2016.08.001 [ Links ]
CAEIRO S, GOOVAERTS P, PAINHO M and COSTA HM (2003) Delineation of estuarine management areas using multivariate geostatistics: the case of Sado Estuary. Environ. Sci. Technol. 37 4052-4059. https://doi.org/10.1021/es0262075 [ Links ]
CAMERON WM and PRICHARD DW (1963) Estuaries. In: Hill MN (ed.) The Sea, Vol. 2. Wiley-Interscience, New York. 306-324. [ Links ]
CHO MA (2018) Personal communication, 7 September 2018. Prof. Moses Azong Cho, senior researcher, Council for Scientific and Industrial Research (CSIR), P.O. Box 395, Pretoria, 0001, South Africa. [ Links ]
CHO MA, RAMOELO A and DZIBA L (2017) Response of land surface phenology to variation in tree cover during green-up and senescence periods in the semi-arid savanna of Southern Africa. Remote Sens. 9 (7) 689. https://doi.org/10.3390/rs9070689 [ Links ]
COLLINS NB (2018) Chapter 5: Modelling of probable wetland extent. South African Inventory of Inland Aquatic Ecosystems (SAIIAE): Technical Report. FSDESTEA internal report. FSDESTEA, Bloemfontein, South Africa. [ Links ]
DAYARAM A, HARRIS LR, GROBLER BA, VAN DER MERWE S, POWRIE LW, REBELO AG, VLOK JHJ, DESMET PG, QABAQABA M, HLAHANE KM and SKOWNO A (2019) Vegetation Map of South Africa, Lesotho and Swaziland 2018: A description of changes from 2006. Bothalia 49 (1) a2452. https://doi.org/10.4102/abc.v49i1.2452 [ Links ]
DLA:CDSM (Department of Land Affairs: Chief Directorate of Surveys and Mapping, South Africa) (2006) Hydrological polygon and river line shapefiles mapped from the 1:50 000 topographical maps. DLA:CDSM, Cape Town. [ Links ]
DRDLR:NGI (Department of Rural Development and Land Reform: National Geo-Information, South Africa) (2016) Provincial geodatabases of hydrological databases exported from GeoMedia in March 2016. DRDLR:NGI, Cape Town. [ Links ]
DRDLR:NGI (Department of Rural Development and Land Reform: National Geo-Information, South Africa) (2017) Contours at 5 m intervals. DRDLR:NGI, Cape Town. [ Links ]
DI CASTRI F, HANSEN AJ and HOLLAND MM (eds) (1988) A new look at ecotones. emerging international projects on landscape boundaries. Biol. Int. Spec. Iss. 17 1-163. [ Links ]
DRIVER A, SINK KJ, NEL JL, HOLNESS S, VAN NIEKERK L, DANIELS F, JONAS Z, MAJIEDT P, HARRIS L and MAZE K (2012) National Biodiversity Assessment 2011: An Assessment of South Africa's Biodiversity and Ecosystems. Synthesis Report. South African National Biodiversity Institute (SANBI) and Department of Environmental Affairs (DEA), Pretoria. [ Links ]
ESRI (Environmental Systems Research Institute) (1999-2014) ArcGIS version 10.3. ESRI: California, United States of America. [ Links ]
FLUET-CHOUINARD E, LEHNER B, REBELO LM, PAPA F and HAMILTON SK (2015) Development of a global inundation map at high spatial resolution from topographic downscaling of coarse-scale remote sensing data. Remote Sens. Environ. 158 348-361. https://doi.org/10.1016/j.rse.2014.10.015 [ Links ]
GEOTERRAIMAGE (PTY) LTD (GTI) (2015) Technical Report: 2013/2014 South African National Land Cover Dataset version 5. Geoterraimage, Pretoria. 53 pp. [ Links ]
GEOTERRAIMAGE (PTY) LTD (GTI) (2016) South Africa Land Cover Water Feature Splits (1990 - 2013/14). Data Users Report and Meta Data (Version 2). Geoterraimage, Pretoria. [ Links ]
GRUNDLING P, GRUNDLING AT, PRETORIUS L, MULDERS J and MITCHELL S (2017) South African peatlands: ecohydrological characteristics and socio-economic value. WRC Report No. 2346/1/17. Water Research Commission, Pretoria. [ Links ]
HARRIS L, BESSINGER M, DAYARAM A, HOLNESS S, KIRKMAN S, LIVINGSTONE T-C, LOMBARD AT, LÜCK-VOGEL M, PFAFF M, SINK KJ, SKOWNO AL and VAN NIEKERK L (2019) Advancing land-sea integration for ecologically meaningful coastal conservation and management. Biol. Conserv. 237 81-89. https://doi.org/10.1016/j.biocon.2019.06.020 [ Links ]
HILL BJ (1969) The bathymetry and possible origin of Lakes Sibayi, Nhlange and Sifungwe in Zululand (Natal). Trans. R. Soc. S. Afr. 38 205-216.2. https://doi.org/10.1080/00359196909519087 [ Links ]
HOLLAND M, RISSER PG and NAIMAN RJ (eds) (2012) Ecotones: The Role of Landscape Boundaries in the Management and Restoration of Changing Environments. Springer Science & Business Media, New York and London. 142 pages. [ Links ]
JUNK WJ, PIEDADE MTF, LOURIVAL R, WITTMANN F, KANDUS P, LACERDA LD BOZELLI RL, ESTEVES FA, NUNES DA CUNHA C, MALTCHIK L, SCHÖNGART J, SCHEAFFER-NOVELLI Y and AGOSTINHO AA (2013) Brazilian wetlands: their definition, delineation, and classification for research, sustainable management, and protection. Aquat. Conserv. Mar. Freshwater Ecosyst. 24 5-22. https://doi.org/10.1002/aqc.2386 [ Links ]
LEHNER B and DÖLL P (2004) Development and validation of a global database of lakes, reservoirs and wetlands. J. Hydrol. 296 1-22. https://doi.org/10.1016/j.jhydrol.2004.03.028 [ Links ]
LE MAITRE DC, SEYLER H, HOLLAND M, SMITH-ADAO L, NEL JEANNE L, MAHERRY A and WITTHÜSER K (2018) Identification, delineation and importance of the strategic water source areas of South Africa, Lesotho and Swaziland for surface water and groundwater. WRC Report No. TT 754/18. Water Research Commission, Pretoria. [ Links ]
MBONA N, JOB N, SMITH J, NEL J, HOLNESS S, MEMANI S and DINI J (2015) Supporting better decision-making around coal mining in the Mpumalanga Highveld through the development of mapping tools and refinement of spatial data on wetlands. WRC Report No. TT 614/14. Water Research Commission, Pretoria. [ Links ]
MELLY BL, SCHAEL DM, RIVERS-MOORE N and GAMA PT (2016) Mapping ephemeral wetlands: manual digitisation and logistic regression modelling in Nelson Mandela Bay Municipality, South Africa. Wetlands Ecol. Manage. https://doi.org/10.1007/s11273-016-9518-7 [ Links ]
MILLER WR (1998) The bathymetry, sedimentology and seismic stratigraphy of Lake Sibaya - Northern KwaZulu-Natal. M.Sc. thesis, University of Natal, Pietermaritzburg. [ Links ]
NEL JL, MURRAY KM, MAHERRY AM, PETERSEN CP, ROUX DJ, DRIVER A, HILL L, VAN DEVENTER H, FUNKE N, SWARTZ ER, SMITH-ADAO LB, MBONA N, DOWNSBOROUGH L and NIENABER S (2011) Technical Report: National Freshwater Ecosystem Priority Areas Project. WRC Report No. 1801/2/11. Water Research Commission, Pretoria. [ Links ]
NEL JL, ROUX DJ, DRIVER A, HILL L, MAHERRY AC, SNADDON K, PETERSEN CR, SMITH-ADAO LB, VAN DEVENTER H and REYERS B (2016) Knowledge co‐production and boundary work to promote implementation of conservation plans. Conserv. Biol. 30 (1) 176-188. https://doi.org/10.1111/cobi.12560 [ Links ]
NEL JL, LE MAITRE D, ROUX DJ, COLVIN C, SMITH JS, SMITH-ADAO LB, MAHERRY A and SITAS N (2017) Strategic water source areas for urban water security: Making the connection between protecting ecosystems and benefiting from their services. Ecosyst Serv. https://doi.org/10.1016/j.ecoser.2017.07.013 [ Links ]
NOBLE RG and HEMENS J (1978) Inland Water Ecosystems in South Africa - A Review of Research needs. South African National Scientific Programmes Report No. 34. Council for Scientific and Industrial Research (CSIR), Pretoria. [ Links ]
OLLIS DJ, SNADDON CD, JOB NM and MBONA N (2013) Classification System for Wetlands and other Aquatic Ecosystems in South Africa. User Manual: Inland Systems. SANBI Biodiversity Series 22. South African National Biodiversity Institute (SANBI), Pretoria, South Africa. [ Links ]
RSA (Republic of South Africa) (1998a) National Water Act, Act 36 of 1998. Government Printers, Pretoria. [ Links ]
RSA (Republic of South Africa) (1998b) Marine Living Resources Act, Act 18 of 1998. Government Printers, Pretoria. [ Links ]
RSA (Republic of South Africa) (2004) National Environmental Management: Biodiversity Act, Act 10 of 2004. Government Printers, Pretoria. [ Links ]
RSA (Republic of South Africa) (2008) National Environmental Management: Integrated Coastal Management Act, Act 24 of 2008. Government Printers, Pretoria. [ Links ]
RUNDLE SD, ATTRILL MJ and ARSHAD A (1998) Seasonality in macroinvertebrate community composition across a neglected ecological boundary, the freshwater-estuarine transition zone. Aquat. Ecol. 32 (3) 211-216. https://doi.org/10.1023/A:1009934828611 [ Links ]
SMITH-ADAO L, PETERSEN C, NEL J, SILBERBAUER M, SCHERMAN P and GRENFELL M (2018) Chapter 2: Origin, development and improvement of the rivers dataset. South African Inventory of Inland Aquatic Ecosystems (SAIIAE): Technical Report. CSIR report number CSIR/NRE/ECOS/IR/2018/0001/A. URL: http://hdl.handle.net/20.500.12143/5847 [ Links ]
THOMPSON M, MARNEWECK G, BELL S, KOTZE D, MULLER J, COX D and CLARK R (2002) A Methodology Proposed for a South African National Wetland Inventory. Report to John Dini, Wetlands Conservation Programme, Department of Environmental Affairs and Tourism. Council for Scientific and Industrial Research (CSIR): Pretoria, South Africa. [ Links ]
THORP JH (2015) Chapter 4 - Functional Relationships of Freshwater Invertebrates. In: Thorp JH and Rogers DC. (eds) Thorp and Covich's Freshwater Invertebrates (4th edn). Academic Press, Cambridge, Massachusetts. 65-82. https://doi.org/10.1016/B978-0-12-385026-3.00004-8 [ Links ]
UN (United Nations) (2015) Transforming our world: The 2030 agenda for sustainable development. A/Res/70/1. URL: https://sustainabledevelopment.un.org/post2015/transformingourworld/publication (Accessed 22 October 2018). [ Links ]
USAID (United States Agency for International Development) (2018) Local Action for Biodiversity-Wetlands SA: Gap Analysis, Baseline Resource Assessment and High-Level Mapping of Wetlands in the West Rand District Municipality. Unpublished report. USAID, Pretoria. [ Links ]
USGS (United States Geological Survey) (2004) Shuttle Radar Topography Mission, 1 Arc Second data for South Africa. Global Land Cover Facility, University of Maryland, Maryland. [ Links ]
VAN DEVENTER H, NEL JL, MBONA N, JOB N, EWART-SMITH J and MAHERRY A (2016) Desktop classification of inland wetlands for systematic conservation planning in data-scarce countries: mapping wetland ecosystem types, disturbance indices and threatened species associations at country-wide scale. Aquat. Conserv Mar. Freshwater Ecosyst. 26 57-75. https://doi.org/10.1002/aqc.2605 [ Links ]
VAN DEVENTER H, NAIDOO L, CHO MA, JOB NM, LINSTRÖM A, SIEBEN EJ, SNADDON K and GANGAT R (2019) Establishing remote sensing toolkits for monitoring freshwater ecosystems under global change. Final report for WRC Project No. K5/2545, submitted for final reference group meeting on 15 October 2019. Water Research Commission, Pretoria. [ Links ]
VAN DEVENTER H, SMITH-ADAO L, MBONA N, PETERSEN C, SKOWNO A, COLLINS NB, GRENFELL M, JOB N, LÖTTER M, OLLIS D, SCHERMAN P, SIEBEN E and SNADDON K (2018a) South African Inventory of Inland Aquatic Ecosystems. South African National Biodiversity Institute, Pretoria. CSIR report number CSIR/NRE/ECOS/IR/2018/0001/A; SANBI report number http://hdl.handle.net/20.500.12143/5847. [ Links ]
VAN DEVENTER H, SMITH-ADAO L, PETERSEN C, MBONA N, SKOWNO A and NEL JEANNE L (2018b) Review of available data for a South African Inventory of Inland Aquatic Ecosystems (SAIIAE). Water SA 44 (2) 184-199. https://doi.org/10.4314/wsa.v44i2.05 [ Links ]
VAN NIEKERK L, TALJAARD S, ADAMS JB, FUNDISI D, HUIZINGA P, LAMBERTH SJ, MALLORY S, SNOW GC, TURPIE JK, WHITFIELD AK and WOOLDRIDGE TH (2015) Desktop Provisional EcoClassification of the temperate estuaries of South Africa. WRC Report No. 2187/1/15. Water Research Commission, Pretoria. [ Links ]
VAN NIEKERK L, ADAMS JB, BATE GC, FORBES AT, FORBES NT, HUIZINGA P, LAMBERTH SJ, MACKAY CF, PETERSEN C, TALJAARD S, WEERTS SP, WHITFIELD AK and WOOLDRIDGE TH (2013) Country-wide assessment of estuary health: An approach for integrating pressures and ecosystem response in a data limited environment. Estuar. Coast. Shelf Sci. 130 239-251. https://doi.org/10.1016/j.ecss.2013.05.006 [ Links ]
VAN NIEKERK L, TALJAARD S, RAMJUKADH C-L, ADAMS JB, LAMBERTH SJ, WEERTS S, PETERSEN C, AUDOUIN M and MAHERRY A (2018) A multi-sectoral resource planning platform for South Africa's estuaries. WRC Report No. TT 748. Water Research Commission, Pretoria. [ Links ]
VAN NIEKERK L, ADAMS J, FERNANDES M, HARRIS L, LAMBERTH SJ, MACKAY F, PETERSEN C, RAMJUKHAD C-L, RIDDIN T, VAN DEVENTER H and WEERTS S (unpublished) Extending the Estuary Functional Zone to include all processes. [ Links ]
VAN NIEKERK L, ADAMS JB, FERNANDES M, HARRIS, L, LAMBERTH SJ, MACKAY CF, PETERSEN C, RAMJUKHAD C-L, RIDDIN T, VAN DEVENTER H and WEERTS SP (2019a) Chapter 4: Extending the estuary functional zone to include key habitats and processes. In: Van Niekerk L, Adams JB, Lamberth SJ, Mackay F, Taljaard S, Turpie JK, Weerts S and Raimondo DC. South African National Biodiversity Assessment 2018: Technical Report. Volume 3: Estuarine Realm. CSIR Report No. CSIR/SPLA/EM/EXP/2019/0062/A. SANBI Report No. http://hdl.handle.net/20.500.12143/6373. CSIR/South African National Biodiversity Institute, Pretoria. [ Links ]
VAN NIEKERK L, ADAMS JB, JAMES NC, LAMBERTH SJ, MACKAY CF TURPIE JK, RAJKARAN A, WEERTS SP and WHITFIELD AK (in press) An Estuary Ecosystem Classification scheme that accounts for biogeography and a high diversity of estuary types. Afr. J. Aquat. Sci. (in press) [ Links ]
VAN NIEKERK L and TURPIE JK (eds) (2012) National Biodiversity Assessment 2011. Technical Report. Volume 3: Estuary Component. CSIR Report No. CSIR/NRE/ECOS/ER/2011/0045/B. Council for Scientific and Industrial Research, Stellenbosch. [ Links ]
VELDKORNET DA, ADAMS JB and VAN NIEKERK L (2015) Characteristics and landcover of estuarine boundaries: implications for the delineation of the South African estuarine functional zone. Afr. J. Mar. Sci. https://doi.org/10.2989/1814232X.2015.1072111 [ Links ]
WAYWELL T (2009) The effect of various map projections on surface area. PositionIT July 49-55. [ Links ]
 Correspondence:
Heidi van Deventer
HvDeventer@csir.co.za
Received: 6 November 2018
Accepted: 12 December 2019
SUPPLEMENTARY MATERIAL I: https://www.watersa.net/article/view/7887/9771
SUPPLEMENTARY MATERIAL II: https://www.watersa.net/article/view/7887/9772

