


Servicios Personalizados
Articulo
 Inglés (pdf)
 Articulo en XML
 Referencias del artículo
Indicadores

Links relacionados
-
 Citado por Google
 -
 Similares en Google
Compartir

 Permalink
Water SA
versión On-line ISSN 1816-7950
versión impresa ISSN 0378-4738
Water SA vol.46 no.1 Pretoria ene. 2020
http://dx.doi.org/10.17159/wsa/2020.v46.i1.7873
RESEARCH PAPERS
A conceptual index for benchmarking intermittent water supply in a water distribution system zone
Carlo Loubser; Suzanne Esther Basson; Heinz Erasmus Jacobs
Department of Civil Engineering, Stellenbosch University, Private Bag X1, Matieland, 7602, South Africa
ABSTRACT
Various challenges, such as limited freshwater resources, climate change impacts, rapid population growth, urbanisation and underinvestment in water supply infrastructure, have led to intermittent water supply (IWS) in potable water distribution systems. Earlier research has confirmed that IWS negatively impacts the consumers, the infrastructure and the water supply authorities. Water supply authorities need tools to help understand IWS and the associated implications. A new indexing framework involving the causes and impacts associated with IWS is presented in this paper. In addition, a novel approach allows for quantification of the severity of IWS based on knowledge of a few readily available inputs. The severity quantification is based on two ratios: the intermittency ratio is a temporal measurement, accounting for supply duration; the connection ratio describes spatial aspects, using the number of service connections affected. The indexing framework and quantification tool could lead to improved understanding of IWS and could assist water supply authorities faced with IWS to make informed decisions. Improved planning of remedial actions to mitigate or avoid risks associated with IWS is aided. The tools presented in this paper could be used as basis for future development of a key performance indicator.
Keywords: intermittent water supply, index, water scarcity
INTRODUCTION
Growing concerns exist regarding water scarcity, preserving water resources and securing water supply worldwide (Fan et al., 2014). Water scarcity occurs when water resources cannot adequately supply the current and estimated future demand of users (OCHA, 2010). In this text 'water scarcity' is defined as the lack of volumetric abundance of freshwater resources when compared to water demand. Scarcity is thus region-specific and is human induced. Different types of water scarcity have been identified, including physical water scarcity, where resources become insufficient or depleted, and economic water scarcity, where systems are operated poorly due to human, institutional and financial constraints (Molden et al., 2007). As a result, potable water supply may become insufficient, even though adequate raw water is available (Molden et al., 2007).
A simplified illustration of global water scarcity is presented in Fig. 1, that was adopted from World Water Assessment Programme (2012). It was estimated that in 2006 that 1.2 billion people faced physical water scarcity, while 1.6 billion people faced economic water scarcity (Molden et al., 2007). An expected two thirds of the world population may experience water stress by 2025 (United Nations Environment Programme, 2002), although water stress is defined broadly and includes issues relating to water quality and accessibility.
Intermittent water supply
In order to limit water supply and conserve water resources, the practice of intermittent water supply (IWS) is often employed. IWS is a management strategy where water supply in a system, or part thereof, is physically shut off to limit the consumption (Vairavamoorthy et al., 2007). Intermittent supply implies that water is often supplied to consumers for less than 24 h per day. About one third of the population with piped water supply in Africa, more than half in Asia and two thirds in Latin America experience IWS (WHO and UNICEF, 2000).
Klingel (2012) pointed out that a potable water distribution system (WDS) is normally designed for continuous water supply (CWS), although interruptions in supply may occur due to maintenance such as pipe repair or emergencies. These interruptions in a CWS system may lead to periods of non-supply, but such events occur infrequently. The duration and intensity of such interruptions are limited by performance criteria, which vary from country to country (Ghorbanian et al., 2017; Strijdom et al., 2017). A deficiency occurs when the water supply authority is unable to provide the necessary services as measured against the performance criteria (Klingel, 2012). Technical deficiencies can lead to IWS, even though the water resource yield may exceed the demand.
IWS is relatively more common in developing countries where supply problems go hand-in-hand with utilities that are resource-constrained, and with inadequate sanitation infrastructure (Kumpel and Nelson, 2015). Galaitsi et al. (2016) proposed three categories of IWS, namely 'predictable intermittency' (water supply shut-offs generally occur on a predictable schedule), 'irregular intermittency' (intermittent supply at unknown intervals within relative short time periods of no more than a few days), and 'unreliable intermittency' (uncertain delivery times and risk of insufficient water quantity, often leading to consumers requiring behavioural, emotional and physical defences against insufficient water supply).
IWS would typically be implemented in a system to balance water supply and demand within a set of constraints. However, IWS causes various operational and economic problems (Christodoulou and Agathokleous, 2012). Also, IWS leads to a number of negative consequences for the consumer, as well as the WDS infrastructure, which need to be understood and quantified.
Motivation
In any water distribution system (WDS), IWS may be linked to numerous causes including, for example, severe drought, hydraulic capacity problems (Christodoulou and Agathokleous, 2012), or financial constraints (Molden et al., 2007). Galaitsi et al. (2016) performed a critical review of all potential causal-consequential pathways associated with IWS and highlighted a notable increase in publications addressing IWS over the final years in their dataset, suggesting that research into IWS is increasingly relevant. Water supply authorities faced with IWS need to understand the numerous causes and the associated impacts. An improved understanding of technical aspects related to IWS should assist water supply authorities and water services planners to make informed decisions on possible implementation of IWS, improving service delivery where IWS already occurs, and improved planning of remedial action to mitigate and avoid risks associated with IWS. Moreover, despite the available research on IWS, a need remains to better quantify the extent of IWS in a WDS, or part thereof, based on measurable parameters.
METHODOLOGY
This project involved exploratory research on IWS through a knowledge review, focusing on the hydraulic principles associated with IWS in a WDS. The research addressed two facets related to IWS, namely, understanding the problem (theoretical framework) and quantifying the problem (index calculation). A novel and robust indexing framework for IWS was derived as a tool for further development and future implementation, based on an analysis of the causes and impacts of IWS in a water distribution zone. A quantification tool is developed to crudely assess the level of IWS with limited input data, which is especially useful in developing countries where measurable quantifiable parameters may be lacking. The quantifiable parameters associated with IWS were first identified, followed by an evaluation of typical data availability. Three of the most fundamental parameters were integrated to portray the severity of IWS in mathematical terms as a single index number.
Research scope
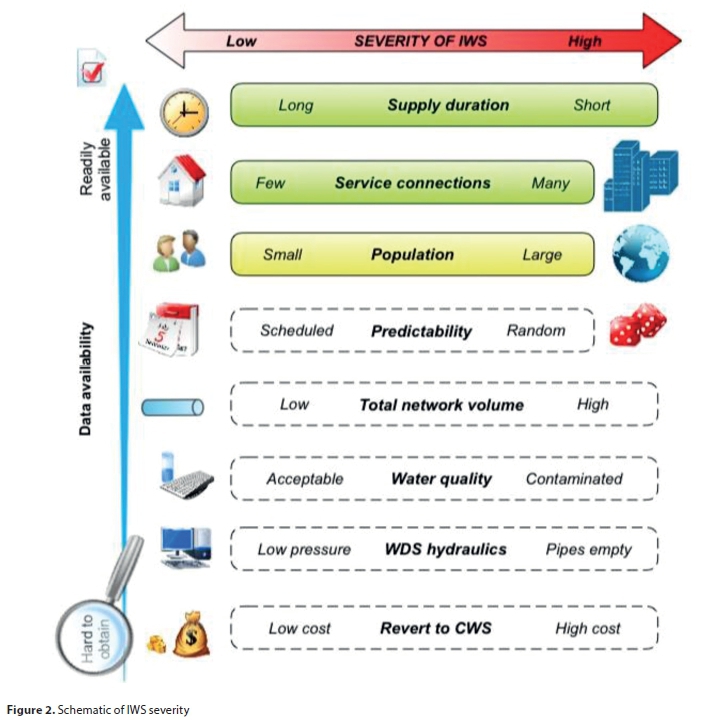
The term severity is used loosely in this text with the meaning recorded in the English dictionary, 'a condition of being severe', referring generally to something undesirable. Development of the IWS index framework was limited by a number of assumptions introduced to simplify the problem and present complex variables (e.g. pressure violations at nodes in a WDS) as being discrete (e.g. insufficient pressure in the system). This simplification of parameters was needed to consider which aspects would be linked to a 'more severe' state of IWS versus a 'less severe' state, as depicted schematically in Fig. 2.
The research focused on the development of a robust index - ideally a single number or combination of relative numbers - that could be used to crudely assess the level of IWS in a WDS zone. Developing countries are often faced with the challenge of limited knowledge of a system undergoing IWS and a lack of measured, or quantifiable, parameters. The IWS index presented in this paper addresses the need to benchmark systems where available technical information regarding the system may be limited.
IWS always involves limited supply duration and an impact on a number of service connections, per definition. These parameters are shaded green in Fig. 2. It is highly unlikely that IWS would not also impact a number of people, but it is theoretically possible that IWS is implemented exclusively in a fully automated industrial zone, for example. The unshaded parameters do not relate to the fundamental definition of IWS and may not necessarily occur.
This study focuses on potable urban water supply, i.e., water intermittency affecting typical urban consumers. Water supply to agricultural and relatively large industrial consumers is excluded. It was also assumed that the WDS in question was originally designed for CWS, with the level of service deteriorating to IWS over time.
The boundary conditions that are not considered in the indexing framework as causes include:
•Institutional boundary conditions, including factors such as politics, policies, legislation, the organisational structure of the water supply authority and government corruption or power structures that prioritise privilege, i.e., hierarchy in water distribution to different socio-economic groups
•Technical boundary conditions, such as dependency on infrastructure systems that provide construction materials and electricity
•Consumers being disconnected due to non-payment as part of a management strategy
Development of indexing framework
Causes of IWS
A notable cause of IWS is increased demand - to a level beyond what could be supplied from the WDS (Gleick and Palaniappan, 2010). Urban water demand is driven by population growth, with global population expected to rise steadily (UN Department of Economic and Social Affairs/Population Division, 2017). Developing countries have a relatively higher growth rate (Vörösmarty et al., 2000). Urbanisation leads to higher population densities and thus increased demand on the relevant urban WDS. In developing countries with poor living conditions and sanitation, a lack of water may increase the health risks and reduce the labour source, which directly influences the area's economic welfare (UNESCO, 2003).
Studies conclude that climate change impacts the hydrological cycle and contributes to an increase in severe drought and flood events, as well as redistributed rainfall patterns (Pathirana et al., 2007). Additional evidence of climate change is presented by the occurrence of sea level rise (Church and White, 2006), melting arctic sea ice (Kwok and Rothrock, 2009) and an increase in extreme weather events (Van Aalst, 2006). These impacts on surface water collection and storage may contribute to water scarcity and ultimately to IWS, especially for systems that rely on surface water as primary resource.
A water resource is replenished with renewable water each year, for example through rainfall. If the rate of water consumption exceeds the natural renewal rate, the resource exceeds the natural maximum yield and becomes a non-renewable resource (Gleick and Palaniappan, 2010). When limits to water availability in a region are reached, alternatives for water supply are investigated, such as bulk imports of water and desalination (Gleick and Palaniappan, 2010). The utilisation of these alternatives is often limited by financial constraints, as well as locality constraints.
Water consumption varies by season (Andey and Kelkar, 2009), resulting in an inflated peak water demand. Demand also varies diurnally, with a higher demand in the morning and evening than in the afternoon (Andey and Kelkar, 2009). Tourist towns and sea resorts may experience peak tourist seasons, which could lead to drastic increases in the peak water demand (Trifunovic, 2008). If the bulk water resources and distribution networks are not sized adequately to cater for temporal variations due to tourist influx, the water services provider may need to implement IWS.
Social behaviour affects water demand. A person's behaviour is related to lifestyle choice, which influences water consumption. The extent of consumer awareness and attitude towards the environment and water conservation affects water consumption (Willis et al., 2011). Research also shows that household income is positively correlated to demand (Alcamo et al., 2007), suggesting that an increased level of service and increased standard of living - without infrastructure upgrades - may result in IWS. Real water loss in a WDS also increases the total system input volume above what is actually needed. Similarly, apparent losses contribute to water scarcity and increased likelihood of IWS in terms of the supply-demand imbalance and financial constraints.
Developing countries often lack proper system planning (Klingel, 2010). Designers should consider the present water demand and include factors such as population growth and urbanisation (McIntosh, 2003). Without proper planning, systems operate inefficiently and are more prone to technical deficiencies and IWS. Planning and management require data. Data are required for asset management and system maintenance, as well as determining the hydraulic behaviour of the system. A lack of data could ultimately cause IWS. Another concern is the scarcity of qualified technical staff in water supply authorities. A census of the 231 local municipalities in South Africa confirmed the lack of competent technical staff (Lawless, 2005). Without adequate technical staff, water supply authorities often fail to recognise the importance of data management and planning and could neglect this responsibility. Technical staff are also required to avoid technical deficiencies. Without adequate system knowledge and data, it becomes difficult to manage a system and prevent IWS.
Financial constraints could prevent the necessary provision of operation and maintenance funding. Limited capital budgets may also prevent the expansion and improvement of infrastructure. Ilaya-Ayza et al. (2016) proposed a method to expand network capacity through a greedy algorithm, in areas where limited capital budgets may be prevalent. The drivers of the financial constraints may vary greatly between water supply authorities; however, low cost recovery is a well-known cause. McKenzie and Ray (2004) stated that low cost recovery can originate from overstaffing municipalities, under-pricing water, unaccounted for water and non-payment.
Impacts of IWS
A number of adverse impacts have been linked to IWS. These factors are often interrelated, and one could exacerbate the other. Factors related to IWS, such as short supply periods, unequal distribution of water and unreliable delivery timings may lead to inadequate water supply that will adversely impact health, well-being and livelihoods of consumers (Howard and Bartram, 2003). Ameyaw et al. (2013) proposed a simple multi-objective optimization model to improve equity of supply, while Gottipati and Nanduri (2014) developed an index, namely the uniformity coefficient, to measure the equity of distribution in IWS networks.
Inequitable supply may compel consumers to make on-site provision for the periods without water supply. Common provisional entities include in-house storage tanks, private pumps for extraction and secondary sources of water, such as private water sources, supply from a tank car and purchased bottled water (McIntosh, 2003). Nel et al. (2017) discussed various supplementary household water sources used in South Africa to augment potable municipal supply. Private water extraction, often of poor quality, may negatively affect the water resource and quality in the WDS. Microbial regrowth is also enhanced by higher temperatures, such as are introduced when household storage tanks are unprotected against the sun (Klingel, 2010).
Another problem may occur when all consumers located near the inflow of a supply network extract water simultaneously, for example after a period of no-supply. This leads to reduced pressures in the WDS and upon charge-up, the system recharge rate is reduced. If the supply duration is too short it can lead to unequal supplies and even unsupplied areas (Kumpel and Nelson, 2015). Low pressures in the system increase the risk of high elevation points without water supply. In IWS systems, surge pressure is often an additional cause of unequal water distribution (Freni et al., 2014). In addition, factors such as stagnation zones and intrusive contaminant sources at different times and locations can lead to different water quality conditions in the WDS (Klingel, 2012).
A water supply system primarily provides potable water for domestic purposes, but it is also required in certain countries to supply water for firefighting. In these countries, the traditional approach to firefighting is to extinguish a fire with water from a pre-filled tanker vehicle, followed by using fire hydrants connected to water supply systems to extract more fire water (Myburgh and Jacobs, 2014). Firefighting becomes a serious problem when IWS is implemented, as water supply is not readily available and may not meet the minimum required fire flow.
One of the fundamental water supply requirements is water of acceptable quality. Biological, chemical and physical mechanisms in water supply can lead to water quality degradation. Microbial contamination is a common cause of illness in developing countries. Pathogens described as disease-causing micro-organisms lead to waterborne diseases, which cause up to 3.4 million deaths annually (Vestergaard, 2014). The main mechanisms of water quality degradation introduced or aggravated by IWS are intrusion and backflow, stagnation of water, and flushing (Kumpel and Nelson, 2015).
Another contributing factor to reducing pressure in pipes is a high consumer demand. In a CWS system consumers will draw water when needed, but because IWS systems supply for limited periods, consumers draw their total water demand over a short time span (Kumpel and Nelson, 2015), thus potentially increasing the peak demand. Pressure transients occur more frequently in IWS systems (Gullick et al., 2004). In IWS systems, water charge-up and charge-down lead to regular and undesirable pressure fluctuations, adding to pipe fatigue. During IWS, the exposure of interior pipe walls to air during off periods can increase corrosion. Consequently, pathways for contamination in the supply system can form more easily (Kumpel and Nelson, 2015). One of the main contaminant sources of drinking water is wastewater. IWS is often found at locations where formal sewage pipe networks are absent (Abu Amr and Yassin, 2008). Wastewater could ingress the WDS from storm drains in close proximity of drinking water systems, especially under low pressure conditions.
Kumpel and Nelson (2015) highlight the following aspects that also negatively affect the water supplied to consumers, or negatively impact the WDS in one way or the other: highly variable residence time, low concentration of disinfectant residuals, higher micro-organism and turbidity concentrations, iron and manganese intrusion and dislodged biofilms. Problems relating to intrusion of chemicals from agricultural runoff and industrial effluents have also been reported (McKenzie and Ray, 2004). Contaminants also affect the physical appearance and other physical attributes of the water, such as the colour, turbidity, taste and odour (DWAF, 2005).
Management and reduction of water losses is complicated under IWS. When a supply system does not sustain continuous flow under pressure, important measuring methods for water losses and detection of leakages cannot be applied (Klingel, 2012). The practice of charge-up and charge-down in IWS can damage water meters and air pockets in IWS systems may cause incorrect water flow readings (Criminisi et al., 2009). Consumers who receive unequitable supply may feel compelled to extract water via illegal connections, in order to assure water security (Klingel, 2012). Wastage of water by the consumer exacerbates general water losses. Consumer storage tanks often overflow or are emptied prior to supply periods to provide space for fresh water, with poor management of private tanks having a noticeable impact on water wastage (McIntosh, 2003).
IWS negatively impacts household cash flow. IWS can have direct and indirect impacts on the consumer's financial circumstances, as consumers feel the need to make additional provision for water supply. The purchase of private pumps and in-house tanks are common in IWS areas, which lead to additional capital and energy expenses by the consumer. Consumers also rely on relatively expensive supplementary potable water sources such as bottled water or dehumidifiers (Nel et al., 2017). Another example of indirect costs is related to the treatment of water-borne diseases and the loss of income as consequence thereof (Klingel, 2012).
The impacts listed above can significantly increase operational costs, which create economic problems for the water supply authorities (Christodoulou and Agathokleous, 2012). Fundamentally, IWS is implemented to reduce water demand per capita in areas suffering from water scarcity. It therefore follows logically that revenue generated through water sales by the water supply authority will generally be lower in areas where IWS is implemented.
RESULTS
Integrating causes and impacts into an indexing framework
In order to simplify the framework, infrequent events of intermittency were not considered for the indexing system. Events such as pipe breaks and related repair as well as scheduled maintenance were thus excluded. The framework was confined to any WDS zone where IWS was implemented as part of a management strategy, say by closing off an isolation valve at the outlet of a reservoir, or at a number of locations in the WDS.
Each cause of IWS presented in the indexing framework is restricted by boundary conditions. The causes could be linked to physical water scarcity and deficient service provision. The impacts of IWS include impacts on the consumer (the user) and on the water supply authority (the system).
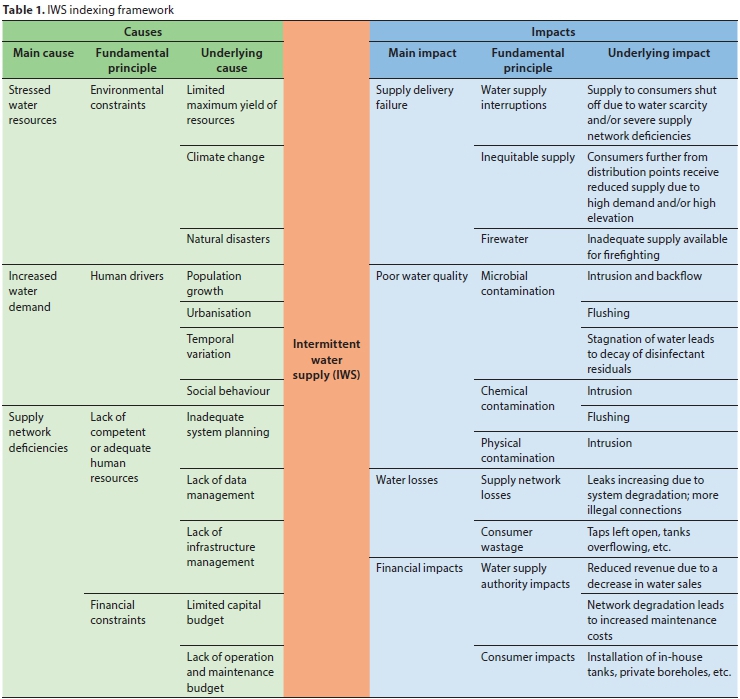
Various alternatives were considered as the basis for the indexing framework, such as a risk assessment matrix, relations diagram or tree diagram. After evaluation of the characteristics, advantages and disadvantages of the various options, the indexing framework was developed as a special type of relations diagram. The causes and impacts of IWS were organised logically and assembled as illustrated in Table 1. It should be kept in mind that IWS was earlier defined as a formal supply strategy, thus excluding causes and impacts due to ad hoc unplanned events (e.g., power failures, lack of coordination among utility employees).
The indexing framework was divided into two pillars to separately address causes and impacts. The left pillar comprises a description of the causes of IWS, while the right-hand pillar comprises a description of the impacts of IWS. Each pillar was sub-divided into three levels, namely: main cause or impact, fundamental principle and underlying cause or impact. The main causes and impacts refer to the key topics of IWS gained from the literature review, with the aim of ultimately reaching quantifiable parameters. The fundamental principles provide a broad overview of the origin of the main causes and main impacts of IWS. Water scarcity was divided into two components relating to the supply-demand imbalance, namely: stressed water resources and increased water demand. Stressed water resources largely refer to environmental constraints that decrease water availability, such as the limited resource yield, impacts of climate change and natural disasters. Natural disasters may refer, for example, to droughts, floods, or earthquakes. Increased water demand is a function of other parameters such as population growth, urbanisation, changed temporal variation and social behaviour.
System deficiencies also contribute to IWS. In such events, water supply authorities are unable to provide the necessary services. System deficiencies include inadequate water storage to attenuate fluctuating demand. In addition, system deficiencies refer to water treatment plants that do not meet the required capacity to provide the water demand. Moreover, system deficiencies also refer to possible system failure, for example, due to inadequate source capacity or an overreliance on one water source, which may become depleted. In this case, lack of planning for augmentation for sufficient volume in the sources, or alternative sources, are the underlying reasons. Reasons for supply network deficiencies may also include the lack of competent or adequate human resources to ensure sufficient system planning, as well as appropriate data and infrastructure management. Lastly, deficiencies may be the cause of limited financial resources to adapt or expand the hydraulic capacity of the system, and to provide the required operational and maintenance costs.
With regard to the impacts, the following are relevant with reference to Table 1. Supply delivery failure refers to insufficient water quantity supply to consumers, due to water supply interruptions. Quantity refers to the volume of water that is supplied, including inequitable supply to consumers located further from the distribution point, or at relatively higher elevations in the WDS zone. The system may also be unable to meet the minimum requirement for firefighting.
Another impact of IWS is the decreased quality of water, which is the result of microbial, chemical and physical contamination. Water losses can be a result of consumer wastage as well as leakages and illegal connections in the supply system. Lastly, the consumer and water supply authority can both experience financial impacts due to the practice of IWS.
Several causal-consequential pathways in the analysis of several specific cases of IWS have been identified by Galaitsi et al. (2016), where it is noted that causes can become impacts and vice versa. This study confirms that IWS is likely to result from a combination of causal factors - it is unlikely that IWS in a system would be linked exclusively to one cause. A good example is the occurrence of a drought in a large urban area, where supply is predominantly dependent on surface water. The situation may be exacerbated by urbanisation, population growth and inadequate system planning, in that the water supply authority fails to develop alternative resources in time to prevent IWS. The 2015-2017 drought experienced by the City of Cape Town, South Africa, is such an example (Johnstone, 2017), although IWS was avoided in that case with a limited number of days to spare before introduction of IWS.
Similarly, the impacts of IWS seldom occur in isolation. For example, when water supply becomes unreliable, consumers may revert to on-site solutions such as storage tanks. These, concomitant with increased illegal connections and non-payment, may lead to increased water losses and financial implications to both service provider and consumer. Despite these complex interactions, a number of assumptions were made as part of this research to present a framework and illustrate how a measurable quantity could be conceptualised to ascertain the severity of IWS in a WDS zone.
Quantification of IWS
Relevant parameters for quantifying IWS
The indexing framework presented in Table 1 provides a tool to better understand the causes and impacts of a specific case of IWS, but quantification of the severity remains lacking. Quantifying the severity is important as it reflects the level of adverse impacts. In order to determine the severity of IWS, an expression or measurement of its quantum is required. The first step was to identify the relevant parameters required to quantify IWS, which entails the measurement of supply delivery failure. The scope of an analysis could be limited to the supply boundaries of a single water supply area, or WDS zone. The parameters that could potentially be used to quantify IWS are listed in Table 2. The list includes all notable parameters identified during the knowledge review, but is not claimed to be comprehensive. Two challenges are immediately apparent: how would the parameters be quantified and, secondly, how would a single index value (future key performance indicator) be derived? Many of the parameters listed in Table 2 are not easily quantified, especially for systems experiencing IWS in developing countries, where the required data from which the values would be lifted are absent, or limited. A number of simplifications and assumptions were thus introduced to arrive at a conceptual index value.

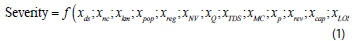
Consider for a moment a conceptual value for severity that would incorporate all the parameters listed in Table 2. If the supply duration per cycle was known, a relative fraction (say x) for supply duration could be found easily. If Ids = 12 h (12 h supply cycle) then xds = 0.5. Ideally all parameters would be expressed as relative fractions in this manner, allowing for simple derivation of a combined index number. However, all parameters cannot easily be described as relative fractions. One concept, illustrated shortly, would be to set the upper value for the denominator equal to a relatively large published value for the particular parameter. Assume for the moment that each of the n parameters in Table 2 could be presented as a quantifiable measure in dimensionless form, then severity could be expressed as:
The challenge of quantifying all the parameters and presenting a relative fraction in each case was considered insurmountable given current constraints and could be the focus of future research. However, the problem was simplified by selecting only certain parameters in order to illustrate the conceptual development of an IWS index value. The obvious simplification would be to focus on the parameters which are expected to be quantifiable, with available data from systems under conditions of IWS. The following parameters were selected for further analysis:
•Supply duration
•Number of serviced connections affected by IWS
•Population number in WSA or supply zone
The severity of IWS is expressed using two ratios. The first ratio considers the duration of supply cycles and the duration between supply cycles. The ratio also takes into consideration the duration of supply-off periods when it exceeds 24 h, or even 1 week (168 h). The duration of the water supply cycle is an indication of the water volume supplied, as the supply volume (m3) is a function of flow rate (m3/s) and time (s). The first ratio is named the Intermittency Ratio (IR) and its value ranges from 0 to 1. Zero implies there is continuous water supply 24 h per day for 7 days per week, and 1 implies there is no supply during 1 week. The ratio is formulated in Eq. 2:

For areas receiving intermittent water supply via cycles exceeding 1 week, the Intermittency Ratio (IR) is formulated in Eq. 3:

The second ratio considers the portion of the service connections in the water supply authority that is affected by IWS. It is named the Connection Ratio (CR) and its value ranges from 0 to 1. Zero implies that no connections are affected by IWS, therefore there is no IWS in the system. One implies that all connections in the water supply authority experiences IWS. The ratio is formulated in Eq. 4:

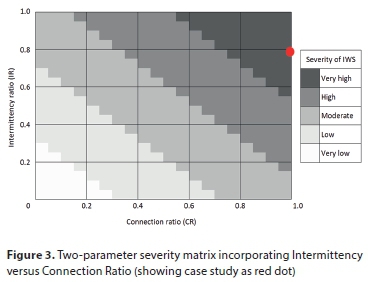
Hence, the first two identified parameters for quantifying IWS are included in the formulated ratios. Following this, the resultant effect of both ratios was explored, as the severity of IWS is interdependent on both ratios simultaneously. A matrix was developed, which indicates that the simultaneous increase of both ratios will increase the severity of IWS within a single water supply authority. The IWS severity matrix based on these two parameters is presented in Fig. 3. The case study data point is included, as discussed shortly.
The severity of IWS was further simplified by creating an integrated index that combines the two ratios above. The index uses the average value between the two ratios and will result in a value between 0 and 1. This method of combining ratios is supported by other research papers (Shamir and Howard, 1981; Maglionico and Ugarelli, 2002). In the instance of Maglionico and Ugarelli (2002), for example, various reliability indicators in a water supply system were combined in this manner. The combined index for this research is named the IWS Index and is calculated using Eq. 5.

In addition to the IWS Index, the severity of IWS will also vary according to the population size in the water supply authority. The severity matrix could be extended to include a third parameter. Clearly, a city with a population of several million constitutes a far bigger challenge when managing IWS, than a small town with a population of a few hundred. Moreover, to convert a large area impacted on by IWS back to CWS, would generally be considerably more costly than to convert a small area to CWS. To this end, Ilaya-Ayza et al. (2018) proposed a sector by sector transition back to CWS based on a multi-criteria optimization technique. The population size, therefore, serves as an additional measurement to determine the severity of IWS.
A literature study was conducted to determine population sizes in towns and cities affected by IWS. A summary of the literature review outcomes is presented in Table 3.

Based on a literature study of some of the towns and cities in the world where IWS is implemented, it was decided to categorise different population sizes within a water supply authority, as seen in Table 4. A logarithmic scale was chosen to present the researched city populations in a logical manner.

In order to incorporate the population size within a water supply authority (WSA) or water supply zone, the severity matrix was extended to allow for three parameters, as presented in Fig. 4. The case study data point is included, as discussed shortly.

Case study - application of severity index
Intermittent water supply was investigated in a case study town. The case study town is located in Mpumalanga Province, South Africa. The population of the town is approximately 66 000 and water to the entire town is supplied intermittently. The case study town is divided into three separate sections, namely A, B and C. At the time of the study, A and C received 8 h of supply every day - 4 h in the morning and 4 h in the afternoon. B was on a different supply cycle, and received about 3 h of supply every 2 to 3 days.
Because of the variance in supply duration in the case study town, the intermittency ratio was calculated using weighted averages, by virtue of the number of developed land parcels in A, B and C. Through this approach, the intermittency ratio was found to be 0.79. Because the entire town receives IWS, the connection ratio is 1.00. The intermittency ratio of 0.79 and the connection ratio of 1.00 yielded an IWS index of 0.89. The case study data point is plotted with a red dot on the two-parameter severity matrix in Fig. 3, and is clearly indicative of IWS of 'Very high' severity. This is considered appropriate, given the fact the entire town is affected by IWS, and the supply duration is low.
With the total population of the case study town estimated at 66 000, the data point was then plotted with a black dot on the three-parameter severity index in Fig. 4. The severity index value plots in the 'High' purple band. The addition of the population number, in order to move from the two-parameter to the three-parameter severity index, caused the severity index to reduce from 'Very high' to 'High'. This ads credibility to the index, and underlines the fact that higher population numbers experiencing IWS constitute a bigger challenge.
The population of the case study town is 66 000, which is considered relatively low compared to some of the larger cities listed in Table 3. The IWS index of 0.89, however, is significant. Reverting to CWS would most likely be a costly and complicated exercise and, based on that, a strong case can be made for the case study IWS to be of 'High' severity.
CONCLUSION
Given current constraints and available data, a new indexing framework for IWS is presented in this paper. The framework allows for visual and simplistic identification and presentation of the causes and impacts of IWS in a specific water distribution system. The process of compiling the framework and calculating the index values provides a road map, potentially assisting with planning of remedial action. The knowledge gained through this process could help planners to mitigate and avoid risks associated with IWS.
The novel approach presented in this paper allows for IWS to be quantified, using readily available input parameters. The IWS index values theoretically vary between 0 (low severity) and 1.0 (high severity) based on the boundary conditions selected during this study. The IWS index is a useful benchmarking tool and could be used to compare cases of IWS in a robust manner. The quantification tool could form the basis of a future key performance indicator for measuring the severity of IWS.
In order to calculate the indices presented, information on the supply duration, number of connections affected by IWS, and the population of the area under investigation has to be known. As was presented for the case study, if the supply duration varies in the study area, a weighted averages method has to be applied to calculate the average hours of supply for the area. In addition, the number of connections affected by IWS may not be readily available in some study areas. Moreover, the indices presented cannot be used directly to solve real engineering challenges, such as IWS. This, however, is an inherent disadvantage of any indexing system.
The framework and severity calculation procedures are presented in this paper as concepts. These concepts could be adjusted in future to allow for hitherto unknown scenarios, along with adjustment of the parameter boundaries to calibrate the index to actual systems. As part of ongoing research, additional data are being collected through field work, which will form the basis of future application and calibration.
REFERENCES
ABU AMR S and YASSIN M (2008) Microbial contamination of the drinking water distribution system and its impact on human health in Khan Yunis Governorate, Gaza Strip: Seven years of monitoring (2000-2006). Public Health 122 1275-1283. https://doi.org/10.1016/j.puhe.2008.02.009 [ Links ]
ALCAMO J, FLORKE M and MARKER, M (2007) Future long-term changes in global water resources driven by socio-economic and climatic changes. Hydrol. Sci. J. 52 (2) 247-275. https://doi.org/10.1623/hysj.52.2.247 [ Links ]
AMEYAW E, MEMON F and BICIK J (2013) Improving equity in intermittent water supply systems. J. Water Suppl. Res. Technol. 62 (8) 552-562. https://doi.org/10.2166/aqua.2013.065 [ Links ]
ANDEY SP and KELKAR PS (2009) Influence of Intermittent and Continuous Modes of Water Supply on Domestic Water Consumption. Water Resour. Manage. 23 (12) 2555-2566. https://doi.org/10.1007/s11269-008-9396-8 [ Links ]
ASIAN DEVELOPMENT BANK (1993) Water utilities data book: Asian and Pacific region. Asian Development Bank, Manila. [ Links ]
CHRISTODOULOU S and AGATHOKLEOUS A (2012) A study on the effects of intermittent water supply on the vulnerability of urban water dirstribution networks. Water Sci. Technol. 12.4 523-530. https://doi.org/10.2166/ws.2012.025 [ Links ]
CHURCH J and WHITE N (2006) A 20th century acceleration in global sea level rise. Geophys. Res. Lett. 33 L01602 1-4. https://doi.org/10.1029/2005GL024826 [ Links ]
COELHO ST, JAMES S, SUNNA N, ABU JAISH A and CHATILA J (2003) Controlling water quality in intermittent supply systems. Water Sci. Technol. Water Suppl. 3 (1-2) 119-125. https://doi.org/10.2166/ws.2003.0094 [ Links ]
CRIMINISI A, FONTANAZZA C, FRENI G and LOGGIA G (2009) Evaluation of the apparent losses caused by water meter underregistration in intermittent water supply. Water Sci. Technol. 60 2373-2382. https://doi.org/10.2166/wst.2009.423 [ Links ]
ERICKSON J, SMITH CD, GOODRIDGE A and NELSON K (2017) Water quality effects of intermittent supply in Arraijan, Panama. Water Res. 114 338-350. https://doi.org/10.1016/j.watres.2017.02.009 [ Links ]
FAN L, LIU G, WANG F, RITSEMA CJ and GEISSEN V (2014) Domestic Water Consumption under Intermittent and Continuous Modes of Water Supply. Water Resour. Manage. 28 (3) 853-865. https://doi.org/10.1007/s11269-014-0520-7 [ Links ]
FRENI G, DE MARCHIS M and NAPOLI E (2014) Implementation of pressure reduction valves in a dynamic water distribution numerical model to control the inequality in water supply. J. Hyrdoinf. 16 (1) 207-217. https://doi.org/10.2166/hydro.2013.032 [ Links ]
GALAITSI S, RUSSELL R, BISHARA A, DURANT JL, BOGLE J and HUBER-LEE A (2016) Intermittent domestic water supply: A critical review and analysis of causal-consequential pathways. Water 8 (274) 1-25. https://doi.org/10.3390/w8070274 [ Links ]
GHORBANIAN V, KARNEY B and GUO Y (2017) Pressure standards in water distribution systems reflection on current practice with consideration of some unresolved issues. J. Water Resour. Plann. Manage. 142 (8) 04016023 1-8. https://doi.org/10.1061/(ASCE)WR.1943-5452.0000665 [ Links ]
GLEICK PH and PALANIAPPAN M (2010) Peak water limits to freshwater withdrawal and use. PNAS 107 (25) 1155-1162. https://doi.org/10.1073/pnas.1004812107 [ Links ]
GOTTIPATI P and NANDURI U (2014) Equity in water supply in intermittent water distribution networks. Water Environ. J. 28 (4) 509-515. https://doi.org/10.1111/wej.12065 [ Links ]
GULLICK R, LECHEVALLIER M, SVINDLAND R and FRIEDMAN M (2004) Occurrence of transient low and negative pressures in distribution systems. J. Am. Water Works Assoc. 96 52-66. https://doi.org/10.1002/j.1551-8833.2004.tb10741.x [ Links ]
HOWARD G and BARTRAM J (2003) Domestic Water Quantity. Service Level and Health 22 1-33. [ Links ]
ILAYA-AYZA A, CAMPBELL E, PÉREZ-GARCIA R and IZQUIERDO J (2016) Network capacity assessment and increase in systems with intermittent water supply. Water 8 (4) 126. https://doi.org/10.3390/w8040126 [ Links ]
ILAYA-AYZA A, MARTINS C, CAMPBELL E and IZQUIERDO J (2018) Gradual transition from intermittent to continuous water supply based on multi-criteria optimization for network sector selection. J. Comput. Appl. Math. 330 1016-1029. https://doi.org/10.1016/j.cam.2017.04.025 [ Links ]
JOHNSTONE C (2017) Water Services Development Plan - IDP Water Sector Input Report. City of Cape Town, Cape Town. [ Links ]
KLINGEL P (2010) From intermittent to continuous water distribution in developing countries. Karlsruhe Institute of Technology, Karlsruhe Germany. [ Links ]
KLINGEL P (2012) Technical causes and impacts of intermittent water distribution. Water Sci. Technol. Water Suppl. 12.4 504-512. https://doi.org/10.2166/ws.2012.023 [ Links ]
KORFALI S and JURDI M (2007) Assessment of domestic water quality: case study, Beirut, Lebanon. Environ. Monit. Assess 135 241-251. https://doi.org/10.1007/s10661-007-9646-x [ Links ]
KUMPEL E and NELSON KL (2015) Intermittent water supply: prevalence, practice, and microbial water quality. Environ. Sci. Technol. 50 542-553. https://doi.org/10.1021/acs.est.5b03973 [ Links ]
KWOK R and ROTHROCK D (2009) Decline in Arctic sea ice thickness from submarine and ICESAT records: 1958-2008. Geophys. Res. Lett. 36 L15501 1-5. https://doi.org/10.1029/2009GL039035 [ Links ]
LAWLESS A (2005) Numbers & Needs: Addressing imbalances in the civil engineering profession. South African Institution of Civil Engineering, Johannesburg. [ Links ]
MAGLIONICO M and UGARELLI R (2002) Reliability of a water supply system in quantity and quality terms. Bologna University, Bologna. [ Links ]
MATSINHE N, JUIZO D and PERSSON K (2014) The effects of intermittent supply and household storage in the quality of drinking water in Maputo. VATTEN - J. Water Manage. Res. 70 51-60. [ Links ]
MCINTOSH A (2003) Asian Water Supplied - Reaching the Urban Poor. Asian Development Bank and IWA Publishing, London. [ Links ]
MCKENZIE D and RAY I (2004) Household Water Delivery Options In Urban And Rural India. Stanford University, Stanford. [ Links ]
MERMIN J, VILLAR R, CARPENTER J, ROBERTS L, SAMARIDDEN A, GASANOVA L, LOMAKINA S, BOPP C, HUTWAGNER L, MEAD P, ROSS B and MINTZ ED (1999) A massive epidemic of multidrug-resistant typhoid fever in Tajikistan associated with consumption of municipal water. J. Infect. Dis. 179 (6) 1416-1422. https://doi.org/10.1086/314766 [ Links ]
MOHANTY J, FORD T, HARRINGTON J and LAKSHMIPATHY V (2002) A cross-sectional study of enteric disease risks associated with water quality and sanitation in Hyderabad City. J. Water Suppl. Res. Technol. 51 (5) 239-251. https://doi.org/10.2166/aqua.2002.0021 [ Links ]
MOLDEN D, FRENKEN K, BARKER R, DE FRAITURE C, MATI B, SVENDSEN M, SADOFF C and FINLAYSON CM (2007) Chapter 2: Trends in water and agricultural development. Water for Food, Water for Life: A Comprehensive Assessment of Water Management in Agriculture. Earthscan, London. 57-89. [ Links ]
MYBURGH H and JACOBS H (2014) Water for firefighting in five South African towns. Water SA 40 (1) 11-18. https://doi.org/10.4314/wsa.v40i1.2 [ Links ]
NEL N, JACOBS H, LOUBSER C and DU PLESSIS J (2017) Supplementary household water sources to augment potable municipal supply. Water SA 43 (4) 553-562. https://doi.org/10.4314/wsa.v43i4.03 [ Links ]
OCHA (2010) Water Scarcity and Humanitarian Action: Key Emerging Trends and Challenges.URL: https://www.unocha.org/sites/unocha/files/Water%20%20Scarcity%20and%20Humanitarian%20Action%20Nov10%20fnl.pdf (Accessed 3 August 2017). [ Links ]
PATHIRANA A, HERATH S, YAMADA T and SWAIN D (2007) Impacts of absorbing aerosols on South Asian rainfall - a modeling study. Clim. Change 85 (1-2) 103-118. https://doi.org/10.1007/s10584-006-9184-5 [ Links ]
RAHMAN A, LEE H and KHAN M (1997) Domestic water contamination in rapidly growing megacities of Asia: Case of Karachi, Pakistan. Environ. Monit. Assess. 44 339-360. [ Links ]
SEMENZA J, ROBERTS L, HENDERSON A and RUBIN C (1998) Water distribution system and diarrheal disease transmission: A case study in Uzbekistan. Am. J. Trop. Med. Hyg. 59 941-946. https://doi.org/10.1002/j.1551-8833.1981.tb04736.x [ Links ]
SHAMIR U and HOWARD CD (1981) Water supply reliability theory. Am. Water Works Assoc. 1 (1) 379-384. https://doi.org/10.1002/j.1551-8833.1981.tb04736.x [ Links ]
STRIJDOM L, SPEIGHT V and JACOBS H (2017) Theoretical evaluation of sub-standard water network pressures. J. Water Sanit. Hyg. Dev. 7 (4) 557-567. https://doi.org/10.2166/washdev.2017.227 [ Links ]
TRIFUNOVIC N (2008) Introduction to Urban Water Distribution. Taylor & Francis, London. [ Links ]
The Department of Water Affairs and Forestry (2005) A Drinking Water Quality Framework for South Africa. URL: http://www.dwaf.gov.za (Accessed 29 September 2017). [ Links ]
UNESCO (2003) Water for People, Water for Life: The United Nations Development Report. United Nations Educational Scientific and Cultural Organisation, New York USA. [ Links ]
United Nations Department of Economic and Social Affairs/Population Division (2017) World Population Prospects: The 2017 Revision, Key Findings and Advance Tables. Working Paper No. ESA/P/WP/248. United Nations, New York. [ Links ]
United Nations Environment Programme (2002) Vital Water Graphics: An Overview of the State of the World's Fresh and Marine Waters. United Nations, Nairobi. [ Links ]
VAIRAVAMOORTHY K, GORANTIWAR S D and MOHAN S (2007) Intermittent Water Supply under Water Scarcity Situations. Water Int. 32 (1) 121-132. https://doi.org/10.1080/02508060708691969 [ Links ]
VAN AALST MK (2006) The impacts of climate change on the risk of natural disasters. Disasters 30 (1) 5-18. https://doi.org/10.1111/j.1467-9523.2006.00303.x [ Links ]
VESTERGAARD (2014) Waterborne Diseases. URL: http://www.vestergaard.com/global-challenges/waterborne-diseases (Accessed 28 June 2017). [ Links ]
VÖRÖSMARTY CJ, GREEN P, SALISBURY J and LAMMERS RB (2000) Global Water Resources: Vulnerability from Climate Change. Science 289 284-288. https://doi.org/10.1126/science.289.5477.284 [ Links ]
WHO and UNICEF (2000) Global Water Supply and Sanitation Assessment, World Health Organization and United Nations Children's Fund, Geneva, New York, Switzerland. [ Links ]
WILLIS RM, STEWART RA, PANUWATWANICH K, WILLIAMS PR and HOLLINGSWORTH AL (2011) Quantifying the influence of environmental and water conservation attitudes on household end use water consumption. J. Environ. Manage. 92 1996-2009. https://doi.org/10.1016/j.jenvman.2011.03.023 [ Links ]
World Water Assessment Programme (2012) The United Nations World Water Development Report 4: Managing Water under Uncertainty and Risk. UNESCO, Paris. [ Links ]
 Correspondence:
Carlo Loubser
carloloubser@sun.ac.za
Received: 05 March 2018
Accepted: 11 November 2019

