


Serviços Personalizados
Artigo
 Inglês (pdf)
 Artigo em XML
 Referências do artigo
Indicadores

Links relacionados
-
 Citado por Google
 -
 Similares em Google
Compartilhar

 Permalink
Water SA
versão On-line ISSN 1816-7950
versão impressa ISSN 0378-4738
Water SA vol.45 no.4 Pretoria Out. 2019
http://dx.doi.org/10.17159/wsa/2019.v45.i4.7549
RESEARCH PAPERS
Assessing the influence of DEM source on derived streamline and catchment boundary accuracy
Zama Eric MashimbyeI, II, *; Willem Petrus De ClercqI; Adriaan Van NiekerkII
IDepartment of Soil Science, Stellenbosch University, Private Bag X1, Matieland 7602, South Africa
IIDepartment of Geography and Environmental Studies, Stellenbosch University, Private Bag X1, Matieland 7602, South Africa
ABSTRACT
Accurate DEM-derived streamlines and catchment boundaries are essential for hydrological modelling. Due to the popularity of hydrological parameters derived mainly from free DEMs, it is essential to investigate the accuracy of these parameters. This study compared the spatial accuracy of streamlines and catchment boundaries derived from available digital elevation models in South Africa. Two versions of Stellenbosch University DEMs (SUDEM5 and DEMSA2), the second version of the 30 m advanced spaceborne thermal emission and reflection radiometer global digital elevation model (ASTER GDEM2), the 30 and 90 m shuttle radar topography mission (SRTM30 and SRTM90 DEM), and the 90 m Water Research Commission DEM (WRC DEM) were considered. As a reference, a 1 m GEOEYE DEM was generated from GeoEye stereo images. Catchment boundaries and streamlines were extracted from the DEMs using the Arc Hydro module. A reference catchment boundary was generated from the GEOEYE DEM and verified during field visits. Reference streamlines were digitised at a scale of 1:10 000 from the 1 m orthorectified GeoEye images. Visual inspection, as well as quantitative measures such as correctness index, mean absolute error, root mean squares error and figure of merit index were used to validate the results. The study affirmed that high resolution (<30 m) DEMs produce more accurate parameters and that DEM source and resampling techniques also play a role. However, if high resolution DEMs are not available, the 30 m SRTM DEM is recommended as its vertical accuracy was relatively high and the quality of the streamlines and catchment boundary was good. In addition, it was found that the novel Euclidean distance-based MAE and RMSE proposed in this study to compare reference and DEM-extracted raster datasets of different resolutions is a more reliable indicator of geometrical accuracy than the correctness and figure of merit indices.
Keywords: hydrology, catchment delineation, digital elevation model, correctness index, figure of merit index, Euclidean distance index
INTRODUCTION
Digital elevation model (DEM) derived catchment boundaries, sub-basins and streamlines play an important role in hydrological studies (Li and Wong, 2010; Martz and De Jong, 1998; O'Callaghan and Mark, 1984; Renssen and Knoop, 2000; Turcotte et al., 2001; Vogt et al., 2003). The availability of good quality DEMs makes it possible to carry out hydrological and geomorphological analyses on regional or national levels (Moore and Wilson, 1992; Thomas et al., 2014). DEMs are offered at a variety of resolutions ranging from very high (0.1-5 m) to low (1 km) (Behrens et al., 2010; Tarekegn et al., 2010). Very high resolution (VHR) DEMs, as derived from airborne light detection and ranging (LiDAR) data, are often only available for small areas, particularly in developing countries where this technology is still prohibitively expensive. Consequently, freely available near-global DEMs are frequently used for hydrological studies at national or regional scales.
Various studies have investigated the value of DEMs for hydrological analysis. For instance, Weepener et al. (2012) developed a hydrologically improved DEM for South Africa from the SRTM90 DEM using 20 m 1:50 000 contours and ASTER GDEM data. They found that useful river lines and catchment boundaries can be delineated from the hydrologically improved SRTM90 DEM. Li and Wong (2010) compared stream networks extracted from the national elevation dataset (NED), SRTM90 DEM and LiDAR with stream networks extracted from the national hydrography dataset (NHD). They also compared flood simulations using the stream networks delineated from the different DEMs and concluded that higher-resolution DEMs can derive more accurate river networks, but that the spatial resolution of a DEM only has a minor effect on flood simulation results. Callow et al. (2007) evaluated the effect of commonly used hydrological correction methods (stream burning, Agree, ANUDEM v4.6.3 and ANUDEM v5.1) on the overall nature of a DEM. They found that different methods produce non-convergent results for catchment boundaries, stream position and length, and that these techniques differentially compromise secondary terrain analysis. Their study also concluded that, while hydrological correction methods successfully improved the calculation of the catchment area, stream position and length, they increased catchment slope.
DEMs invariably contain errors, most of which can be attributed to the data source, methods, topography complexity and spatial resolution (Aguilar et al., 2005; Kinsey-Henderson and Wilkinson, 2013; Mukherjee et al., 2011; Mukherjee et al., 2013; Thomas et al., 2014; Rodriguez et al., 2005). It has also been reported that the accuracy of a DEM is dependent on its application (Sharma and Tiwari, 2014; Sharma et al., 2010). Kensey-Henderson and Wilkinson (2013) compared DEMs derived from synthetic aperture radar (SAR) data and DEMs interpolated from topographical data for slope gradient and soil erosion estimation in low relief areas. They evaluated the magnitude of error in DEM slope and erosion estimates using the Revised Universal Soil Loss Equation. They determined that the SRTM DEMs provided more accurate estimates of slope gradient and erosion in low relief areas.
Frey and Paul (2012) investigated the suitability of the SRTM90 DEM and the ASTER GDEM for the compilation of glacier-specific topographic parameters in Switzerland. Comparing the delineated parameters with those derived from the Swiss national DEM (DHM25), they concluded that, although the SRTM90 DEM yielded slightly more accurate results, both DEMs were suitable for the compilation of topographic parameters in glacier inventories.
Evidently, the freely available medium (90 m) and high resolution (30 m) near-global DEMs have opened up many possibilities for hydrological analyses, especially at national and regional scales (De Clercq et al., 2013; Wang et al., 2011; Weepener et al., 2012; Sharma and Tiwari, 2014). Researchers frequently use these DEMs for hydrological studies, mainly because they are freely available (De Clercq et al., 2013; Gichamo et al., 2012; Wang et al., 2011; Weepener et al., 2012). However, little attention has been paid to the quality of the products that are derived from these DEMs. Given their popularity, it is important to assess the accuracy of the derived hydrological parameters so that uncertainties can be considered in the interpretation of hydrological analysis results. For South Africa, in addition to the freely available global DEMs (for example, SRTM and ASTER GDEM), a hydrologically improved Water Research Commission (WRC) DEM is available. While these DEMs are widely used to derive hydrological parameters, the accuracy of the resultant parameters has not been evaluated. This study investigated the validity of hydrological parameters derived from these freely available DEMs. The spatial accuracy of catchment boundaries and streamlines derived from a total of 7 DEMs that are available at national level in South Africa was evaluated. In addition, this study investigated a novel Euclidean distance-based technique for validating the geometric accuracy of DEM derived streamlines and catchment boundaries using root mean squares error and mean absolute error.
MATERIAL AND METHODS
The study site
The study area is the Sandspruit catchment, a subcatchment of the Berg River in the Western Cape Province, South Africa (Fig. 1). The catchment is located in a winter rainfall region, and the mean annual rainfall is about 400 mm (Flügel, 1995). The study area is 152 km2 in size and has a gently hilly topography. The geology of the Sandspruit catchment is mainly Malmesbury shales, even though there are smaller occurrences of fine sediment, silcrete-ferricrete, greenstone, quartzite and granite. An opencast mine is located in the south-eastern part of the catchment. While the catchment is largely used for dryland cultivation of winter wheat, canola and pasture are also cultivated, and a small proportion of the catchment is covered by natural vegetation.
Datasets used
The datasets used in this study included trig beacon heights, field survey points, satellite and aerial imagery, DEMs, reference streamlines and a reference catchment boundary. Each of these datasets is described in the following subsections.
Trig beacons and field survey points
A combination of trig beacons and GPS field survey points were used to validate the vertical accuracy of the DEMs. Trig beacons covering the Sandspruit catchment, established by the South African Chief Directorate of National Geo-spatial information (CDNGI) and their coordinates (including ground height), were obtained from the Centre for Geographical Analysis (CGA) at Stellenbosch University. GPS field survey points were measured using a survey grade Trimble Differential GPS. The GPS points were differentially corrected to improve their accuracy to about 10 cm. A total of 38 points (6 trig beacons and 32 GPS points) were used as reference points to validate the DEMs.
Satellite and aerial imagery
GeoEye stereo-images were acquired from Geo Data Design. The 0.4 m resolution images were captured in July 2011, a period in the year when crops in the study area were still at seedling height. Vegetation would therefore have had a minimal effect on photogrammetrically extracted heights.
Very high-resolution (0.5 m) orthorectified digital aerial images covering the study area were sourced from CDNGI (http://www.ngi.gov.za). The images were acquired in 2007 and were used as spatial reference during the orthorectification of GeoEye stereo images.
DEMs
The DEMs considered in this study were the SRTM90 DEM, SRTM30 DEM, ASTER GDEM2, two versions of Stellenbosch University's digital elevation model (SUDEM) (SUDEM5 and the digital elevation model of South Africa), the 90 m Water Research Commission DEM (WRC DEM) and a 1 m DEM generated from GeoEye images (GEOEYE DEM).
The SRTM90 DEM was completed in 2000 and provides the first medium-resolution DEM data at near-global scale (Farr and Kobrick, 2001; Li and Wong, 2010). The SRTM90 DEM has an absolute vertical error of less than 16 m and an absolute horizontal accuracy of 20 m (Farr, 2000; Mulder et al., 2011; Van Niekerk, 2008). According to the Consultative Group on International Agricultural Research Consortium for Spatial Information (CGIAR-CSI, 2011), the SRTM DEM data have been processed to fill data voids and can be used by a wide range of potential users.
The SRTM30 DEM is a near-global DEM that comprises a combination of data from the Shuttle Radar Topography Mission flown in February 2000 and the United States Geological Survey's GTOPO30 data set (USGS, 2016).
The ASTER GDEM was developed jointly by the Ministry of Economy, Trade and Industry (METI) of Japan and the United States National Aeronautics and Space Administration (NASA). The second version of ASTER GDEM (GDEM2) was released in October 2011 (ASTER GDEM Validation Team, 2011) with the inclusion of 26 000 additional scenes to improve coverage. The new version uses a smaller correlation kernel to yield higher spatial resolution, and water masking was also enhanced. ASTER GDEM2 was validated by comparing it to the absolute geodetic references over the conterminous United States (CONUS), the national elevation grids over the US and Japan, the SRTM 1 arc-second DEM over the US and 20 sites around the globe, and global space-borne laser altimeter data. The vertical and horizontal accuracy of the GDEM2 is estimated at 17 m and 71 m, respectively (ASTER GDEM Validation Team, 2011; Mukherjee et al., 2013).
The SUDEM, developed by the Centre for Geographical Analysis (CGA) at Stellenbosch University, is a commercially available product. As of 2015, four products that involve various levels of processing were produced (Van Niekerk, 2016). The 5 m resolution SUDEM5 was generated by fusing the 30 m SRTM DEM with the so called 'Level 1 product'. The Level 1 product (5 m spatial resolution) was interpolated from large (1:10 000) and smaller (1:50 000) scale contours and spot-height data (Van Niekerk, 2016). Smaller-scale contours were only used in areas where large-scale data were not available. Using LiDAR data as reference, the SUDEM5 product was estimated to have a mean absolute error (MAE) of 2.2 m (Van Niekerk, 2016). The 2 m digital elevation model of South Africa (DEMSA2) is a digital surface model (DSM) that is available at 2 m resolution. This DEM was extracted from 0.5 m resolution CDNGI stereo aerial photography (Van Niekerk, 2016). Based on surveyed reference points, the MAE of DEMSA2 product is estimated to be 0.35 m (Van Niekerk, 2016). The SUDEM and DEMSA2 products were considered in this study as they are the only very high resolution DEMs available nationally in South Africa.
The Water Research Commission's digital elevation model (WRC DEM) was developed by the Agricultural Research Council (ARC) for the WRC (Weepener et al., 2012). This DEM was interpolated from the SRTM90 DEM. The SRTM voids were filled with elevation values interpolated from 20 m (1:50 000 scale) vertical interval contours obtained from CDNGI. The resulting DEM was hydrologically corrected by filling sinks and depressions. The vertical accuracy of the WRC DEM was determined to be less than 5 m.
The GEOEYE DEM was created from GeoEye stereo images acquired in July 2011 using the rational polynomial coefficients (RPC) model in the LPS module of ERDAS Imagine software (www.intergraph.com). The GEOEYE DEM was extracted at 1 m horizontal intervals and was validated using reference points (trigonometric beacons) in the Sandspruit catchment. A MAE of 0.70 m was recorded. The GEOEYE DEM was used to delineate a reference catchment boundary. The reference catchment boundary was extracted using the Arc Hydro module in ArcGIS 10.
Reference catchment boundary and reference streamlines
Reference streamlines were digitised at a scale of 1:10 000 from the 1 m orthorectified GeoEye images. The reference streamlines were visually compared to the 1:50 000 national riverlines dataset. It was found that, although the two datasets were geometrically aligned, the 1:50 000 streamlines were much more generalised and contained many topological errors (e.g. gaps).
The reference catchment boundary, generated from the 1 m resolution GEOEYE DEM, was used to validate the lower resolution DEM-delineated catchment boundaries. The reference catchment boundary was validated during several field visits and by visual inspection in ERDAS Stereo Analyst (www.intergraph.com).
Delineation of catchment boundaries and streamlines from DEMs
The Arc Hydro extension for ArcGIS software was used to delineate the Sandspruit catchment boundaries and streamlines from the DEMs. All the datasets were projected to the Universal Transverse Mercator (UTM) coordinate system (Zone 34S). Catchment boundaries and streamlines were extracted at the native resolution of the DEMs. Additionally, the DEMs were resampled to the resolution of the coarsest DEMs (90 m) to allow comparison without the effect of spatial resolution. The threshold for stream delineation was set at 1% of the maximum flow accumulation, as recommended by Arc Hydro's rule of thumb for stream delineation from DEMs (Merwade, 2012; Tarboton, 2003). The GEOEYE DEM was used to calculate reference flow accumulation thresholds for the other DEMs at their respective resolutions. For catchment boundary delineation, outlet (pour) points were selected at the same position. A stream network was extracted from the GEOEYE DEM to enable comparison with previous studies conducted with very high resolution (VHR) DEMs (Li and Wong, 2010). Catchment boundaries and streamlines extracted from all the DEMs were converted to raster datasets using the Feature to Raster tool in ArcGIS 10.1, and the cell size was set to 5 m for comparison purposes. Cells representing boundaries or streamlines (using the GRID_CODE ID of the feature dataset generated by Arc Hydro) were allocated values of 1. All other cells were defined as having no values (i.e. NODATA). Separate raster datasets were created for catchment boundaries and streamlines.
Validation
Vertical accuracy of the DEMs
The vertical accuracies of the DEMs were determined using the absolute and relative mean error (MAE), absolute and relative root mean squares error (RMSE) and 90th percentile, based on a combination of trig beacons and differentially corrected GPS points as a reference. RMSE, MAE and 90th percentile are metrics based on reference values commonly used to determine the accuracy of a DEM (Rawat et al., 2019). The MAE and RMSE were calculated based on Eqs 1 and 2:
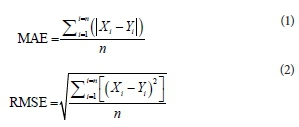
where Xi is the elevation of a DEM at point i, Yi is the reference elevation at point i, and n is the number of samples. According to Rawat et al. (2019), RMSE varies with the variability within the distribution of error magnitudes, square root of the number of errors and the magnitude of MAE. MAE is a more natural measure of average error and, unlike RMSE, is unambiguous (Rawat et al., 2019). Lower RMSE and MAE values show good accuracy. The 90th percentile error reveals the value below which 90% of the errors fall.
DEM delineated catchment boundaries and streamlines
The catchment boundaries and streamlines extracted from the DEMs were visually compared to the reference datasets. Four measures, namely the correctness index (Cr), figure of merit index (FMI), MAE and RMSE were used to quantitatively evaluate continuous delineated catchment boundaries and stream networks. The Cr and FMI were introduced by Li and Wong (2010) to validate stream networks extracted from DEMs, while MAE and RMSE are proposed in this study as additional measures of spatial agreement.
The Cr compares two sets of raster cells (A and B), which represent DEM-extracted and reference raster datasets, respectively (Li and Wong, 2010). The Cr is calculated by Eq. 3 below:
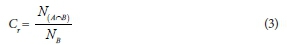
where NB is the number of cells representing the reference raster and N(A∩B) is the number of cells of the DEM-extracted raster. Index values range between 0 and 1, and indicate the proportion of the reference raster that is correctly represented by the extracted raster (Li and Wong, 2010). A high correctness index value indicates a high accuracy of extracted streams.
According to Li and Wong (2010), Cr does not reflect how well the extracted raster (representing stream networks in their case) can reproduce the entire actual raster, and they assert that the FMI offers a better solution. The FMI is the ratio of the intersection of the observed change and predicted change to the union of observed change and predicted change (Pontius et al., 2008; Perica and Foufoula-Georgiou, 1996). FMI is computed by Eq. 4 below:
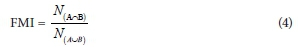
where N(A∩B) is the number of unique cells found in rasters A and B and N(A∩B) is the total number of cells found in both A and B (overlapping cells are only counted once). FMI values range between 0 and 1, and a higher FMI value indicates a higher overlap between the two raster datasets, therefore high accuracy.
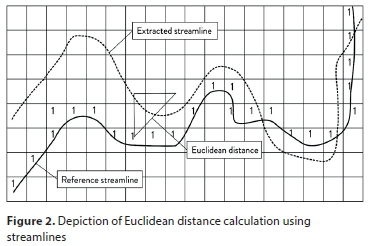
Euclidean distance (ED) is calculated from the centre of the reference raster cell to the centre of the extracted raster cell. Figure 2 depicts how ED is calculated for streamlines. MAE and RMSE consider the offset (ED) between cells in the reference raster and the closest cell in the candidate raster. The sum of the offsets was used to calculate MAE and RMSE using Eqs 1 and 2. Relatively low MAE and RMSE values indicate a high accuracy of DEM-extracted raster datasets. RMSE is considered a better indicator of accuracy as it is more sensitive to outliers than MAE, but it is often useful to interpret these measures in combination. Large differences between MAE and RMSE are indicative of high variances in individual errors (i.e. outliers).
RESULTS
Vertical accuracy of the DEMs
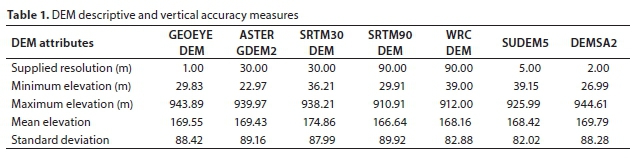
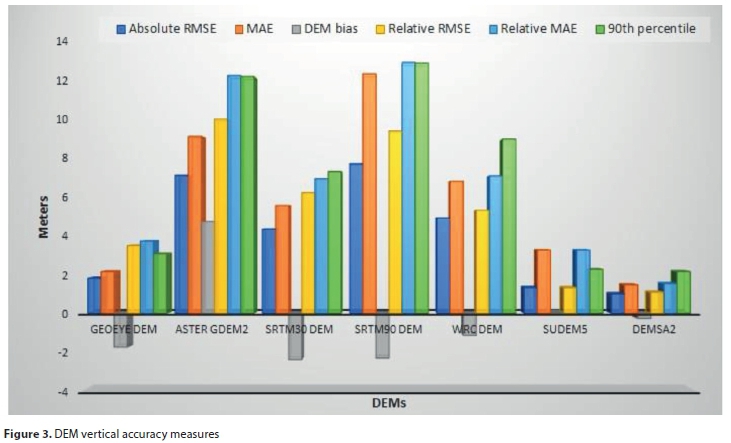
The descriptive and accuracy statistics of all the DEMs used in this study are given in Table 1 and Fig. 3. The DEMs show disparities in how they represent the character of the study area, as depicted by the variances in the different descriptive and accuracy measures recorded (Table 1, Fig. 3). ASTER GDEM2 shows the highest bias followed by the SRTM30 and SRTM90, GEOEYE DEM, WRC DEM, DEMSA2 and SUDEM5 (Fig. 3). The absolute and relative MAE and RMSE are <1.54 m for DEMSA2, <3.28 for SUDEM5, <3.75 for GEOEYE DEM, <6.99 for SRTM30 DEM, <7.14 for WRC DEM, <12.35 for ASTER GDEM2 and >13.03 for SRTM90 DEM, respectively. Regarding the 90th percentile, 90% of elevation values fall below 2.17 (DEMSA2), 2.28 (SUDEM5), 3.09 (GEOEYE DEM), 7.37 (SRTM30 DEM), 9.05 (WRC DEM), 12.3 (ASTER GDEM2) and 12.99 (SRTM90), respectively. It is obvious that DEMSA2 is the most accurate (vertically), followed by SUDEM5, GEOEYE DEM, SRTM30 DEM, WRC DEM, ASTER GDEM2 and SRTM90 DEM.
DEM-delineated catchment boundaries
Based on visual assessment, the catchment boundaries extracted from all the DEMs seem relatively accurate compared to the reference catchment boundary (see Fig. 4a-f). It appears that SUDEM5 and DEMSA2 delineated very accurate catchment boundaries (Fig. 4e, f). The catchment boundaries delineated from these DEMs show small discrepancies with the reference catchment boundary. While the catchment boundaries delineated from the SRTM30 DEM and WRC DEM also appear to be visually accurate, the discrepancies of the catchment boundaries delineated from these DEMs seem slightly greater than those of the SUDEM5 and DEMSA2 (Fig. 4b, d). The WRC DEM appears to delineate a better boundary than the SRTM30 DEM at the area occupied by a mine on the south-eastern part of the Sandspruit catchment (Fig. 4b, d). The ASTER GDEM2 and SRTM90 DEM delineated catchment boundaries show visibly larger discrepancies with the reference catchment boundary (Fig. 4a, c). While the ASTER GDEM2 shows a large discrepancy with the reference catchment boundary in the middle of the eastern part of the catchment, the SRTM90 DEM catchment boundary shows a larger discrepancy compared to the reference boundary in the vicinity of the mine at the south-eastern part of the catchment and at the outflow of the catchment at the north-eastern part. The SRTM90 DEM appears to overestimate the catchment boundary in the south-eastern parts, but performs better than the ASTER DEM2 in delineating the eastern boundary (Fig. 4c). The ASTER GDEM2 slightly underestimates the catchment boundary at the south-eastern part of the catchment and is also unable to correctly delineate the eastern boundary (Fig. 4c).
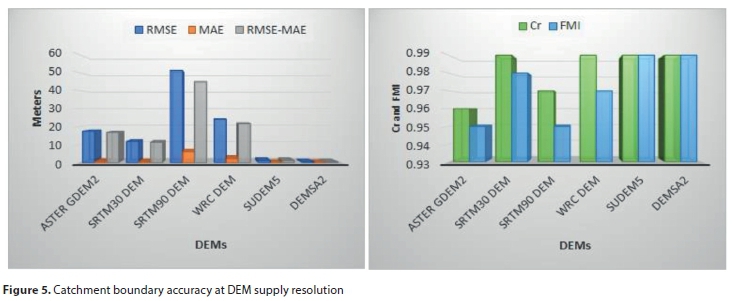
Regarding the accuracy measures at the supply resolution of the DEMs, DEMSA2 yielded the lowest RMSE and MAE, followed by SUDEM5, SRTM30 DEM, ASTER GDEM2, WRC DEM and the SRTM90 DEM (Fig. 5). The Cr and FMI ratios for SUDEM5 and DEMSA2 are all at near-maximum values (Cr = FMI = 0.99). Whereas the Cr values for SRTM30 DEM and WRC DEM are near maximum and equal (Cr = 0.99), the FMI ratio for SRTM30 DEM is slightly higher than that of WRC DEM (Fig. 5). The ASTER GDEM2 recorded the lowest Cr and FMI values. From these results, it is clear that DEMSA2 delineated the most accurate catchment boundary followed by the SUDEM5 (Fig. 5). Figure 5 indicates that the SRTM30 DEM yields a more accurate catchment boundary in comparison to the ASTER GDEM2. When comparing the medium resolution (MR) DEMs, it is clear that the WRC DEM delineated a more accurate boundary than the SRTM90 DEM (Fig. 5). While the vertical accuracy of DEMSA2, SUDEM5, SRTM30 DEM and SRTM90 DEM is in line with the accuracy of the delineated catchment boundary, this is not the case for ASTER GDEM2 and WRC DEM. Although the WRC DEM yielded a better vertical accuracy than the ASTER GDEM2, the ASTER GDEM2 delineated a slightly more accurate catchment boundary than the WRC DEM (Table 1 and Fig. 3, Fig. 5). Based on the differences between RMSE and MAE, it is obvious that VHR DEMs yielded lower variations in individual errors and that accuracy decreased as resolution decreased (Fig. 5). As can be seen in Fig. 5, the variation in individual errors for catchment delineation increases with an increase in the spatial resolution of the DEMs.
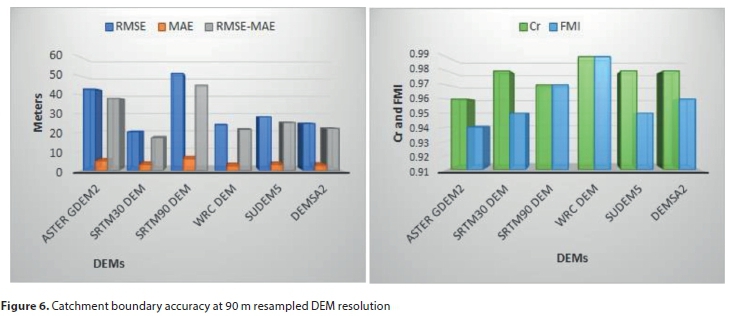
For catchment delineation performed when all DEMs are resampled to MR, SRTM30 DEM records the lowest RMSE, followed by DEMSA2, WRC DEM, SUDEM5, ASTER GDEM2 and SRTM90 DEM (Fig. 6). With regard to MAE, WRC DEM yields the lowest MAE values, followed by DEMSA2, SUDEM5, SRTM30 DEM, ASTER GDEM2 and SRTM90 DEM (Fig. 6). Similarly, lower Cr and FMI values for catchment delineation are seen when the DEMs are resampled to MR (Fig. 6). For the VHR DEMs, DEMSA2 delineates a more accurate catchment boundary than SUDEM5 as was the case at supply resolutions. A similar trend is observed for the HR DEMs and the MR DEMs where SRTM 30 DEM delineates a better boundary than ASTER GDEM2. It is obvious from Fig. 6 that the variations in individual errors for the VHR and HR DEMs for catchment boundary delineation increase when they are resampled to MR. The variations in individual errors for SRTM30 DEM and WRC DEM are lower than those of very high resolution DEMs (DEMSA2 and SUDEM5) when they are resampled to MR.
DEM-extracted streamlines
Streamlines extracted from the DEMs are depicted in Fig. 7a-g. Visually, the streamlines appear to align well with the reference streamlines, although some misalignments for the different DEMs are apparent in certain areas. An in-depth view of a selected area around the mid-northern part of the catchment reveal larger discrepancies for the GEOEYE DEM, ASTER GDEM2 and the SRTM30 DEM (Fig. 7a, b and c). The visual discrepancies of the streams delineated from the SRTM90 DEM, WRC DEM and SUDEM5 appear to be smaller than those of GEOEYE DEM, ASTER GDEM2 and the SRTM30 DEM. Visually, the DEMSA2 streams align very well with the reference streamlines (Fig. 7g).
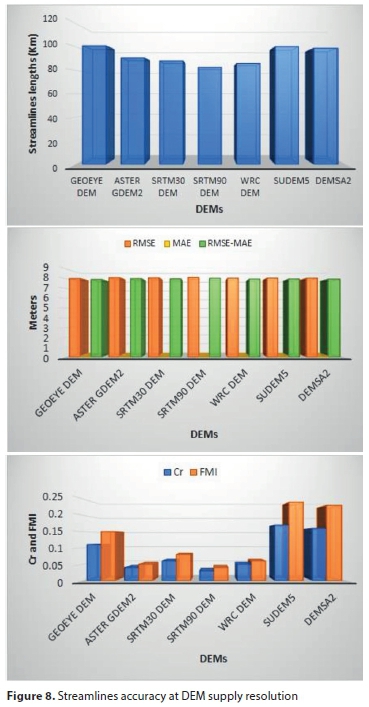
At DEM supply resolution, GEOEYE DEM recorded the longest streamlines, followed by SUDEM5, DEMSA2, ASTER GDEM2, SRTM30 DEM, WRC DEM and SRTM90 DEM (Fig. 8). The RMSE and MAE values for delineated streamlines for all the DEMs are similar. Similarly, the variation of individual errors for stream delineation for the DEMs is similar for all the DEMs (Fig. 8). Cr and FMI values for all DEMs are low. VHR DEMs recorded slightly larger Cr and FMI values.
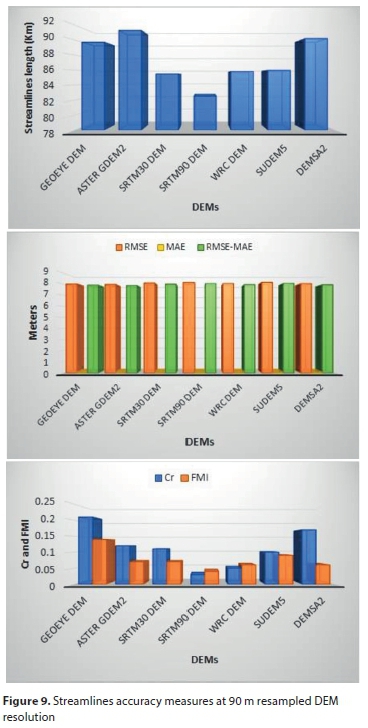
Regarding delineation when the finer resolution DEMs are resampled to MR, the total lengths of extracted streamlines are generally shorter for all DEMs, with the exception of ASTER GDEM2. Contrary to streamline lengths extracted at supply resolution, ASTER GDEM recorded the longest streamlines, followed by DEMSA2, GEOEYE DEM, SUDEM5, WRC DEM, SRTM30 DEM and SRTM90 DEM. As at DEM supply resolution, RMSE and MAE for delineated streamlines are similar for all the DEMs (Fig. 9). It does not seem that the geometric accuracy of the DEM extracted streamlines is in line with the vertical accuracy of the DEMs (Table 1 and Fig. 3, Fig. 9).
DISCUSSION
All the DEMs used in this study show reliable vertical accuracies. The overall vertical accuracies of DEMSA2 and SUDEM5 are slightly lower than reported by Van Niekerk (2016). This is likely due to the use of a combination of differentially corrected GPS points and trig beacon heights in this study, whereas LiDAR data were used by Van Niekerk (2016). Also, validation data used in this study were mainly biased along the main channel in the catchment. Although the surveyed points were mainly measured on areas without vegetation, it is likely that riparian vegetation could have influenced the accuracy as it could have been included in the pixels. The vertical accuracies of SRTM DEM and ASTER GDEM2 are higher than reported in product specifications. While the absolute vertical accuracy of SRTM DEM and ASTER GDEM2 were reported to be around 16 m and 17 m, respectively, all vertical accuracy measures used in this study yielded accuracy values <14 m for both DEMs. These results are consistent with previous findings where Elkhrachy (2018) reported absolute vertical accuracies of 5.94 and 5.07 m for the SRTM30 DEM and ASTER GDEM2, respectively. Also, Patel et al. (2016) recorded absolute RMSE values of 3.72 and 6.03 m for the SRTM30 DEM and ASTER GDEM2, respectively. The vertical accuracy of WRC DEM is consistent with what was reported by Weepener et al. (2012). The vertical accuracy of GEOEYE DEM is slightly less than that of SUDEM5 and DEMSA2. Occurrence of vegetation could have influenced the accuracy of the GEOEYE DEMs since the survey was conducted in August 2017 whilst the stereo images used to create the DEM were captured in July 2011. Areas without vegetation along the stream could easily have been vegetated by the time the imagery was taken.
Reliable catchment boundaries were delineated from VHR to medium-resolution DEMs investigated in this study when carried out at supply resolutions. Based on the assessment indicators, the VHR DEMs yielded more accurate catchment boundaries followed by high-resolution and medium-resolution DEMs at supply resolution. DEMSA2 demonstrates superiority over all the DEMs for catchment delineation, while the SUDEM5 also records a relatively accurate catchment boundary at supply resolution. While SRTM30 DEM yielded a more accurate catchment boundary than ASTER GDEM2 at supply resolution for the HR DEMs, the WRC DEM recorded a more reliable boundary in comparison to the SRTM90 DEM for MR DEMs. DEM resolution does not appear to play any role when catchment boundaries are extracted at medium resolution for all the DEMs. These findings are consistent with previous studies that demonstrated that the outputs of hydrological modelling are not influenced by DEM resolution alone (Tan et al., 2015; Wang et al., 2015; Wang et al., 2011; Wu et al., 2008; Chaplot, 2005; Wolock and Price, 1994), as the DEM source (Wang, Yang and Yao, 2011; Li and Wong, 2010) and resampling technique (Wu et al., 2008) also play a role in the accuracy of delineated hydrological parameters. According to Woodrow et al. (2016), Zhang et al. (2008), Garbrecht and Martz (2000) and Walker and Willgoose (1999), the source of data used to generate a DEM is the main factor determining the spatial and horizontal detail of a DEM. DEMs derived from contours and spot heights are known to be generalized and are unlikely to contain sufficient detail in areas where the horizontal contour interval is larger than the DEM resolution (Vaze et al., 2010).
In this study, a catchment with relatively moderate terrain was chosen to assess the quality of the derived datasets. It is expected that the quality of the SUDEM5 products will improve as terrain complexity increases, as they are largely unaffected by distortions caused by view angle and vegetation cover. Contours are also more densely distributed in areas of complex terrain, which means that interpolated elevations are generally more accurate in such areas. The better performance of the SRTM 30 DEM in comparison to ASTER GDEM for catchment delineation is in line with the findings of Li et al. (2013) who investigated the impact of resolution and DEM source based on ASTER GDEM and SRTM90 DEM and found that SRTM DEM performed better than ASTER GDEM, irrespective of the course grid size. Also, Zhang et al. (2008) evaluated SRTM, NED and LiDAR DEMs at three spatial resolutions (4, 10 and 30 m) in simulating hydrologic responses. They concluded that a 10 m LiDAR DEM recorded the best results.
With regard to delineation performed when VHR and HR DEMs are resampled to MR, the accuracy of the catchment boundaries decreases substantially. This is likely due to the resampling technique. Le Coz et al. (2009) used 6 resampling techniques to aggregate the SRTM DEM from 0.09 to 10 km. They found that mean and median resampling techniques yielded smoother relief while maximum and nearest neighbour produced rougher relief, which resulted in overestimation of the surface area of floodplains. A nearest neighbour resampling techniques was used in this study.
Similar to catchment boundary delineation, reliable streamlines were extracted from all DEMs used in this study. The accuracy of streamlines extracted from all the DEMs appears to be similar irrespective of resolution and the vertical accuracy of DEMs. While the differences in the accuracy measures are slight, they do not seem to be in line with the resolutions and vertical accuracies of the DEMs. This is in contrast to Charrier and Li (2012), who found that the offset from the reference tends to continuously increase as DEM resolution decreases. Vogt et al. (2003) also demonstrated that the quality of DEM-derived river networks is limited by the spatial resolution and vertical accuracy of the underlying DEMs. However, our study is in support of Charrier and Li (2012) with respect to the length of streamlines decreasing with decreasing DEM resolutions, and that the mean offset is mainly less than the cell size of the DEMs. In this study, the offset is similar for all the DEMs. It is likely that terrain complexity affects the delineation of streamlines in the current study. The studied catchment has moderate terrain. For streamline delineation at HR, the SRTM30 DEM performed better compared to the ASTER GDEM2. According to Tarekegn et al. (2010), ASTER-based DEMs are relatively accurate in near-flat and smoothly-sloped areas, but they are characterised by large errors in areas covered by forest, snow, steep cliffs and deep valleys. The catchment area in this study is generally flat and clear of tall vegetation, which would have been beneficial to the ASTER GDEM. However, the results of this study show that the SRTM DEMs performed better than the ASTER GDEM for the derivation of topographic indices (Frey and Paul, 2012).
Regarding streamline extraction at MR, the WRC DEM showed a slight improvement over the SRTM90 DEM. This is in line with Callow et al. (2007) who concluded that hydrologically corrected DEMs resulted in an improved calculation of the catchment area, stream position and length as compared to unmodified DEMs. Although the differences in accuracy measures were marginal, it appears that the positional accuracy of streams stay relatively similar when VHR and HR DEMs are up-sampled to MR. However, total extracted streamline length decreased when the VHR DEMs were up-resampled to MR, and the decrease was more than 9%.
The Cr and FMI ratios calculated for the SRTM90 DEM at 5 m cell size in this study are comparable to those reported by Li and Wong (2010), who recorded Cr and FMI ratios of about 0.03 and 0.01, respectively, for the SRTM90 DEM.
While the Cr for the 1 m GEOEYE DEM in this study is slightly lower than that of the 2 m LiDAR DEM at 5 m cell size resolution used by Li and Wong (2010), the 1 m GEOEYE DEM yielded a higher FMI than their LiDAR DEM. The 2 m DEMSA2 and 5 m SUDEM5 yielded higher Cr and FMI values at 5 m cell size in comparison to the 2 m LiDAR DEM in Li and Wong (2010). However, the Cr and FMI ratios are not good indicators of accuracy when DEMs of different resolutions are compared. Instead, Euclidean distance based MAE and RMSE measures are recommended as they are less sensitive to resolution differences. The positional accuracy of DEMSA2 streamlines is comparable to those of WRC DEM despite its lower resolution. This can partly be attributed to VHR resolution DEMs being more sensitive to topographic features and, in the case of DEMSA2 land cover features (e.g. vegetation growing in the river-bed), it can cause inaccuracies in the extracted streamlines.
CONCLUSIONS
This study investigated the utility of DEMs for extracting two hydrological parameters, namely, catchment boundaries and streamlines. The accuracy of these hydrological parameters extracted from two VHR DEMs (DEMSA2 and SUDEM5), three freely available HR global DEMs (30 m ASTER GDEM2 and SRTM DEMs) and two MR global DEMs (90 m WRC DEM and SRTM DEMs) were compared. The study affirmed that the higher resolution DEMs generally produce more accurate parameters (only with respect to catchment boundaries in this study), but that other factors such as source data, resampling technique, terrain complexity and interpolation algorithm also play a role. It is also evident from the results that, of the HR DEMs considered in this study, the SRTM30 DEM produced more satisfactory catchment hydrological parameters than the ASTER GDEM2. Regarding the MR DEMs, the WRC DEM yielded consistently more accurate catchment boundaries and streamlines than the SRTM90 DEM. When the VHR and HR DEMs were resampled to MR, the HR DEMs generated less accurate catchment boundaries.
The ED-based MAE and RMSE proposed in this study can be reliably used to compare reference and DEM-extracted raster datasets of different resolutions and are generally better indicators of geometrical accuracy than the Cr and FMI ratios. The MAE and RMSE values are more intuitive because they provide a quantitative measure of the ED between the generated and reference features. The Cr and FMI ratios are unitless, which makes comparisons difficult. The difference between the MAE and RMSE values can also be used as an indicator of consistency (i.e. impact of outliers).
Despite the relatively lower accuracies of the streamlines and catchment boundaries derived from the high- and medium-resolution DEMs considered, the quality of these datasets seems to be acceptable but depends on the application and scope of assessment. It is critical that the uncertainties in the derived products are taken into consideration when these are used for hydrological analyses. Large errors in streamlines and catchment boundaries can have a significant impact on some applications. Hydrologic modelling, in particular, requires accurate channel and catchment morphology data; large offsets in stream centre lines and catchment boundaries will have a negative impact on flow prediction accuracies. DEM-derived streamlines are also increasingly being used in automated topographical and land cover mapping. Errors in streamlines derived from DEMs will be propagated to these datasets, particularly at large mapping scales.
From the results presented in this paper, it is clear that VHR DEMs should be used at supply resolution to delineate catchment boundaries and streamlines, if available/affordable. Caution should be exercised when using hydrological parameters extracted from up-sampled VHR DEMs, particularly catchment boundaries and total streamline lengths, as these can be highly inaccurate. Also, it does not seem that there is a significant effect on the geometrical accuracy of extracted streamlines when finer resolution DEMs are resampled to MR.
Of the available DEMs covering South Africa, the DEMSA2 is the most suitable product for delineating detailed catchment boundaries. The hydrological parameters from the SUDEM5 are also relatively accurate. As stated earlier, these DEMs should be used at supply resolution for accurate catchment boundary delineation. It does not seem that up-sampling VHR and HR DEMs to medium resolution has a substantial effect on the positional accuracy of delineated streamlines.
Regarding freely available DEMs for delineating catchment boundaries and streamlines, the SRTM30 DEM is recommended. This DEM generated superior catchment boundaries in comparison to the other freely available DEMs (namely, WRC DEM, ASTER GDEM2, WRC DEM and SRTM90 DEM).
More research is, however, needed to evaluate how the different DEMs will perform in landscapes with complex terrain and land cover.
ACKNOWLEDGEMENTS
The Water Research Commission, National Research Foundation and the Agricultural Research Council-Institute for Soil, Climate and Water (ARC-ISCW), are acknowledged for funding this work. The Chief Directorate National GeoSpatial Information of the Department of Rural Development and Land Reform in Mowbray is thanked for providing the digital aerial images. The Stellenbosch University Centre for Geographical Analysis is thanked for providing VHR DEMs. Our appreciation is given to Chris Hacking at Stellenbosch University for collecting field survey data. We extend our gratitude to Mrs Helene Van Niekerk for editing the manuscript.
REFERENCES
AGUILAR FJ, AGUERA F, AGUILAR MA and CARVAJAL F (2005) Effects of terrain morphology, sampling density, and interpolation methods on grid DEM accuracy. Photogram. Eng. Remote Sens. 71 805-816. https://doi.org/10.14358/PERS.71.7.805 [ Links ]
ASTER GDEM VALIDATION TEAM (2011) Aster global digital elevation model version 2 - Summary of validation results. NASA Land Processes Distributed Archive Center and Joint Japan - US Aster Team. [ Links ]
BEHRENS T, ZHU AX, SCHIMIDT K and SCHOLTEN T (2010) Multi-scale digital terrain analysis and feature selection for digital soil mapping. Geoderma 155 175-185. https://doi.org/10.1016/j.geoderma.2009.07.010 [ Links ]
CALLOW JN, VAN NIEL KP and BOGGS GS (2007) How does modifying a DEM to reflect known hydrology affect subsequent terrain analysis? J. Hydrol. 332 30-39. https://doi.org/10.1016/j.jhydrol.2006.06.020 [ Links ]
CGIAR-CSI (2011) [Online]. URL: http://srtm.csi.cgiar.org (Acessed 20 July 2011). [ Links ]
CHAPLOT V (2005) Impact of DEM mesh size and soil map scale on SWAT runoff, sediment, and NO3-N loads predictions. J. Hydrol. 312 207-222. https://doi.org/10.1016/j.jhydrol.2005.02.017 [ Links ]
CHARRIER R and LI Y (2012) Assessing resolution and source effects of digital elevation models on automated floodplain delineation: A case study from the Camp Creek Watershed, Missouri. Appl. Geogr. 34 38-46. https://doi.org/10.1016/j.apgeog.2011.10.012 [ Links ]
DE CLERCQ WP, JOVANOVIC N, BUGAN R, MASHIMBYE E, DU TOIT T,VAN NIEKERK A, ELLIS F, WASSERFALL N, BOTHA P, STEUDELS P and co-authors (2013) Management of human-induced salinization in the Berg River catchment and development of criteria for regulating agricultural land use in terms of salt generating capacity. WRC Report No. 1849/1/13. Water Research Commission, Pretoria. [ Links ]
ELKHRACHY I (2018) Vertical accuracy assessment for SRTM and ASTER digital elevation models: A case study of Najran city, Saudi Arabia. Ain Shams Eng. J. 9 1807-1817. https://doi.org/10.1016/j.asej.2017.01.007 [ Links ]
FARR T and KOBRICK M (2001) The shuttle radar topography mission. Am. Geophys. Union EOS 81 583-585. https://doi.org/10.1029/EO081i048p00583 [ Links ]
FARR TG (2000) The shuttle radar topography mission. IEEE Aerospace Conference Proceedings 63. https://doi.org/10.1029/EO081i048p00583 [ Links ]
FLUGEL W-A (1995) River salinity due to dryland agriculture in the Western Cape province, Republic of South Africa. Environ. Int. 21 679-686. https://doi.org/10.1016/0160-4120(95)00073-T [ Links ]
FREY H and PAUL F (2012). On the suitability of the SRTM DEM and ASTER GDEM for the compilation of topographic parameters in glacier inventories. Int. J. Appl. Earth Obs. Geoinf. 18 480-490. https://doi.org/10.1016/j.jag.2011.09.020 [ Links ]
GARBRECHT J and MARTZ LW (2000) Digital elevation model issues in water resources modelling. In: Maidment D and Djokic D (eds) Hydrologic and Hydraulic Modelling Support with Geographic Information Systems. ESRI Press, Redlands, CA. [ Links ]
GICHAMO TZ, POPESCU I, JONOSKI A and SOLOMATINE D (2012) River cross-section extraction from the ASTER global DEM for flood modeling. Environ. Model. Softw. 31 37-46. https://doi.org/10.1016/j.envsoft.2011.12.003 [ Links ]
KINSEY-HENERSON AE and WILKINSON SN (2013) Evaluating Shuttle radar and interpolated DEMs for slope gradient and soil erosion estimation in low relief. Environ. Model. Softw. 40 128-139. https://doi.org/10.1016/j.envsoft.2012.08.010 [ Links ]
LE COZ M, FRANCOIS D, GENTHON P and FAVREAU G (2009) Assessment of Digital Elevation Model DEM) aggregation methods for hydrological modeling: Lake Chad basin, Africa. Comput. Geosci. 35 (8) 1661-1670. https://doi.org/10.1016/j.cageo.2008.07.009 [ Links ]
LI J and WONG DWS (2010) Effects of DEM sources on hydrologic applications. Comput. Environ. Urban Syst. 34 251-261. https://doi.org/10.1016/j.compenvurbsys.2009.11.002. [ Links ]
LI P, SHI C, LI ZH, MULLER JP, DRUMMOND J, LI XY, LI T, LI YB and LIU JN (2013) Evaluation of ASTER GDEM using GPS benchmarks and SRTM in China. Int. J. Remote Sens. 34 (5) 1744-1771. https://doi.org/10.1080/01431161.2012.726752 [ Links ]
MARTZ L and DE JONG E (1998) CATCH: A FORTRAN program for measuring catchment area from digital elevation models. Comput. GeoSci. 14 627-640. https://doi.org/10.1016/0098-3004(88)90018-0 [ Links ]
MERWADE V (2012) Watershed and stream network delineation using ArcHydro tools. URL: http://web.ics.purdue.edu/~vmerwade/education/terrain_processing.pdf [ Links ]
MOORE ID and WILSON JP (1992) Length-slope factors for the revised universal soil loss equation: simplified method of estimation. J. Soil Water Conserv. 47 423-428. [ Links ]
MUKHERJEE S, GARG RD and MUKHERJEE S (2011) Effect of systematic error on DEM and its derived attributes: a case study on Dehradun area using Cartosat-1 stereo data. Ind. J. Landscape Syst. Ecol. Stud. 34 45-58. [ Links ]
MUKHERJEE S, JOSHI PK, MUKHERJEE S, GHOSH A, GARG RD and MUKHOPADHYAY A (2013) Evaluation of vertical accuracy of open source Digital Elevation Model (DEM. Int. J. Appl. Earth Obs. Geoinf. 21 205-217. https://doi.org/10.1016/j.jag.2012.09.004 [ Links ]
MULDER VL, DE BRUIN S, SCHAEPMAN ME and MAYR TR (2011) The use of remote sensing in soil and terrain mapping - A review. Geoderma 162 1-19. https://doi.org/10.1016/j.geoderma.2010.12.018 [ Links ]
NELSON A, REUTER HI and GESSLER P (2009) DEM production methods and sources. In: Hengl T and Reuter HI (eds) Geomorphometry: Concepts, Software, Applications. Elsevier, Oxford. https://doi.org/10.1016/S0166-2481(08)00003-2 [ Links ]
O'ALLAGHAN JF AND MARK DM (1984) The extraction of drainage networks from digital elevation data. Comput. Vision Graphics Image Process. 28 323-344. https://doi.org/10.1016/S0734-189X(84)80011-0 [ Links ]
PATEL A, KATIYAR SK and PRASAD V (2016) Performances evaluation of different open source DEM using Differential Global Positioning System (DGPS). Egyp. J. Remote Sens. Space Sci. 19 7-16. https://doi.org/10.1016/j.ejrs.2015.12.004 [ Links ]
PERICA S and FOUFOULA-GEORGIOU E (1996) Model for multiscale disaggregation of spatial rainfall based on coupling meteorological and scaling descriptions. J. Geophys. Res. 101 26347-26361. https://doi.org/10.1029/96JD01870 [ Links ]
PONTIUS RG, BOERSMA W, CASTELLA J-C, CLARKE K, DE NIJS T, DIETZEL C, DUAN Z, FOSTING E, GOLDSTEIN N, KOK K and co-authors (2008) Comparing the input, output, and validation maps for several models of land change. Ann. Reg. Sci. 42 11-37. https://doi.org/10.1007/s00168-007-0138-2 [ Links ]
RAWAT KS, SINGH SK, SINGH MI and GARG BI (2019) Comparative evaluation of vertical accuracy of elevated points with ground control points from ASTER DEM and SRTM DEM with respect to CARTOSAT-1 DEM. Remote Sens. Appl. Soc. Environ. 13 289-297. https://doi.org/10.1016/j.rsase.2018.11.005 [ Links ]
RENSSEN H and KNOOP JM (2000) A global river routing network for use in hydrological modeling. J. Hydrol. 230 230-243. https://doi.org/10.1016/S0022-1694(00)00178-5 [ Links ]
RODRIQUEZ E, MORRIS CS and BELZ JE (2005) A global assessment of the SRTM performance. Photogram. Eng. Remote Sens. 72 249-260. https://doi.org/10.14358/PERS.72.3.249 [ Links ]
SHARMA A and TIWARI KN (2014) A comparative appraisal of hydrological behaviour of SRTM DEM at catchment level. J. Hydrol. 519 1394-1404. https://doi.org/10.1016/j.jhydrol.2014.08.062 [ Links ]
SHARMA A, TIWARI K and BHADORIA P (2010) Quality assessment of contour interpolated digital elevation models in a diverse topography. Int. J. Ecol. Dev. 15 26-42. [ Links ]
TAN ML, FICLIN DL, DIXON B, IBRAHIM AL, YUSOP Z and CHAPLOT V (2015) Impacts of DEM resolution, source, and resampling technique on SWAT-simulated steamflow. Appl. Geogr. 63 357v368. https://doi.org/10.1016/j.apgeog.2015.07.014 [ Links ]
TARBOTON G (2003) Watershed delineation from Digital Elevation Models. URL: http://www.crwr.utexas.edu/gis/gishydro04/Introduction/Exercises/Ex4.htm (Accessed 30 September 2014). [ Links ]
TAREKEGN TH, HAILE AT, REINTJIE ST, REGGIANI P and AALKEMA D (2010) Assessment of an ASTER-generated DEM for 2D hydrodynamic flood modeling. Int. J. Appl. Earth Obs. Geoinf. 12 457-465. https://doi.org/10.1016/j.jag.2010.05.007 [ Links ]
THOMAS J, JOSEPH S, THRIVIKRAMJI KP and ARUNKUMAR KS (2014) Sensitivity of digital elevation models: The scenario from two tropical mountain river basins of the Western Ghats, India. Geosci. Front. 5 893-909. https://doi.org/10.1016/j.gsf.2013.12.008 [ Links ]
TURCOTTE R, FORTIN JP, ROUSSEAU AN, MASSICOTTE S and VILLENEUVE JP (2001) Determination of the drainage structure of a watershed using a digital elevation model and a digital river and lake network. J. Hydrol. 240 225-242. https://doi.org/10.1016/S0022-1694(00)00342-5 [ Links ]
USGS (2016) SRTM30. URL: https://dds.cr.usgs.gov/srtm/version2_1/SRTM30/srtm30_documentation.pdf (Accessed 08 September 2016). [ Links ]
VAN NIEKERK A (2008) CLUES: A web-based land expert system for the Western Cape. PhD thesis, Stellenbosch University, South Africa. https://doi.org/10.1109/IGARSS.2009.5418291 [ Links ]
VAN NIEKERK A (2016) Stellenbosch University Digital Elevation Model (SUDEM). 2016 Edition. Centre for Geographical Analysis, Stellenbosch University, Stellenbosch. [ Links ]
VAZE J, TENG J and SPENCER G (2010) Impact of accuracy and resolution on topographic indices. Environ. Model. Softw. 25 1086-1098. https://doi.org/10.1016/j.envsoft.2010.03.014 [ Links ]
VOGT JV, COLOMBO R and BERTOLO F (2003) Deriving drainage networks and catchment boundaries: A new methodology combining digital elevation data and environmental characteristics. Geomorphology 53 281-298. https://doi.org/10.1016/S0169-555X(02)00319-7 [ Links ]
WALKER JP and WILLGOOSE GR (1999) On the effect of digital elevation model accuracy on hydrology and geomorphology. Water Resour. Res. 35 2259-2268. https://doi.org/10.1029/1999WR900034 [ Links ]
WANG HL, WU ZN and HU CH (2016) A comprehensive study of the effect of input data on hydrology and non-point source pollution modelling. Water Resour. Manage. 29 1505-1521. https://doi.org/10.1007/s11269-014-0890-x [ Links ]
WANG W, YANG X and YAO T (2011) Evaluation of ASTER GDEM and SRTM and their suitability in hydraulic modelling of a glacial lake outburst flood in southeast Tibet. Hydrol. Process. 26 213-225. https://doi.org/10.1002/hyp.8127 [ Links ]
WEEPENER HL, VAN DEN BERG HM, METZ M and HAMANDAWANA H (2012) The development of a hydrologically improved digital elevation model and derived products for South Africa based on the SRTM DEM. WRC Report No. 1908/1/11 1908/1/11. Water Research Commission, Pretoria. [ Links ]
WOLOCK DM and PRICE CV (1994) Effects of digital elevation model map scale and data resolution on topography-based watershed model. Water Resour. Res. 30 3041-30452. https://doi.org/10.1029/94WR01971 [ Links ]
WOODROW K, LINDSAY J and BERG AA (2016) Evaluating DEM conditioning techniques, elevation source data, and grid resolution for field-scale hydrological parameter extraction. J. Hydrol. 540 1022-1029. https://doi.org/10.1016/j.jhydrol.2016.07.018 [ Links ]
WU S, LI J and HUANG GH (2008) A study on DEM-derived topographic attributes for hydrologic applications: sensitivity to elevation data resolution. Appl.Geogr. 28 210-223. https://doi.org/10.1016/j.apgeog.2008.02.006 [ Links ]
ZHNAG JX, CHANG K-T and WU JQ (2008) Effects of DEM resolution and source on soil erosion modelling: a case study using the WEPP model. Int. J. Geogr. Inf. Sci. 22 (8) 925-942. https://doi.org/10.1080/13658810701776817 [ Links ]
Received 16 September 2016
Accepted in revised form 20 September 2019
* Corresponding author, email: ericm@sun.ac.za

