


Serviços Personalizados
Artigo
 Inglês (pdf)
 Artigo em XML
 Referências do artigo
Indicadores

Links relacionados
-
 Citado por Google
 -
 Similares em Google
Compartilhar

 Permalink
Water SA
versão On-line ISSN 1816-7950
versão impressa ISSN 0378-4738
Water SA vol.45 no.4 Pretoria Out. 2019
http://dx.doi.org/10.17159/wsa/2019.v45.i4.7538
RESEARCH PAPERS
Impacts of alien plant invasions on water resources and yields from the Western Cape Water Supply System (WCWSS)
David Le MaitreI, II, *; André GörgensIII; Gerald HowardIII; Nick WalkerIII, IV, V
INatural Resources and the Environment, CSIR, Stellenbosch
IICentre for Invasion Biology, Department of Botany and Zoology, Stellenbosch University, South Africa
IIIAurecon South Africa (Pty) Ltd, Cape Town, South Africa
IVERM, One Castle Park, Tower Hill, Bristol, United Kingdom
VInstitute of Water Studies, University of the Western Cape, Bellville, South Africa
ABSTRACT
A key motivation for managing invasive alien plant (IAP) species is their impacts on streamflows, which, for the wetter half of South Africa, are about 970 m3∙ha−1∙a−1 or 1 444 mill. m3∙a−1 (2.9% of naturalised mean annual runoff), comparable to forest plantations. However, the implications of these reductions for the reliability of yields from large water supply systems are less well known. The impacts on yields from the WCWSS were modelled under three invasion scenarios: 'Baseline' invasions; increased invasions by 2045 under 'No management'; and under 'Effective control' (i.e. minimal invasions). Monthly streamflow reductions (SFRs) by invasions were simulated using the Pitman rainfall−runoff catchment model, with taxon-specific mean annual and low-flow SFR factors for dryland (upland) invasions and crop factors for riparian invasions. These streamflow reduction sequences were input into the WCWSS yield model and the model was run in stochastic mode for the three scenarios. The 98% assured total system yields were predicted to be ±580 million m3∙a−1 under 'Effective control', compared with ±542 million m3∙a−1 under 'Baseline' invasions and ±450 mill. m3∙a−1 in 45 years' time with 'No management'. The 'Baseline' invasions already reduce the yield by 38 mill. m3∙a−1 (two thirds of the capacity of the Wemmershoek Dam) and, in 45 years' time with no clearing, the reductions would increase to 130 mill. m3∙a−1 (capacity of the Berg River Dam). Therefore IAP-related SFRs can have significant impacts on the yields of large, complex water supply systems. A key reason for this substantial impact on yields is that all the catchments in the WCWSS are invaded, and the invasions are increasing. Invasions also will cost more to clear in the future. So, the best option for all the water-users in the WCWSS is a combined effort to clear the catchments and protect their least expensive source of water.
Keywords: invasive alien plants, hydrological impacts; streamflow reduction, system yield
INTRODUCTION
Concerns about the impacts of alien plant invasions on streamflows were a key factor in the establishment of the Working for Water programme in October 1995 and in sustaining the programme since then (Le Maitre et al., 1996; Le Maitre et al., 2000; Van Wilgen et al., 1998). The streamflow reduction models used to estimate the flow reductions were based on long-term studies of the impacts of plantations on streamflows in catchments spread across South Africa compared with natural vegetation, particularly fynbos (Van Wyk, 1987; Van Lill et al., 1980; Bosch et al., 1980; Bosch and Von Gadow, 1990). The invasions often involved the same or ecologically similar tree species as those in the plantation studies, strengthening the argument that the reductions caused by invasions could match those observed in plantation studies (Le Maitre et al., 1996; Le Maitre, 2004). Ongoing research into water use by individual plants and stands of invasive species (Everson et al., 2014; Dzikiti et al., 2013; Meijninger and Jarmain, 2014; Dye and Jarmain, 2004) has confirmed the original findings, and shown that invasions can have substantial impacts on streamflows (see review by Le Maitre et al., 2015).
There is still an ongoing debate, though, about the impacts of flow reductions on the yields from large water supply schemes (WSS). Yet, there is every indication that the reductions in flows will result in reductions in yields, for a given level of assurance of supply, even when the storage dams in the WSS are large relative to the mean annual runoff (Le Maitre and Görgens, 2001; Cullis et al., 2007). These findings have not convinced some who argue that it is more cost-effective to build additional storage or transfer schemes to supply additional water than to clear invasions. While WSS infrastructure is necessary, and WSS capacity does need augmenting to meet increases in demand (Muller et al., 2015), investments in additional infrastructure can be unwise if the reductions more than offset the gains provided by the infrastructure, or if alternative water resources are considerably more expensive to develop or inherently more costly, such as desalinisation. One way of comparing such investments is the unit reference value which calculates the net present value of the costs of different investments (e.g. in infrastructure) over the projected life-span of the infrastructure, and relates it to the volume of water yielded to derive a cost per m3 of water (Van Niekerk and Du Plessis, 2013).
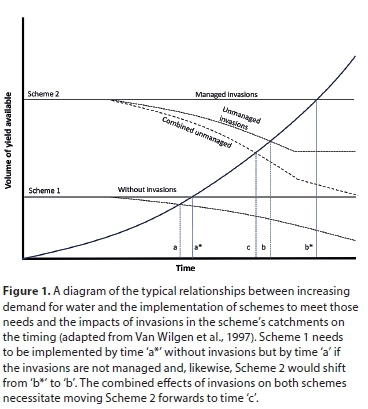
Although the unit reference value (URV) is a useful way of comparing investments in water supply infrastructure in relation to their yields, the way it is used in practice treats the decreased yields from the one option as being replaceable with yields from other options (Fig. 1). Van Wilgen et al. (1997) presented a simple model to illustrate how the impacts of unmanaged invasions on water yields would affect water yields over time. This model was very similar to the one in Fig. 1 and showed how the timing of the development of two water supply schemes was affected by invasions. Van Wilgen et al. (1997) also showed that differing initial stages of invasion and differing proportions of non-invadable areas would affect the outcomes, illustrated here by the different rates of reduction of flows from the catchments in the two schemes and stabilisation of the reductions from Scheme 2. With invasions, Scheme 1 would have to be operational by year 'a' to meet the rising demand but with clearing could be postponed to year 'a*'. Likewise Scheme 2 could be delayed from 'b' to 'b*'. However, their model failed to take into account the fact that without clearing, the ongoing decline in the yields from the original sources (Fig. 1), combined with the declining yield from Scheme 2, would require Scheme 2 to be operational by time 'c' and would also bring forward any future schemes. The WCWSS borders on the coast so desalinisation could be an option for meeting rising demand but, if there really were no more land-based options for increasing yields, the only choice would be to clear the invasions. However, by time 'c' arrives, the costs of clearing the invasions would also have increased significantly, a factor which also needs to be taken into consideration. The standard discounting model used in estimating the net present values for the URV would discount those future costs, essentially assuming that some innovative technologies would drastically lower the clearing costs by time 'c', but this is highly unlikely to be the case. If anything, the costs are likely to be significantly higher because the currently relatively lightly invaded, rugged mountain areas which comprise much of the WCWSS's catchments would have become more densely invaded. Clearing these areas is very expensive as it requires fit, able and skilled people, and expensive safety equipment, as well as the costs incurred in supporting workers camping-out for a week at a time where daily access is not efficient. The rate at which invaders are cleared also is low because the people have to use ropes for safety and moving between plants and safely securing themselves is very time consuming. In other words, if there is a finite yield of water from the current WSS, and this will be significantly reduced by allowing alien plants to invade the catchments, then clearing now would be the best option for securing overall yields in the long-term, even if the unit reference values are higher. Thus, clearing invasions now represents a much wiser investment of resources than deferring clearing. If this is so, then it provides a sound rationale for ensuring that a portion of the revenue realised from supplying water to users is dedicated to clearing the catchment and ensuring that invasions are cleared as rapidly as possible to as low a density as possible, and the catchment maintained in that state.
This paper focuses on the potential impact of invasions on the water yields of the Western Cape Water Supply System (WCWSS) which supplies water to the City of Cape Town as well as some adjacent local authorities and irrigation schemes Van Wilgen et al. (1997) found that clearing of invasive alien plants in the catchment of the Berg River Dam, then known as the Skuifraam scheme, would deliver water at a unit reference value of 0.57 ZAR∙m−3 compared with 0.59 ZAR∙m−3 without clearing over a 45-year period. The modelling used a discount rate of 8% and increases in invasion densities were driven by fires every 15 years, this being the desired fire return period in fynbos. Clearing of invasions in the Theewaterskloof Dam catchment, which was more heavily invaded than the Berg River Dam catchment, would be much more cost effective, with a unit reference value of 0.08 ZAR∙m−3 compared with 0.59 ZAR∙m−3 without clearing. This study, among others, motivated the then Department of Water Affairs to ensure that provision was made for alien plant clearing in the budget for the construction of the Berg River Dam (Geland et al., 2008). The funding provided for the clearing of pine plantations and invasions on the lower slopes within the catchment of the dam itself by the construction company. In addition, the Working for Water Programme contributed funding for the clearing of the rest of the catchment and areas situated below the dam wall.
Our study area included the entire WCWSS and used updates of the streamflow reduction models (Le Maitre et al., 2013), which allowed for distinctions between plant species and between riparian and non-riparian invasions, to estimate the impacts on yields.
STUDY AREA
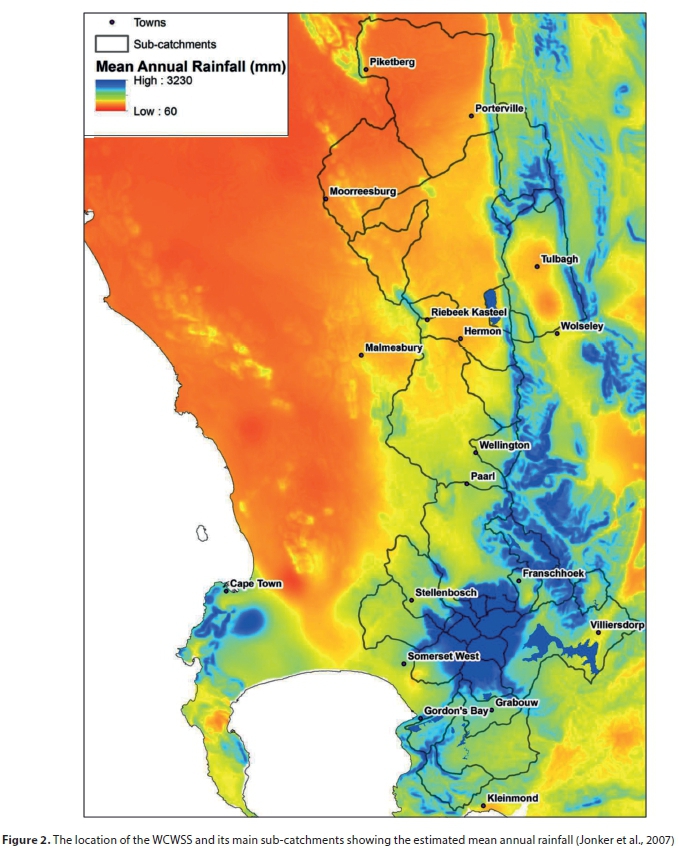
The study is located in a set of catchments to the west and north of the Cape Metropole (CM) in the Western Cape Province (https://www.dwa.gov.za/Projects/RS_WC_WSS/) (DWS, 2014) (Fig. 2). The WCWSS includes catchments located in the headwaters of different river systems in the Boland mountains which receive the highest rainfall in South Africa (Fig. 2). The WCWSS has a complex set of inter-basin water transfer systems which allow water to be provided to different parts of the Cape Metropole (CM), to neighbouring towns and to various irrigation schemes. The main transfer is from the Theewaterskloof Dam in the Riviersonderend catchment (H6) to the CM via a tunnel system that links it to the Berg (G1) and Eerste River (G2) catchments. Water is also transferred to the CM from the Steenbras (G4) and Palmiet (G4) catchments and from the Berg River and Wemmershoek Dams in the Berg River catchment (G1). The Voëlvlei Dam transfers water from the Klein Berg and 24 Rivers catchments to parts of the CM and towns in the northern part of the Berg River catchment. The WCWSS can yield about 580 mill. m3∙a−1 at a 98% level of supply assurance (i.e. a 1 in 50 year probability of not being able to supply this volume of water). Further optimisation of the storage in the WCWSS could increase the yield to 596 mill. m3∙a−1, at the same level of assurance.
METHODS
Alien plant invasion data
Datasets on alien plant invasions were obtained from a range of sources, updated and combined to produce a dataset for the whole area covered by the catchments in the WCWSS. The spatial datasets were as follows:
1.Invasion mapping done for an assessment of water availability in the Berg Water Management Area (WMA 19) carried out by Aurecon (supplied by Cheryl Beuster of Aurecon) and known as the Berg WAAS (DWAF, 2010). This dataset was edited to correct species attribute data as verified in the field, mainly where pines were listed when the actual dominants were Populus species, Eucalyptus species and Acacia species. The plantation dataset from this same study was checked to confirm whether or not these areas were plantations and not unmanaged invasions.
2.Data from CapeNature based on mapping of the invasions in the management compartments in the nature reserves that overlapped with the study catchments (supplied by Therese Forsyth). This mapping was done in 2010/11.
3.In the Upper Berg (G10A) information was taken from mapping done by the CSIR for the Working for Water programme in 2000. This was cross-checked with data on the pre-treatment state of areas cleared under Working for Water contracts. Data extracted from the Working for Water Information Management System were used to refine the information on invasions in both the Franschhoek River and Berg River catchments.
4.Data for invasions in the lower catchment from mapping done for local municipalities in the early 2000s for the CAPE Fine-scale Conservation Planning Studies, and the West Coast invasion mapping done for the CAPE project in 1999. These datasets were cross-checked and compared with Google Earth images to reflect the state of invasions in the late-2000s to bring them in line with the Berg WAAS.
5.Additional polygon data were mapped in Google Earth from images dating from the early to middle 2000s to avoid including more recent clearing operations.
The species data for the combined set was edited to ensure that the species names and density values were consistent. Each of the invaded units (polygons) was identified as being riparian or non-riparian, or one where groundwater could be accessed by plant root systems. This information was required for the estimation of the hydrological impacts as an indication of relative water availability (Le Maitre et al., 1996; Le Maitre et al., 1999, 2013). Where necessary, invaded polygons were sub-divided to define the riparian sections more accurately. The datasets were then combined with data on the sub-catchment boundaries of the WCWSS to provide information on the extent and state of invasions in each of the sub-catchments in dryland, riparian and groundwater settings.
The existing invasions were then projected forwards for 45 years using a sigmoidal curve for the spread as has been found in many studies of invasions (Le Maitre et al., 2002; Hengeveld, 1989; Birks, 1989), a spread rate of 10% per year (Van Wilgen and Le Maitre, 2013) and a densification rate of 1% per year. The use of this model results in slow initial invasion followed by a rapid increase which then slows as the invadable land becomes fully occupied. The National Land Cover 2000 dataset (Van den Berg et al., 2008) was used to extract the remaining natural (i.e. invadable) areas in each sub-catchment by excluding all the transformed land classes (e.g. cultivated, forest plantation, urbanised). The river lines from 1:50 000 topographic map series were buffered to create a layer which defined the riparian zones. Areas mapped in the land-types (LTSS, 1972-2002) as having deep sandy soils were used to define areas where groundwater would be accessible to plant root systems (Le Maitre et al., 2013). This information was used to divide the potentially invadable areas into drylands, riparian and groundwater access for the spread modelling. The projection of the invasions was then done for each sub-catchment in a spreadsheet.
Invasion scenarios
The approach taken in this study is the same as was used in previous studies of the effects of 'No management' on invasions (Le Maitre et al., 2002; Van Wilgen et al., 1997). We selected the year 2000 as the base year for the simulations and projected invasions forwards to 2045 because 45 years generally is used as the life-span of the infrastructure in assurance of supply studies like this one. The 2000 invasion data were used to establish the 'Baseline' scenario, with the projected invasions in the year 2045 providing the 'No management' scenario and removal of all invasions the 'Effective management' scenario.
Estimating streamflow reductions
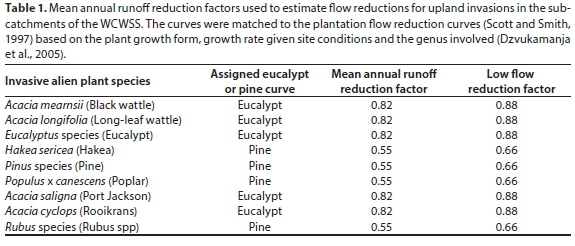
One of the criticisms levelled at the original flow reduction model developed for invasions (Le Maitre et al., 1996) was that the reductions were estimated as the equivalent depth (i.e. mm), which can result in overestimations. This was addressed by revising the approach to estimate proportional reductions (Dzvukamanja et al., 2005; Le Maitre et al., 2013), like those formerly used to estimate reductions after commercial afforestation (Scott and Smith, 1997). This meant that reductions caused by dryland invasions could be estimated by matching the plant growth and growth form characteristics to those used in the plantation streamflow reduction models (Table 1).
Whilst this approach can be used for dryland invasions, it is likely to underestimate water-use in riparian invasions or where groundwater is accessible (Le Maitre et al., 2015). In riparian and groundwater settings evaporation from vegetation is driven mainly by the available energy and can exceed the annual rainfall if sufficient water is available (Dye and Jarmain, 2004; Everson et al., 2014; Le Maitre et al., 2015), providing the plants' hydraulic conductivity is high enough and they do not regulate their transpiration by closing stomata when internal moisture stress or vapour pressure deficits are high (Manzoni et al., 2013; Calder, 1991; Whitehead and Beadle, 2004; Jarvis and McNaughton, 1986).
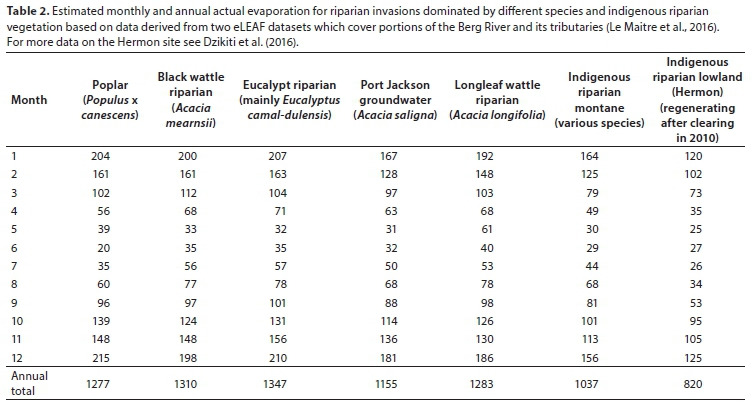
The evaporation from riparian or groundwater-linked stands of invading plants can be estimated using micrometeorological techniques or remote sensing. The CSIR obtained high-resolution, remote-sensing estimates of evaporation (Et) for two sample areas in the upper part of the Berg River catchment from the eLEAF Competence Centre in The Netherlands - these being Franschhoek to Klapmuts, and the Berg River floodplain for 5 km upstream of Hermon (Le Maitre et al., 2016). The Et was estimated using the proprietary Surface Energy Balance (SEBAL) model (Bastiaanssen et al., 1998) as part of a study of irrigation water-use in the wine and deciduous fruit growing areas of the Western Cape, known as Fruitlook (http://fruitlook.co.za/). eLEAF provided estimates of the weekly evaporation from 2 October 2013 to 29 April 2014 and for individual cloud-free days which coincided with satellite passes from May to September 2014. The data are at a resolution of 20 x 20 m which is suitable for estimating annual evaporation from fairly narrow strips of riparian vegetation.
Riparian invasions which overlapped the two sample areas were selected from the mapped data and screened for those dominated by particular species and having natural riparian vegetation in good condition. Invaded areas situated on steep southerly aspects were avoided as they are subject to topographic shading effects which are a problem for energy-balance-based methods like SEBAL. Evaporation data for each of the sample periods was extracted and used to calculate the monthly and annual evaporation. The weekly data were simply summed as they provided a continuous record. The single day data for the winter period were multiplied up by the number of days in the month to calculate the corresponding monthly totals (Table 2). This approach could overestimate the monthly total as there are many cloudy days, but a comparison with measured evaporation for the same days and for the month at a site near Hermon (Dzikiti et al., 2016) suggested that the overestimate for those months was not significant. However, the SEBAL data were found to overestimate evaporation by about 20% compared with ground-based measurements. Unfortunately it is difficult to correct for this for all the invaded areas without more ground-truthing at other sites, especially in montane environments. However, what really matters for the modelling is the difference in the evaporation from invaded riparian and natural riparian areas which is less influenced by this systematic error. The values that were obtained are in line with those from other studies for similar species, for example Acacia mearnsii (Dye and Jarmain, 2004), especially given that subsequent work has found much greater interception losses in stands of this species (Everson et al., 2014).
Modelling streamflow reductions
Flow reductions for invaded upland areas were estimated from taxon-specific streamflow reduction factors (Table 1). In areas where groundwater was likely to be accessible to invading plants (e.g. deep sandy soils), the upland flow reduction factors were increased by 20% to allow for the greater water availability (Van Wilgen et al., 2008). Riparian IAPs have relatively direct access to water, both in the riparian soil and flowing past from upstream. The impacts of riparian invasions were estimated using data on the actual evapotranspiration for the different taxa (Table 2). A spread-sheet was set up for each sub-catchment to generate a time series of riparian streamflow reduction as follows: (i) Multiply the invaded riparian area in the sub-catchment for particular taxa by the 12 relevant mean actual monthly evapotranspiration values (Table 2); (ii) determine the 12 incremental mean monthly evapotranspiration values from each taxon after accounting for the mean monthly evapotranspiration from 'natural' riparian vegetation (indigenous montane); and (iii) for each taxon generate a time series of dynamically-varying incremental monthly evapotranspiration values by inverse weightings derived from the sub-catchment monthly rainfall sequence, standardised to reproduce the 12 mean incremental values derived in step (ii) above. This inverse procedure ensured that, during any high-rainfall month, the incremental evapotranspiration was less than the equivalent value in Table 2 for that month and vice versa, while preserving the 12 long-term means. The magnitude of the riparian streamflow reduction in several catchments was so small that it became necessary to add the riparian SFRs for several catchments together. A total of seven riparian streamflow reduction locations were used in the yield model to assess the flow reductions evenly throughout the WCWSS.
Configuring and running the Pitman rainfall−runoff and WRYM system yield models
The full set of configurations of the Pitman (WRSM2000) rainfall−runoff catchment model for all the sub-catchments used in the Berg WAAS (DWAF, 2010) was de-archived and checked for functionality. The invaded area coverages were intersected with the individual sub-catchment boundaries used in the WCWSS WRYM system yield model (hereafter WRYM) and the individual IAP taxon areas, and their densities, quantified on a sub-catchment basis. These data were then used as input to the Pitman catchment model for the generation of monthly SFR sequences per sub-catchment for each of the three scenarios. The information on the invasions and streamflow reductions was included in the Pitman model configuration files and the model was then run to generate sequences of monthly streamflows for all sub-catchments for the three invasion scenarios. These streamflows were used to populate the latest configuration of the WRYM (DWS, 2014).
The WRYM model configuration was modified to accommodate a large number of additional SFR 'demand' nodes necessitated by the updated IAP mapping and the scenarios. The Pitman-generated SFR sequences were input into the system model as 'demand' files at each of the aforementioned nodes. The historical time period covered by the WRYM simulations is 77 hydrological years (1928/29-2005/06). The system model was subsequently run in stochastic mode to determine yield-assurance relationships for the three scenarios. For this purpose, and for each scenario, 201 different sets of equally likely stochastic natural streamflow sequences, based on the historical sequence, were generated for all the streamflow input nodes.
RESULTS
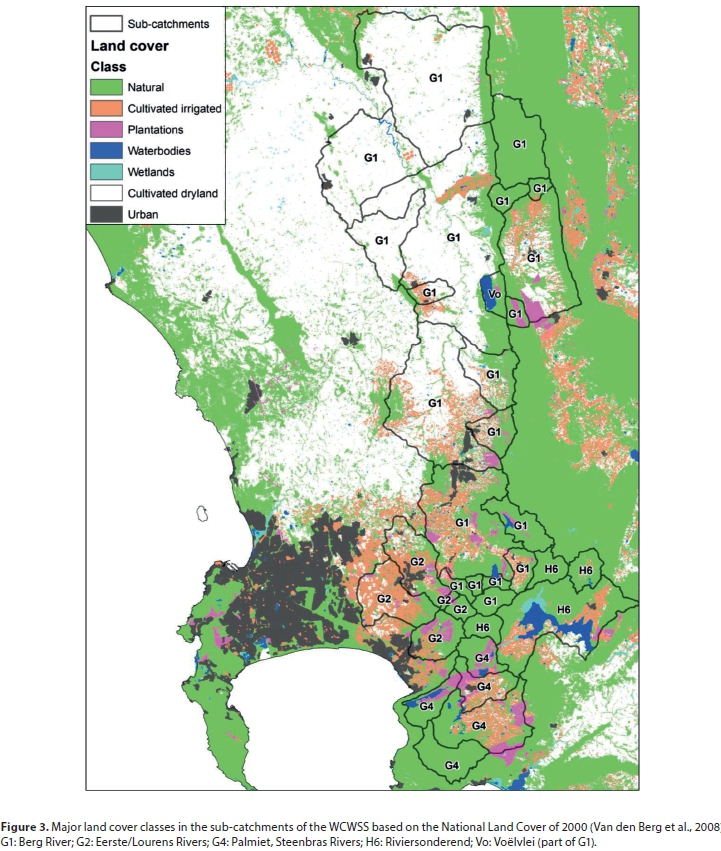
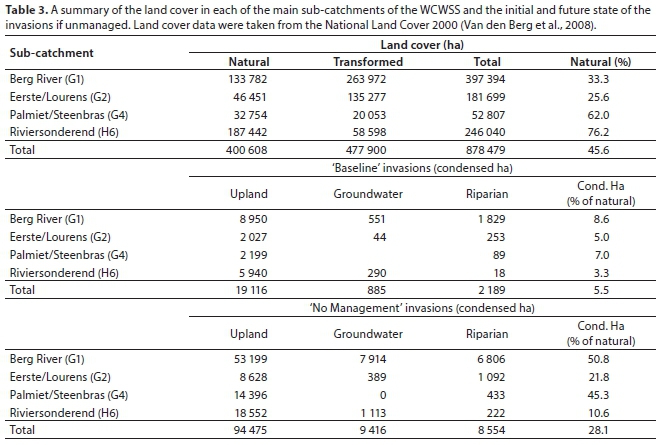
More than half of the total area of the WCWSS catchments has been transformed (Table 3, Fig. 3) into either dryland or irrigated agriculture, primarily vines and deciduous fruit. The catchments that are still mainly natural include the Riviersonderend, where most of the catchment above the Theewaterskloof Dam is still natural fynbos, and the Palmiet and Steenbras catchments in the Hottentots-Holland Nature Reserve, which are still mainly natural fynbos. Virtually all the valley floor and lower to middle slopes in the Berg River sub-catchments have been cultivated, so that only about 33.3% is still natural vegetation.
Alien plant invasions
In the 'Baseline' scenario, the condensed area of alien plant invasions was 22 190 ha or 5.5% of the natural vegetation of the WCWSS (Table 3), ranging from 8.6% in the Berg River to 3.3% of the Riviersonderend catchment (The condensed area is the equivalent dense area (i.e. 10 ha with 50% cover ≡ 5 condensed ha). Most of the invasions were not in in riparian areas or in areas where groundwater is accessible, with the latter (deep sandy soils) being most prevalent in the Berg and Riviersonderend catchments. The Berg River catchment has the most extensive riparian invasions (16.2% of the total) which occur along the Berg itself and along most of its tributaries, and are dominated by eucalypts and black wattle. Almost all the remaining natural vegetation in the WCWSS is invaded to some degree (Fig. 4). The most densely invaded areas are situated in the upper Berg and upper Riviersonderend catchments, particularly between Villiersdorp and Paarl (Fig. 4). This is important because this is also the portion of the WCWSS which gets the highest rainfall and generates most of the runoff (Fig. 2).
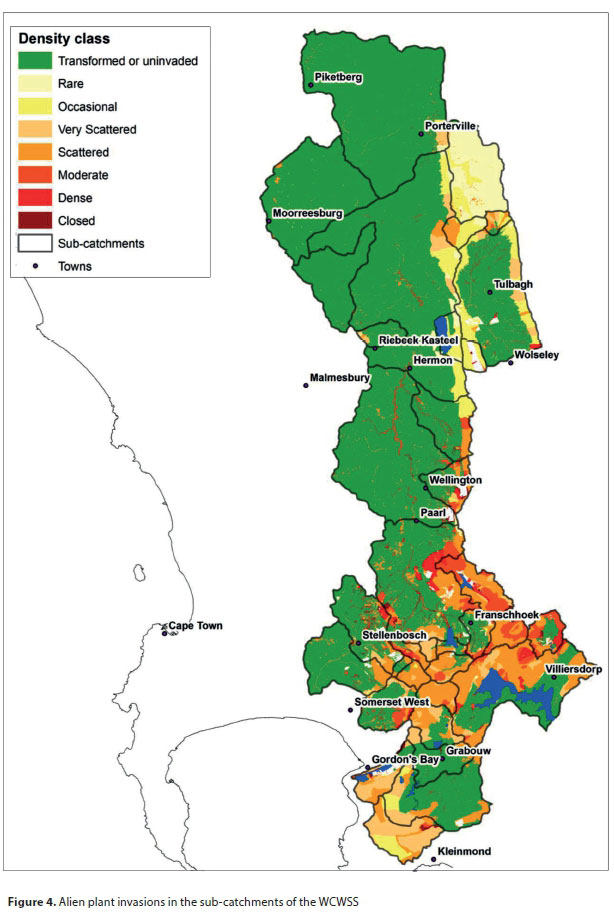
By 2045 with 'No management', the condensed invaded area equates to about 112 000 ha or 28.1% of the remaining natural vegetation (Table 3). The Berg River is the most invaded, with the condensed area being 50.8% of the natural vegetation, in other words a mean density of about 50%. The Riviersonderend catchment is the least invaded at 10.6%, mainly because it was less invaded than the Berg initially, but the invasions are concentrated in high runoff areas. The most extensive invasions are by pines which have a condensed area of about 11 000 ha in 2000 and a projected 70 000 ha in 2045.
Flow reductions
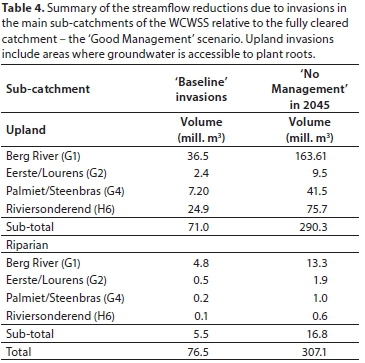
The mean annual streamflow reductions for upland and riparian invasions in each of the sub-catchments are substantial, especially with 'No management' (Table 4). The greatest reductions for 'Baseline' upland invasions are found in the Berg and Riviersonderend sub-catchments with the total reductions for upland invasions coming to 71.0 mill. m3∙a−1. Reductions due to riparian invasions are substantial in the Berg River, but much lower in the other catchments. With 'No management' the total reductions due to upland invasions increase substantially to 307 mill. m3∙a−1, especially in the Berg River and Riviersonderend where they could increase 4.5 and 3.0 times, respectively (Table 4). Under 'No management', reductions due to riparian invasions also increase substantially to 16.8 mill. m3∙a−1 (3.1 fold), with most of the reductions being found in the Berg River catchment. The relatively low increases in the Riviersonderend catchment are due mainly to the relatively low density of invasions in the 'Baseline' state (Table 3) which results in relatively low rates of increase in the density. The greater density of the invasions in the Berg River catchment leads to a more rapid increase in density and greater reductions under 'No management', emphasising the importance of controlling invasions at an early stage.
Stochastic yield reductions
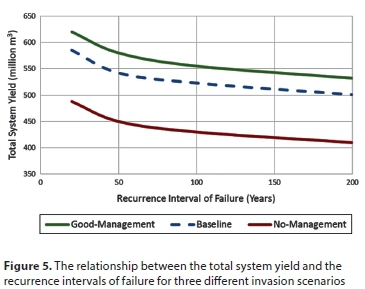
The stochastic analysis of the WCWSS outlined above demonstrate that the streamflow reductions for the 'Baseline' and 'No management' scenarios result in significant impacts on the WCWSS yield over the range failure recurrence intervals (Fig. 5). The yield for the 1:50 year recurrence interval of failure (98% assurance) is widely used in long-term planning for domestic supplies. At this level of assurance, the yields for the WCWSS are 580 mill. m3∙a−1 for the 'Effective management', 542 mill. m3∙a−1 for the 'Baseline' and 450 mill. m3∙a−1 for the 'No management' scenarios. The 'Baseline' reduction of 38 mill. m3∙a−1 is equivalent to losing two thirds of the capacity of Wemmershoek Dam every year, or 6.6% of the WCWSS yield of 580 mill. m3∙a−1 at 98% assurance of supply. However, under the 'No management' scenario, the reduction increases to 130 mill. m3∙a−1, which is 22.4% of the WCWSS yield, equivalent to losing the capacity of the Berg River Dam each year.
Spatial variability of yield reductions
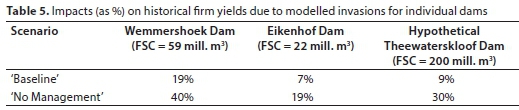
We examined the spatial variability of streamflow reduction impacts on yields within individual components of the WCWSS for the current and future invasion scenarios by determined the so-called 'historical firm yields' (HFYs) of three dams which are not affected by inter-catchment transfers for the period 1928-2005 (The HFY is determined by increasing the total abstractions in the modelled system by trial-and-error until the modelled system narrowly fails one year during the modelled historical period; i.e. the modelling is not performed in stochastic mode). This approach ensured that the modelled HFY impacts would be solely due to the modelled invasions in each dam's catchment, i.e., that interpretation of these modelled impacts would not be confounded by inter-catchment transfers. The three dams selected were Wemmershoek Dam in the Berg catchment, Eikenhof Dam in the Palmiet catchment and a hypothetical dam at the location of Theewaterskloof Dam in the Riviersonderend catchment. The reason for conducting this exercise for a hypothetical Theewaterskloof Dam is that, for the purposes of accommodating winter transfers of surplus inflows from the Berg River Dam into Theewaterskloof Dam, the operational full supply capacity (FSC) of the existing dam is about 200% larger than what the upstream catchment could sustain. The spatial differences of proportional impacts on yield due to invasive alien plant invasions (Table 5) are related primarily to a combination of two factors: the extent of invasions representing the 'Baseline' condition and the extent of invadable areas for the 'No management' condition.
Spatial variability of water supplies under scenarios of alien plant invasions
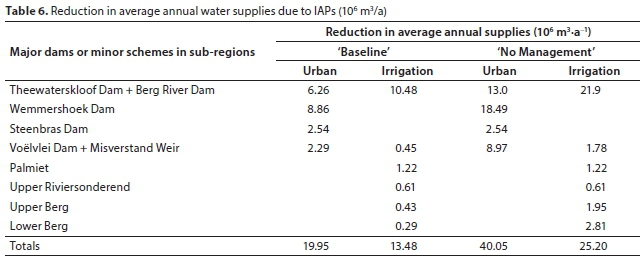
We also examined the long-term spatial variability of streamflow reduction impacts on average annual water supplies to individual water use sectors within individual components of the WCWSS for the 'Baseline' and 'No management' alien plant invasion scenarios for the period 1928-2005 hydrological years (Table 6). Given the close operational interactions between Theewaterskloof Dam and Berg River Dam, the outputs of the various modelled supply channels from these two dams to individual users were combined for the purposes of these calculations. For the same reason, the individual simulated supply volumes from Voëlvlei Dam and the Misverstand Weir on the Berg River were also combined. Furthermore, the various supply volumes for minor schemes and farm dams were combined by sub-region to enhance interpretation of the spatial variations of IAP impacts on average annual water supplies. For the complete WCWSS, the total mean annual impacts of IAPs on urban supplies (in absolute volume terms) far exceed the corresponding impacts on irrigation supplies (Table 6). The greatest modelled impact of IAPs on urban supplies (in absolute volume terms) is on water supplied from Wemmershoek Dam. Under 'No management' conditions IAPs could be expected to consume almost half of Wemmershoek's 98% assurance yield. The greatest modelled impact of IAPs on irrigation supplies (in absolute volume terms) is on water supplied from the combined Theewaterskloof and Berg River Dams.
DISCUSSION
This study clearly demonstrates that the reductions in streamflows as a result of the greater water-use of invading alien shrubs and trees can have substantial impacts on dam and system yields, even for the WCWSS which comprises several large dams. This confirms the findings of previous studies (Le Maitre and Görgens, 2003; Cullis et al., 2007). In this case the invasions are mainly in the headwater catchments (Fig. 4) and so have a significant impact on streamflows throughout the WCWSS and thus on the yields of each of the parts of the system and the whole WSS.
The fact that the reductions under the 'Baseline' invasions were already substantial, as well as the magnitude of the projected reductions, demonstrates why authorities need to take immediate action to clear catchments now rather than delaying action. If no actions are taken, or if they are delayed, then invasions rapidly increase in density and the costs of clearing increase. Although standard discounting approaches may make it seem less costly to develop alternative water sources, this is misleading. The impacts of alien plant invasions are not stationary so, unlike the finite yields from alternative schemes, the yields from invaded bulk water systems will decrease over time (Fig. 1) while the cost of clearing increases. The WCWSS is particularly vulnerable because all its water is supplied by invaded catchments, so that all parts of the WSS will experience reduced inflows and yields (Fig. 1), decreasing assurance of supply. All of the water that is available in the WCWSS catchments is already allocated to users or the ecological reserve, so the only way to increase the assurance of supply is by clearing invasions. Given this, there appears to be an inconsistency in the actions of the Department of Water and Sanitation. One the one hand, they use the provisions of the section of the National Water Act on Stream Flow Reduction Activities to restrict afforestation because of its impacts on stream flow (Dye and Versfeld, 2007). So, because the water resources in the WCWSS are already fully allocated, they would not have allowed further afforestation in the catchments supplying the WCWSS. Yet the Department seems to be unwilling to acknowledge that invasions by the same species used for forest plantations could be having similar impacts on runoff and, as we have demonstrated, the yields. In other words, they should be actively supporting clearing but are currently not doing so and it is not clear why this is the case.
Developing alternative schemes merely transfers the cost of dealing with invasions to future generations as there are no indications that technological advances will radically reduce clearing costs in the future. The severe water shortages currently being experienced by Cape Town and the neighbouring towns within the WCWSS demonstrate clearly that maintaining or increasing the yields of the existing WSS is critical for both immediate and long-term water security. The estimated current-day (Baseline) yield reduction of 38 mill. m3∙a−1 could have provided Cape Town with about 54 days of water per year at 700 ML∙d−1 had the invasions been cleared.
The results of the long-term studies of the hydrological impacts of plantations showed clearly that the reductions in low (dry season) flows are greater than those on annual flows (Scott and Smith, 1997), indicating a net depletion of catchment water storage. The depletion of catchment storage has been confirmed by other long-term studies where streamflow took time to recover after clearing (Scott and Lesch, 1997; Everson et al., 2014). These findings suggest that the effects of invasions are likely to be greatest during droughts, just when the maximum yield is required from the WSS. In addition, most of the invasions are in upland environments so, even if the invading plants are cleared, the depleted catchment storage will take time to replenish and reach levels where stream flows normalise again. This, in turn, makes a strong case for not waiting until droughts are underway before prioritising clearing.
At the moment, clearing in the WCWSS catchments is being funded almost entirely by the Extended Public Works Programme rather than directly by the water-users in the WCWSS. Although users are paying for their water, the funds raised by these levies are not being directly applied to environmental management in these catchments. Dedicated funding and monitoring of the clearing operation by those who pay is the best way to ensure that this is achieved. The simple message is that the sooner the water-users in the WCWSS invest in the clearing, including the use of biocontrol, the less it will cost them in total and the more they will benefit (Van Wilgen et al., 1997). By putting measures in place to ensure that the clearing is effective (Kraaij et al., 2017), they can ensure that this is a wise investment which will secure water supplies for them and for future generations. Although this study focused on the WCWSS, the same reasoning would apply to all water supply systems where the catchments have been invaded by species with similar hydrological impacts.
ACKNOWLEDGEMENTS
This study was funded by the Chief Directorate: Natural Resource Management of the Department of Environmental Affairs. We thank colleagues for comments and advice on the study and earlier drafts of the paper.
REFERENCES
BASTIAANSSEN WGM, MENENTI M, FEDDES RA and HOLTSLAG AAM (1998) A remote sensing surface energy balance algorithm for land (SEBAL). 1. Formulation. J. Hydrol. 212-213 198-212. https://doi.org/10.1016/S0022-1694(98)00253-4 [ Links ]
BIRKS HJB (1989) Holocene isochrone maps and patterns of tree-spreading in the British Isles. J. Biogeogr. 16 (6) 503. https://doi.org/10.2307/2845208 [ Links ]
BOSCH JM, VAN WILGEN BW and BANDS DP (1980) A model for comparing water yield from fynbos catchments burnt at different intervals. Water SA 4 191-196. [ Links ]
BOSCH JM and VON GADOW K (1990) Regulating afforestation for water conservation in South Africa. S. Afr. For. J. 153 41-54. https://doi.org/10.1080/00382167.1990.9629032 [ Links ]
CALDER IR (1991) Water use by forests at the plot and catchment scale. Commonwealth For. Rev. 75 19-30. [ Links ]
CULLIS JDS, GÖRGENS AHM and MARAIS C (2007) A strategic study of the impact of invasive alien plants in the high rainfall catchments and riparian zones of South Africa on total surface water yield. Water SA 33 35-42. https://doi.org/10.4314/wsa.v33i1.47869 [ Links ]
DWAF (2010) The Assessment of Water Availability in the Berg River Catchment (WMA 19) by means of Water Resource Related Models. Report No. 1. Summary Report. P WMA19/000/00/1209. DWAF Report No P WMA19/000/00/1209, Directorate National Water Resource Planning, Department of Water Affairs and Forestry, Pretoria. [ Links ]
DWS (2014) WC WSS Reconciliation Strategy Status Report October 2014. Prepared by Umvoto Africa (Pty) Ltd in association with WorleyParsons on behalf of the Directorate: National Water Resource Planning, Department of Water and Sanitation, Pretoria. [ Links ]
DYE P and JARMAIN C (2004) Water use by black wattle (Acacia mearnsii): implications for the link between removal of invading trees and catchment streamflow response. S. Afr. J. Sci. 100 40-44. [ Links ]
DYE PJ and POULTER AG (1995) A field demonstration of the effect on streamflow of clearing of invasive pine and wattle trees from a riparian zone. S. Afr. For. J. 173 27-30. https://doi.org/10.1080/00382167.1995.9629687 [ Links ]
DYE P and VERSFELD D (2007) Managing the hydrological impacts of South African plantation forests: An overview. For. Ecol. Manage. 251 (1-2) 121-128. https://doi.org/10.1016/j.foreco.2007.06.013 [ Links ]
DZIKITI S, GUSH MB, LE MAITRE DC, MAHERRY A, JOVANOVIC NZ, RAMOELO A and CHO MA (2016) Quantifying potential water savings from clearing invasive alien Eucalyptus camaldulensis using in situ and high resolution remote sensing data in the Berg River Catchment, Western Cape, South Africa. For. Ecol. Manage. 361 69-80. https://doi.org/10.1016/j.foreco.2015.11.009 [ Links ]
DZIKITI S, SCHACHTSCHNEIDER K, NAIKEN V, GUSH M, MOSES G and LE MAITRE DC (2013) Water relations and the effects of clearing invasive Prosopis trees on groundwater in an arid environment in the Northern Cape, South Africa. J. Arid Environ. 90 (0) 103-113. https://doi.org/10.1016/j.jaridenv.2012.10.015 [ Links ]
DZVUKAMANJA TN, GÖRGENS AHM and JONKER V (2005) Streamflow reduction modelling in water resource analysis. WRC Report No. 1221/1/05. Water Research Commission, Pretoria. [ Links ]
EVERSON CS, CLULOW AD, BECKER M, WATSON A, NGUBO C, BULCOCK H, MENGISTU M, LORENTZ S and DEMLIE M (2014) The long term impact of Acacia mearnsii trees on evaporation, streamflow, low flows and ground water resources. Phase II: Understanding the controlling environmental variables and soil water processes over a full crop rotation. WRC Report No. 2022/1/13. Water Research Commission, Pretoria. [ Links ]
GELAND C, LE MAITRE D, FORSYTH G and LOCHNER P (2008) Review and Update of the Business Plan for Alien Plant Clearing in the Assegaaibos Catchment of the Berg River Dam. Report No. CSIR/CAS/EMS/ER/2008/0007/A, Consulting and Analytical Services, CSIR, Stellenbosch. [ Links ]
HENGEVELD R (1989) Dynamics of Biological Invasions. Chapman and Hall, London. [ Links ]
JARVIS PG and MCNAUGHTON KG (1986) Stomatal control of transpiration: scaling up from leaf to region. Adv. Ecol. Res. 12 1-49. https://doi.org/10.1016/S0065-2504(08)60119-1 [ Links ]
JONKER V, HAYES L and BEUSTER J (2007) The Assessment of Water Availability in the Berg Catchment (WMA 19) by Means of Water Resource Related Models. Report No. 2: Rainfall Data Preparation and MAP Surface. Report No P WMA19/000/00/0407, Prepared by Ninham Shand in association with Umvoto Africa, Department of Water Affairs and Forestry, South Africa. [ Links ]
KRAAIJ T, BAARD JA, RIKHOTSO DR, COLE NS and VAN WILGEN BW (2017) Assessing the effectiveness of invasive alien plant management in a large fynbos protected area. Bothalia 47. https://doi.org/10.4102/abc.v47i2.2105 [ Links ]
LE MAITRE D, DZIKITI S and GUSH M (2016) Remote sensing data on evaporation for spatial and temporal extrapolation of site-specific data to landscapes and catchments. Report No. CSIR/NRE/ECOS/ER/2016/0019/B, Natural Resources and the Environment, CSIR, Stellenbosch. [ Links ]
LE MAITRE D and GÖRGENS A (2003) Impact of invasive alien vegetation on dam yields. WRC Report No. KV 141/03b. Water Research Commission, Pretoria. [ Links ]
LE MAITRE DC (2004) Predicting invasive species impacts on hydrological processes: the consequences of plant physiology for landscape processes. Weed Technol. 18 1408-1410. https://doi.org/10.1614/0890-037X(2004)018[1408:PISIOH]2.0.CO;2 [ Links ]
LE MAITRE DC, FORSYTH GG, DZIKITI S and GUSH MB (2013) Estimates of the impacts of invasive alien plants on water flows in South Africa. Report No. CSIR/NRE/ECO/ER/2013/0067/B. Natural Resources and the Environment, CSIR, Stellenbosch. [ Links ]
LE MAITRE DC and GÖRGENS AHM (2001) Potential impacts of invasive alien plants on reservoir yields in South Africa. In: Tenth South African National Hydrology Symposium, 26-28 September 2001, Pietermaritzburg. [ Links ]
LE MAITRE DC, GUSH MB and DZIKITI S (2015) Impacts of invading alien plant species on water flows at stand and catchment scales. AoB Plants 7 plv043. https://doi.org/10.1093/aobpla/plv043 [ Links ]
LE MAITRE DC, SCOTT DF and COLVIN C (1999) A review of information on interactions between vegetation and groundwater. Water SA 25 (2) 137-152. [ Links ]
LE MAITRE DC, VAN WILGEN BW, CHAPMAN RA and MCKELLY D (1996) Invasive plants and water resources in the Western Cape Province, South Africa: modelling the consequences of a lack of management. J. Appl. Ecol. 33 (1) 161-172. https://doi.org/10.2307/2405025 [ Links ]
LE MAITRE DC, VAN WILGEN BW, GELDERBLOM CM, BAILEY C, CHAPMAN RA and NEL JA (2002) Invasive alien trees and water resources in South Africa: case studies of the costs and benefits of management. For. Ecol. Manage. 160 (1-3) 143-159. https://doi.org/10.1016/S0378-1127(01)00474-1 [ Links ]
LE MAITRE DC, VERSFELD DB and CHAPMAN RA (2000) The impact of invading alien plants on surface water resources in South Africa: a preliminary assessment. Water SA 26 397-408. [ Links ]
LTSS (1972-2002) Land types of South Africa: Digital map (1:250 000 scale) and soil inventory databases. ARC-Institute for Soil, Climate and Water, Pretoria. [ Links ]
MANZONI S, VICO G, KATUL G, PALMROTH S, JACKSON RB and PORPORATO A (2013) Hydraulic limits on maximum plant transpiration and the emergence of the safety-efficiency trade-off. New Phytol. 198 (1) 169-178. https://doi.org/10.1111/nph.12126 [ Links ]
MEIJNINGER WML and JARMAIN C (2014) Satellite-based annual evaporation estimates of invasive alien plant species and native vegetation in South Africa. Water SA 40 (1) 95-107. https://doi.org/10.4314/wsa.v40i1.12 [ Links ]
MULLER M, BISWAS A, MARTIN-HURTADO R, TORTAJADA C, GREY D and SADOFF CW (2015) WATER. Built infrastructure is essential. Science 349 (6248) 585-586. https://doi.org/10.1126/science.aac7606 [ Links ]
PRINSLOO FW and SCOTT DF (1999) Streamflow responses to the clearing of alien invasive trees from riparian zones at three sites in the Western Cape Province. South. Afr. For. J. 185 (185) 1-7. https://doi.org/10.1080/10295925.1999.9631220 [ Links ]
SCOTT DF (1993) Managing riparian zone vegetation to sustain streamflow: results of paired catchment experiments in South Africa. Can. J. For. Res. 29 (7) 1149-1157. https://doi.org/10.1139/x99-042 [ Links ]
SCOTT DF and LESCH W (1997) Streamflow responses to afforestation with Eucalyptus grandis and Pinus patula and to felling in the Mokobulaan experimental catchments, South Africa. J. Hydrol. 199 (3-4) 360-377. https://doi.org/10.1016/S0022-1694(96)03336-7 [ Links ]
SCOTT DF and SMITH RE (1997) Preliminary empirical models to predict reductions in total and low flows resulting from afforestation. Water SA 23 (2) 135-140. [ Links ]
VAN DEN BERG EC, PLARRE C, VAN DEN BERG HM and THOMPSON MW (2008) The South African National Land Cover 2000. No. GW/A/2008/86, Agricultural Research Council (ARC) and Council for Scientific and Industrial Research (CSIR), Pretoria. [ Links ]
VAN LILL WS, KRUGER FJ and VAN WYK DB (1980) Streamflow responses to afforestation with Eucalyptus grandis Hill Ex Maiden and Pinus patula Schlecht. Et Cham. on streamflow from experimental catchments at Mokobulaan, Traansvaal. J. Hydrol. 45 107-118. https://doi.org/10.1016/0022-1694(80)90069-4 [ Links ]
VAN NIEKERK PH and DU PLESSIS JA (2013) Unit reference value: Application in appraising inter-basin water transfer projects. Water SA 39 (4) 549-554. https://doi.org/10.4314/wsa.v39i4.14 [ Links ]
VAN WILGEN BW and LE MAITRE DC (2013) Rates of spread in invasive alien plants in South Africa. Report No: CSIR/NRE/ECOS/ER/2013/0107A. Natural Resources and the Environment CSIR, Stellenbosch. [ Links ]
VAN WILGEN BW, LE MAITRE DC and COWLING RM (1998) Ecosystem services, efficiency, sustainability and equity: South Africa's Working for Water Programme. Trends Ecol. Evol. 13 (9) 378. https://doi.org/10.1016/S0169-5347(98)01434-7 [ Links ]
VAN WILGEN BW, LITTLE PR, CHAPMAN RA, GÖRGENS AHM, WILLEMS T and MARAIS C (1997) The sustainable development of water resources: History, financial costs, and benefits of alien plant control programmes. S. Afr. J. Sci. 93 (9) 404-411. [ Links ]
VAN WILGEN BW, REYERS B, LE MAITRE DC, RICHARDSON DM and SCHONEGEVEL L (2008) A biome-scale assessment of the impact of invasive alien plants on ecosystem services in South Africa. J. Environ. Manage. 89 (4) 336-349. https://doi.org/10.1016/j.jenvman.2007.06.015 [ Links ]
VAN WYK DB (1987) Some impacts of afforestation on streamflow in the Western Cape Province, South Africa. Water SA 13 31-36. [ Links ]
WHITEHEAD D and BEADLE CL (2004) Physiological regulation of productivity and water use in Eucalyptus: a review. For. Ecol. Manage. 193 (1-2) 113-140. https://doi.org/10.1016/j.foreco.2004.01.026 [ Links ]
Received 24 January 2018
Accepted in revised form 9 July 2019
* Corresponding author, email: dlmaitre@csir.co.za

