


Serviços Personalizados
Artigo
 Inglês (pdf)
 Artigo em XML
 Referências do artigo
Indicadores

Links relacionados
-
 Citado por Google
 -
 Similares em Google
Compartilhar

 Permalink
Water SA
versão On-line ISSN 1816-7950
versão impressa ISSN 0378-4738
Water SA vol.45 no.3 Pretoria Jul. 2019
http://dx.doi.org/10.17159/wsa/2019.v45.i3.6747
REVIEWS
Methods for the estimation of extreme rainfall events
KA JohnsonI, II, *; JC SmithersI, III, IV, V
ICentre for Water Resources Research, University of KwaZulu-Natal, Pietermaritzburg, South Africa
IICivil Engineering, School of Engineering, University of KwaZulu-Natal, Durban, South Africa
IIIBioresources Engineering, School of Engineering, University of KwaZulu-Natal, Pietermaritzburg, South Africa
IVJG Afrika, Hilton, Pietermaritzburg, South Africa
VNational Centre for Engineering in Agriculture, University of Southern Queensland, Toowoomba, Australia
ABSTRACT
The estimation of design rainfalls is necessary to estimate the exceedance probabilities of extreme floods required to design hydraulic structures and to quantify the risk of failure of these structures. New approaches to estimating extreme rainfall events are being developed internationally. This paper reviews methods for estimating design rainfalls, particularly extreme events, in South Africa and internationally, and highlights the need to update methods used for estimating extreme rainfall events in South Africa as a platform for future research.
Keywords: design rainfall, extreme events, estimation methods, probable maximum precipitation, South Africa
INTRODUCTION
The estimation of design rainfalls and design floods is required for the design of hydraulic structures such as bridges, culverts, dam spillways and urban stormwater drainage systems. Although establishing reliable estimates of design floods is challenging, they are necessary for flood risk management and to quantify the risk of failure of hydraulic structures (Kjeldsen et al., 2014; Madsen et al., 2009).
Design rainfall estimates are required as input for many methods used for design flood estimation, and are used in numerous engineering, as well as environmental and ecological conservation, design decisions, resulting in millions of rands of construction in South Africa each year (Schulze, 1984). Realistic and reliable estimates of design rainfalls, and hence design floods, are important for the preservation of human life and property (Pegram and Parak, 2004) and are required for adequate assessment of risk and economic impacts of failure, as the costs associated with repairs can be significant (Green et al., 2015).
According to Nathan and Weinmann (2013), design rainfall estimates associated with return periods ranging from 50 years to 2 000 years are considered to be in the large to rare range. Rare design rainfalls are essential for the design of high-hazard hydraulic structures as they provide more representative design floods for return periods between 100 years and probable maximum events (Green et al., 2016a).
In South Africa, numerous regional- and national-scale studies have focused on design rainfall estimations for daily and sub-daily durations. The most recent South African method for design rainfall estimation for short and long durations was developed by Smithers and Schulze (2003), which provides estimates for return periods ranging from 2 to 200 years. Since this study was completed, over a decade of additional rainfall data are available to update design rainfall estimates. Furthermore, Cullis et al. (2007) recommend that higher return period floods be used for the design of dams.
The Probable Maximum Precipitation (PMP) is an extreme rainfall quantity that is commonly used to derive the Probable Maximum Flood (PMF), which is used in the planning, design and risk assessment of high-hazard hydraulic structures (Chavan and Srinivas, 2015; Wang, 1984). Currently the South African National Committee on Large Dams (SANCOLD) Guidelines for the estimation of the PMF is dependent on the PMP (Smithers et al., 2014).
Numerous methods have been developed globally to estimate the PMP. In South Africa the PMP is determined using HRU report 1/72 (HRU, 1972), which was based on approximately 30 years of rainfall data from the 1930s to 1960s. The PMP is presented as an envelope of maximum observed storm values for meteorologically homogenous regions (Cullis et al., 2007). There has been no update in the development of PMP estimation since HRU (1972) and these guidelines are still used in professional practice today. The use of outdated PMP estimates potentially affects the accuracy of PMF estimations, and consequently the design of high-hazard hydraulic structures.
The urgent need to update the data and methods used for design flood estimation in South Africa has been highlighted by Smithers and Schulze (2003), Cullis et al. (2007), Görgens et al. (2007), Smithers (2012) and Van Vuuren et al. (2013). The need to update extreme design rainfalls is particularly highlighted by Smithers et al. (2014).
The objective of this paper is to present an overview of the existing methods and current practices of design rainfall estimation in South Africa and globally, with a particular focus on rare events, and to identify and discuss factors needed to improve the estimation of extreme rainfall quantities in South Africa as a platform for future research.
EXTREME RAINFALL ESTIMATION
This section introduces the concept of design rainfall estimation and Probable Maximum Precipitation, and briefly discusses the approaches for estimating these types of extreme rainfall events.
Design rainfall estimation
For the planning and design of hydraulic structures such as water and flood control structures, design flood estimates are needed (Haddad et al., 2011a). As such, flood frequency analysis is important due to its environmental and economic impacts (Pilgrim and Cordery, 1993). Design rainfall is an essential input for design flood estimations used to quantify the risk of failure of hydraulic structures (Madsen et al., 2009; Mamoon et al., 2014). Although there is no universal method for design flood estimation, many countries have derived their own standard techniques and guidelines, which typically include a probabilistic approach involving statistical analysis of observed flood data and mathematical modelling using rainfall-runoff techniques (Smithers and Schulze, 2003). Often there are inadequate quantities of observed streamflow data at a site, leading to the frequent use of rainfall-runoff event-based methods, which require a probabilistic estimation of rainfall for a critical duration. This estimation is known as design rainfall and comprises a depth of rainfall over a period of time, or intensity, associated with a given likelihood of exceedance or return period (Mamoon and Rahman, 2014). Design rainfall Depth-Duration-Frequency (DDF) relationships are primary inputs to rainfall-runoff models to estimate design floods and are widely used by engineers and hydrologists for water resources planning and design applications (Haddad et al., 2011b). As such, DDF relationships are a key concept in the design of hydraulic structures as they quantify risk and maximise design efficiencies by using recorded events to predict future exceedance possibilities (Smithers and Schulze, 2003).
Rainfall frequency analysis - at-site vs regional approaches
Rainfall frequency analysis can be based on Annual Maximum Series (AMS) or Partial Duration Series (PDS) (Madsen et al., 1997), using either an at-site analysis or a regional analysis (Stedinger et al., 1993). The AMS is the largest rainfall depth in each year for a given duration whilst the PDS takes into account all events above a specified threshold (Madsen et al., 1997). An at-site approach to rainfall frequency analysis uses rainfall records from a single site of interest (Hosking and Wallis, 1997). Long periods of records are needed for reliable frequency analyses. However, challenges arise as often many rainfall stations have insufficient rainfall records and a high degree of variability in rainfall characteristics, making the spatial interpolation of design rainfall characteristics difficult (Haddad et al., 2011a). Stedinger et al. (1993) stated that it is necessary to utilise data from similar neighbouring regions to account for insufficient at-site data for frequency analysis. This concept is referred to as a regional frequency analysis and uses data from numerous locations to estimate the frequency distribution of observed data at each location (Hosking and Wallis, 1997). In this way, time-limited sampling records are supplemented by using data from a large number of rainfall stations in a region (Haddad et al., 2011a). In regional frequency analysis it is assumed that the data from all gauged sites within a homogenous region can be combined to produce a single regional rainfall frequency curve. After appropriate rescaling, this curve is applicable anywhere in the region, to both gauged and ungauged sites. Key elements of regional frequency analysis include: identification of homogenous regions, determination of regional frequency curves, and a method for estimation of the at-site mean (scaling factor) at any location in the region (Parrett, 1997).
A regional index-flood type approach to frequency analysis based on L-moments was developed by Hosking and Wallis (1997) and is termed the Regional L-Moment Algorithm (RLMA). L-moments are statistical quantities that are derived from Probability Weighted Moments (PWMs), which were defined by Greenwood et al. (1979). They summarise the theoretical probability distributions and observed samples and can be used for parameter estimation, interval estimation and hypothesis testing. Vogel and Fennessy (1993) concluded that for the purpose of applications in hydrology, L-moments are always preferred over product moments.
Probable Maximum Precipitation
For the design of high-hazard structures, such as dams located upstream of populated areas, structures are commonly designed for the theoretically largest possible flood that could occur at a particular location in order to maximise safety and reliability (Shaw, 1994). One of the key concepts in the assessment of dam safety under extreme flood conditions for high hazard dams is the Probable Maximum Flood (PMF), which is the theoretical maximum flood that is expected to occur at a particular location due to the most severe combination of critical meteorological and hydrological conditions (Wang, 1984).
Estimation of the PMF may be undertaken by empirical, probabilistic or deterministic methods. In the case of deterministic methods, the estimation of an extreme design rainfall is used to derive the PMF. This extreme design rainfall, to which no return period can be attached, is known as the PMP (Chavan and Srinivas, 2015). PMP is defined by the World Meteorological Organization (WMO, 2009b p. xxvi) as 'the greatest depth of precipitation for a given duration meteorologically possible for a design watershed or a given storm area at a particular location at a particular time of year, with no allowance made for long-term climatic trends.' Prior to the 1950s the concept of a potential upper limit of precipitation was referred to as Maximum Possible Precipitation (MPP). The idea that maximum limits exist for all rainfall-producing elements and that these limits could be quantified by studies of natural processes was considered. However, as nature is not constrained to limits, this was determined to be impossible as the upper limit of rainfall could not be determined accurately (WMO, 2009b).
PMP estimation using WMO method
The Manual on Estimation of Probable Maximum Precipitation was first published in 1973 by the WMO. Since then two revisions have been published, the latest in 2009 (WMO, 2009b). The manual provides basic methods for estimating PMP and conditions under which these methods may be applied, allowing professionals to apply the methods, or combinations of methods, to their specific design conditions. There are two general approaches to PMP estimation: direct and indirect. The former is based on catchment area whilst the latter is based on storm area (WMO, 2009a; 2009b).
Direct approach
In the direct approach the PMP is estimated directly for a given duration and is based on the specific design catchment area for a particular project. The main steps involved in this approach are: (a) the determination of a storm model, (b) maximisation, and (c) derivation of the PMP. The storm model is a typical or ideal storm reflecting the characteristics of extreme precipitation over the design catchment. This extreme precipitation is likely to pose a serious threat of flooding in the project area. Maximisation involves maximising the storm performance. The PMP over a design catchment is then derived from the maximisation of the storm model. Thereafter the PMF can be calculated. WMO (2009a; 2009b) give details of the following methods for the determination of the storm model:
(a) Local storm maximisation method
(b) Storm transposition method
(c) Combination method
(d) Inferential method
Indirect approach
The indirect approach is based on the storm area, i.e., the area surrounded by isohyets. This approach is centred on the estimation of a group of PMPs, each varying in duration and area within a wide region. Thereafter the group of PMPs are converted into the PMP for the design catchment. WMO (2009b) highlights two commonly used methods based on storm area, viz., generalised estimation and statistical estimation.
Generalised estimation method
This method, referred to as the 'generalised storm maximisation and transposition method' in WMO (1984), is one of the most commonly used and accepted methods for PMP estimation. The United States National Weather Service (NWS) first introduced the concepts of storm maximisation and transposition in the late 1930s. During the early 1960s the NWS introduced the 'generalised' storm maximisation and transposition approach and later in 1973 the WMO documented these concepts in detail (Görgens et al., 2007). Generalised methods take into account site-specific meteorological conditions and, therefore, provide more reliable estimates when compared to statistical methods. However, significant time is required to perform generalised methods (WMO, 2009b).
The generalised estimation method is used for estimating the PMP for large meteorologically homogeneous regions. It is a physical approach that requires site-specific meteorological and geographical data. This method is applicable to specific catchments as well as large regions consisting of numerous catchments with a range of areas. It aims to generalise the areal mean precipitation depth within an isohyet. The observed rainfall of a storm is grouped into orographic and non-orographic rainfall. In orographic regions the precipitation occurs from the passing of weather systems in combination with orographic effects. For non-orographic zones it is assumed that precipitation occurs solely due to the passing of weather systems. Precipitation resulting from passing weather systems is known as convergence rainfall. The generalised estimation method involves the generalisation of convergence rainfall and utilises the depth-area-duration (DAD) generalisation of storms. In addition, this method involves the generalisation of the spatial/temporal distributions of PMP (WMO, 2009a).
Long periods of long-term rainfall data are needed for this method. Although this may be a time-consuming and expensive process, this method can lead to high accuracy and easy application of PMP results. PMP estimations can be determined for durations of 6-72 hours for catchments under 13 000 km2 in orographic regions and up to 52 000 km2 in non-orographic regions (WMO, 2009b). The procedure for the generalised estimation method for non-orographic regions is as follows:
(i) Identification of a high-efficiency storm: Selection of a major storm, based on observed data, with the assumption that their precipitation efficiency was near or at maximum.
(ii) Moisture maximisation: The moisture factors of high-efficiency storms are adjusted to their maximum. The maximum persisting 12-hour-100-kPa dew point for each storm is used as an index of the maximum available quantity of atmospheric water vapour. Next the corresponding precipitable water content to the maximum dew point for each storm is determined. NWS (1980) defines the precipitable water content as the depth of water vapour condensed into liquid in a column of air of unit cross section. The maximum persisting 12-hour dew point within 15 days of the seasonal maximum, or for the actual storm date for the study region and its surroundings, is determined. Thereafter, the corresponding precipitable water content for the 12-hour maximum persisting dew-point is determined. The observed storm rainfall quantities are then multiplied by the moisture maximisation ratio, Wm/Wswhere Wm represents the maximum precipitable water content (mm) and Ws is the precipitable water content estimated for the storm at dew point (mm). In some cases wind maximisation may be required. This is achieved by determining the maximum 24-hour average wind speed for each storm, which is multiplied by the precipitable water content to establish the maximum moisture inflow index.
(iii) Transposition: In large regions there may be areas that have not experienced extreme storm events or lack recorded data of extreme events observed in adjacent regions. Transposition involves translating observed storm characteristics from a location where extreme storm events have been observed to a location with inadequate record of such major storms. The boundaries of the area of transposability of each storm are defined and then each storm is transposed within these boundaries. The boundaries or limits of transposability are influenced by climate and geographic features of the region, the frequency of major storm events and the concentration of rainfall gauges within the region.
(iv) Enveloping: The maximised and transposed rainfall data from the largest values from the data set are plotted and used to identify a smooth curve of the rainfall data. Depth-area envelopes and depth-duration envelopes are plotted separately, and then used for the construction of DAD curves. For depth-duration envelopes, the largest maximised and transposed rainfall values are plotted for each duration and a smooth curve envelopes these values. In the case of depth-area envelopes, the maximum adjusted rainfall values for various areas and a specific duration are plotted. The depth-duration and depth-area enveloping can be done in one operation. The values plotted on the combination graph are taken from the enveloping of the depth-area and depth-duration curves, resulting in one value for each duration and area depicted on the graph. The PMP is then determined by the application of DAD enveloping values for the design catchment. PMF can then be determined based on the assumption that the flood created by the PMP is the possible maximum flood for the design area.
Statistical estimation method
Most PMP estimation procedures are based on meteorological analyses. However, sometimes site-specific meteorological data are not available. Statistical methods are useful in such cases (Fattahi et al., 2011). The most widely used statistical estimation method developed by Hershfield (1961; 1965), has been adopted by the WMO (2009b) as one of the standard methods for PMP estimation. This method takes into account actual historical data at a particular location and expresses it in terms of statistical parameters (Koutsoyiannis, 1999). The statistical estimation method is an approximate method applicable to small catchments with a collecting area of less than 1 000 km2. The maximum value Km in an observed storm series is statistically represented by the largest storm defined by Eq. 1:

where
Xm = maximum observed storm value
X-n-1 = mean value excluding the maximum value
Sn-1 = standard deviation excluding the maximum value
Hershfield (1965) developed a graphical relationship between enveloping values and means of annual series Km for different durations. This was based on more than 2 600 rainfall stations, of which approximately 90% were based in the USA. The envelope curve varies with duration as shown in Fig. 1. Using Fig. 1 to determine Km, the mean X-n and the standard deviation Sn are determined using rainfall data from a specific station in the design catchment. Thus Eq. 2 is used to determine the PMP.
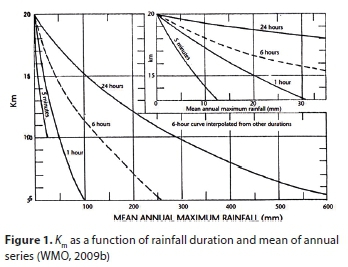

Furthermore, the coefficient of variation of the precipitation series for n years of data at a particular design station is given by Eq. 3:
The largest storm, Km, is a statistical representation of the maximum observed storms. This value is then transposed and corrected to the design station by computing the mean X-n and the coefficient of variation Cvn from the storm series in the design catchment. The PMP at any design station can be calculated using Eq. 4:

As the frequency factors used in Hershfield's method were generated from observations mostly based in the US, many countries have modified the Km factors to suit local conditions. Estimation of PMP by statistical methods has been successfully applied and documented by many countries, including India (Rakhecha and Clark, 2000), Malaysia (Desa et al., 2001), the Czech Republic (Rezacova et al., 2005) and Spain (Casas et al., 2011).
SOUTH AFRICA
Current practices of design rainfall and PMP estimation in South Africa are reviewed in this section. Furthermore, the need to update and modernise these methods and practices is highlighted.
Design rainfall estimation in South Africa
Numerous regional- and national-scale studies have focused on design rainfall estimation in South Africa, as cited by Smithers and Schulze (2003). Smithers and Schulze (2000a; 2000b; 2003) developed a regionalised index-storm approach based on L-moments for design rainfall estimation in South Africa. Smithers and Schulze (2000a) used digitised rainfall data from 172 recording rain gauges with at least 10 years of records for short duration (≤ 24 h) estimates. For longer durations (1-7 days), Smithers and Schulze (2000b) used daily rainfall data from 1 806 rainfall stations, all with at least 40 years of record. Prior to this, estimates for short-duration rainfall were last comprehensively produced in the 1980s and design rainfall depths for long durations were last estimated on a national scale by Adamson (1981).
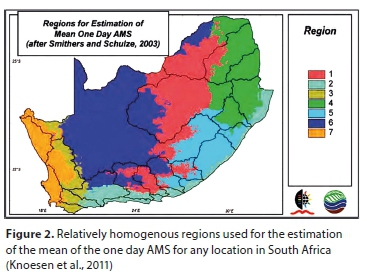
Identification of homogenous regions involves the assignment of sites to regions whose frequency distributions are considered to be relatively homogenous after appropriate scaling. Grouped sites undergo standard multivariate statistical analysis based on the similarity of the vectors (Hosking and Wallis, 1997). Smithers and Schulze (2003) performed regionalisation of sites by cluster analysis, using appropriate site characteristics, viz., latitude, longitude, altitude, a monthly index of the concentration of precipitation (%), Mean Annual Precipitation (MAP) (mm), an index of rainfall seasonality and distance from sea (m). For short-duration rainfall, 15 relatively homogenous clusters were identified and for long-duration rainfall 78 clusters were identified. The index-storm value used was the mean of the AMS. It is necessary to estimate the mean of the AMS for a required duration at a particular location in order to estimate the design rainfall depths at an ungauged location. A cluster analysis of site characteristics was used to group the 78 long-duration clusters into 7 regions for estimating the mean of the 1-day AMS (Fig. 2). Multiple linear regression relationships with site characteristics such as MAP, latitude and altitude, allow for the estimation of the mean of the AMS at any location in the country. For each homogenous region the regression coefficients and variables differ (Smithers and Schulze, 2003).
Smithers (1996) and Smithers and Schulze (2000a; 2000b) determined the General Extreme Value (GEV) distribution to be the most appropriate distribution for extreme rainfall estimation in South Africa. Regional growth curves which relate design rainfall, scaled by the mean of the AMS, to duration were derived for each cluster for durations ranging from 15 minutes to 7 days. Inconsistencies in the growth curves for the 24-hour duration were evident due to the use of different databases for sub-daily and daily rainfall. To overcome these inconsistencies and to improve the reliability of estimates, scale invariance characteristics were investigated by Smithers and Schulze (2003) and it was concluded that the growth curves were scale invariant. The growth curve for the 1-day duration was established to be the most reliable and hence could be applied to durations ranging from 5 minutes to 7 days. The daily rainfall database is utilised to estimate the mean of the AMS for all durations (Smithers and Schulze, 2003). The application of the Regional L-Moment Algorithm together with a Scale Invariance approach is termed the RLMA&SI. Based on the RLMA&SI procedures, reliable and consistent design rainfall estimates for return periods ranging from 2 to 200 years and durations from 5 minutes to 7 days were produced for South Africa.
Need to update design rainfall values in South Africa
The Water Research Commission (WRC), together with SANCOLD, identified the urgent need to update the data and methods used for design flood estimation in South Africa. This consequently resulted in the initiation of a draft plan for the National Flood Studies Programme (NFSP) by Smithers et al. (2014), which highlights a wide range of issues for research. The Rainfall Analysis Working Group identified research needs in terms of design rainfall estimation, particularly extreme events. Since the study by Smithers and Schulze (2003), more than a decade of additional rainfall data are available. Van Vuuren et al. (2013) noted that extended record length may have significant impact on the estimation of design rainfall. As such, there is a need to update design rainfall estimates for all durations. Smithers and Schulze (2003) estimated design rainfall for return periods up to 200 years. Cullis et al. (2007) recommended that higher return period floods, i.e., T > 200 years, be used for the design of dams. Hence, there is a need for the estimation of design rainfall for T > 200 years in South Africa.
PMP estimation in South Africa
The PMP estimations in South Africa are currently determined using the only set of established guidelines reported by the Hydrological Research Unit (HRU) of the University of Witwatersrand in 1972 (HRU, 1972; Van der Spuy and Rademeyer, 2014). The guidelines are based on approximately 30 years of rainfall data from 1932 to 1961. The guidelines were developed from a report published in HRU (1969), describing a detailed methodology for the determination of PMP in South Africa (Cullis et al., 2007). The estimations of PMP for large-area and small-area storms are determined separately. This is due to differences in internal mechanisms of the storms. In addition, there are differences in the spatial distribution of daily observed rain gauges required for large-area storms and the autographic rain gauges required for small-area storms. PMP estimation for large-area storms in South Africa is undertaken by the method of storm maximisation and transposition. For small-area storms, empirically derived curves generated from the highest recorded point precipitation, for a range of durations in various parts of the country, are used to estimate PMP (Görgens et al., 2007).
PMP estimation method for large-area storms
Large-area storms are linked to widespread rainfall over a long duration, and typically in catchment areas exceeding 5 000 km2. For the analysis of large-area storms, South Africa was divided into 29 meteorologically similar sub-regions. The boundaries of the regions were defined according to orographic features and ranges of MAP. The PMP can be estimated for each region from maximised curves depicting PMP against area for various durations, starting from 1 day up to 6 days. HRU (1969) gives a detailed description of the steps involved in the derivation of the Depth-Area-Duration curves for PMP in South Africa:
(a) Depth-Area-Duration analysis
(i) Storm selection: The Weather Bureau of South Africa provided rainfall records for gauging stations across the country, sub-divided the country into regions and numbered the rain gauges according to these regions. One station from each region was selected based on rainfall record reliability and rainfall records of approximately 30 years, starting from 1932, were examined. A total of 170 storms were selected country-wide. The 12 highest rainfall events from each rainfall station were analysed to identify the dates and locations of the most severe storms.
(ii) Isohyetal patterns of storm rainfall: It was found to be impossible to draw isohyetal maps from individual storms with confidence due to the uneven distribution of rain gauge stations within the area of influence of a storm. Thus, an 'isopercental' procedure was implemented. This procedure is based on the concept that the areal distribution of rainfall depths during a storm is affected by topographic features of the study area, in the same manner as the MAP would be affected. Therefore, the MAP isohyetal pattern can be extended to indicate the spatial distribution of the storm. The determination of the storm isohyetal pattern by means of the general isopercental procedure involves the following steps:
•Conversion of daily observed rainfall totals from each of the selected rain gauges into percentages of the average MAP from the 30 years of observed data
•Plotting these percentages and determination of isopercental lines by means of interpolation
•Determination of percentage values of rainfall for defined grid points and then conversion to equivalent percentage values using the estimates of MAP at the grid points
•Plotting the observed storm rainfall and the calculated rainfall on a map
•Drawing up isohyetal patterns
(iii) Conversion of isohyetal patterns to depth-area-duration graphs: A computer program was used to determine the depth-area relationship by means of numerical integration. The time distribution of the storm was determined by the derivation of the average mass curves at 1-day time intervals, and using the mass curves to proportion the depths of precipitation of the storm. This was done by first selecting the maximum 1-day precipitation, followed by the maximum 2-day precipitation, with this process being continued up to the total storm precipitation. In this way, the depth-area-duration curves were determined for each of the regions. For any given sub-region it is assumed that the DAD curve can be applied to any location within that particular region.
(b) Storm maximisation
The assumption that a high-efficiency precipitation would most likely have occurred during at least one of the analysed storms within each of the sub-regions is the basis for the approach adopted for PMP estimation in HRU (1969). As such, by maximising the prevailing moisture content for all the storms analysed, the PMP can be shown by an envelope of the maximised depth-area-curves. At the time HRU (1969) was written, the calculation of moisture content of the atmosphere was not possible due to limited availability of such measurements. Consequently, methods for computing the precipitable water content of a column of air from surface temperature and pressure readings were developed. Atmospheric moisture was computed for a range of surface temperatures and pressures and these variables were plotted on a graph. The storm-moisture-content and maximum-moisture-content ratio for each region for a time of the year which is relevant was adopted as a basis for maximisation. The maximum daily dew-point temperature was determined for multiple severe storms for each of the sub-regions and the computed atmospheric moisture graph was used to read the corresponding maximum storm moisture content. According to the storm-moisture-content and maximum-moisture-content ratio, the 1-day precipitation depths for each severe storm were maximised and the depth-area curves were adjusted upward. Furthermore, the 2-day to 6-day precipitation depths were maximised using Eq. 5:
where
Xi = maximised precipitation depth
P = the 6-day precipitation depth
Ri = the ratio of the i-th precipitation depth to the 6-day precipitation depth
Mx = the maximum moisture content at the relevant time of year
Mc = the average 1-day maximum moisture content
Ti = the ratio of the i-th day to the 1-day moisture content
(c) PMP estimation
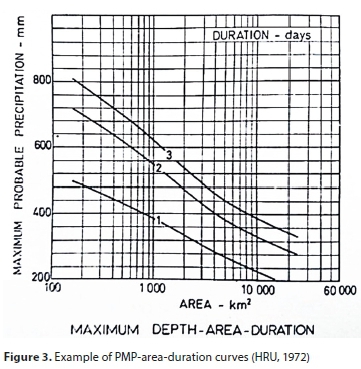
The maximised depth-area curves for each duration in each of the sub-regions were plotted on a single sheet and the upper envelope to all the depths was drawn. The envelope was assumed to represent the PMP for the entire sub-region. PMP-area-duration curves were generated for each of the sub-regions. HRU (1972) presents all the curves for each sub-region. An example of such a curve is shown in Fig. 3. It is estimated that these PMP-area curves may be subject to a 25% error. This is largely due to the inability to take into account possible atmospheric inversion, providing inaccurate estimation of moisture content (Görgens et al., 2007).
PMP estimation method for small-area storms
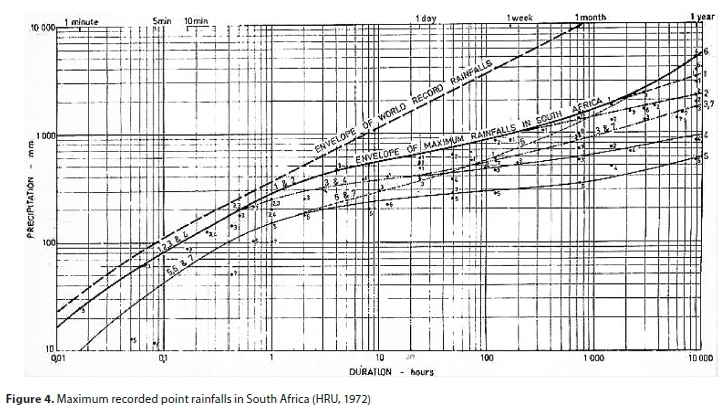
The estimation of PMP for small-area storms typically involves the analysis of point precipitation records and is associated with high-intensity, short duration, localised storms in areas of less than 15 km2. Owing to the lack of sufficient meteorological data observed during short-duration storms, the short-duration point rainfall cannot be maximised in the same manner as for large-area storms. Instead, envelopes of the highest point rainfall of numerous durations observed throughout the country were used to develop an experience diagram. Once again, South Africa was divided into sub-regions. Each region has its own maximum rainfall envelope. This is shown in Fig. 4, together with envelopes of maximum rainfalls for the entire country and the world.
Performance of HRU PMP and recommendations
Since the development of the HRU PMPs, South Africa has experienced numerous severe flood events, and new and updated rainfall data are available (Lynch, 2004; Pegram et al., 2016; Van der Spuy and Rademeyer, 2014). Görgens et al. (2007) undertook to assess the applicability of the HRU PMP curves at that time. For the analysis of large-area storms, six severe storms were selected and a detailed site-specific analysis was completed for each storm. The analysis involved the generation of storm isohyets for critical durations. The average areal rainfall for specific storm durations was determined and compared to the applicable HRU PMP envelope curve of PMP versus area. Results of this analysis showed that the HRU PMP envelope curves were exceeded on numerous occasions, which suggests that these curves may be underestimating the maximum precipitation for large-area storms. The suggestion of underestimation is further supported by the fact that the storms utilised in the study were not maximised and transposed whilst the HRU PMP envelope curves were established based on storms which were both maximised and transposed. The maximum envelope curves for small-area storms for the entire country were also exceeded on a number of occasions, once again highlighting that the HRU envelope curves may be underestimating extreme rainfall for short durations. Based on this study, Görgens et al. (2007) suggested the HRU PMP curves may no longer represent the upper limit of design rainfall in many regions in South Africa, and that the PMF may be underestimated using these curves. Görgens et al. (2007) recommend that the HRU PMP curves be modernised timeously to include longer and more current rainfall records, as well a more extensive rainfall gauge network. Additionally, research into addressing the inability to take into account possible atmospheric inversion, which affects the estimation of moisture content, was proposed.
AUSTRALIA
This section reviews Australia's methods for estimating design rainfalls for various probability ranges, as well as the various methods for estimating the PMP.
Design rainfalls in Australia
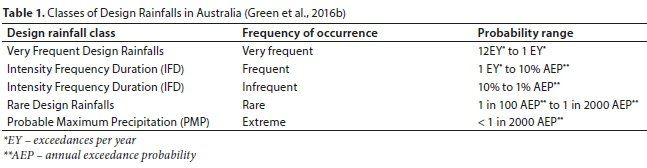
In Australia the guidelines for estimating design rainfalls are provided in Australian Rainfall and Runoff (ARR). The guidelines were first published in 1958 and updated thereafter in 1977 and 1978 (Pilgrim, 1984), and have been continually updated. Compared to the previous revision, the most recent update makes use of nearly 30 years of additional daily rainfall data from 2 300 additional rainfall stations and was published in 2016 (Ball et al., 2016). Design rainfalls are categorised into five broad classes, based on the frequency of occurrence, as summarised in Table 1.
Different methods and data sets are used to estimate the various classes of design rainfalls. The traditional Intensity Frequency Duration (IDF) design rainfalls are the frequent and infrequent rainfalls in the probability range of 1EY to 1% AEP. The procedure for estimating these rainfalls involves assembling a quality-controlled rainfall database, selection and extraction of the extreme value series, frequency analysis using L-moments, regionalisation, and gridding (Green et al., 2016b).
For long-duration rainfalls, data from 8 074 daily-read rain gauges with at least 30 years of record were used. For short duration rainfalls 2 280 continuous rainfall gauges with more than 8 years of record were used. The AMS was selected to define extreme value series as large rainfalls are considered for estimating the IDF design rainfalls. For the at-site frequency analysis various distributions were trialled and it was determined that the GEV distribution was the best for the AMS fitted by L-moments (Green et al., 2016b)
For the regionalisation, Australia adopted the index-flood approach based on L-moments (Hosking and Wallis, 1997) in order to estimate the L-CV and L-skewness with greater confidence. The index value is the mean of the AMS (Green et al., 2016b). The homogenous regions can be defined using various methods. In areas where the station density is sparse a clustering or fixed region approach can be used, whereby stations are grouped into analysis areas with rigid boundaries based on spatial proximity. All stations in each analysis area were used to derive one regression equation that was then used for predictions within the region (Green et al., 2016b). Alternatively, when the station density is high a Region of Influence (ROI) approach (Burn, 1990) can be used, where an individual homogenous region is defined for each site. A ROI approach was used as the region sizes can be easily varied based on the station density and the available record length. A circular ROI and distances defined using latitude, longitude and elevation were used to define the membership of the ROI. The regionalisation was done using the 24-hour rainfall data and the same regions were used for long and short durations (Green et al., 2016b). In this way, the parameters of the GEV distribution (growth curve) were estimated at each location which was combined with the mean of the AMS (the index value) to estimate rainfall quantiles for any return period. In order to make the IDFs available for any point in the country, the ANUSPLIN software (Hutchinson, 2007) was used to grid the GEV parameters. Using this methodology, design rainfall estimates for return periods ranging from 1 to 100 years and durations ranging from 1 minute to 7 days are available for Australia (Green et al., 2016a).
For the very frequent design rainfalls, in the probability range of 1 to 12 exceedances per year, the overall approach was similar to that of IDFs, with the exception that the extreme value series selected was the PDS and the distribution chosen was the Generalised Pareto distribution (The et al., 2015).
Rare design rainfalls associated with return periods ranging from 1:100 to 1:2000 years are needed for the design of high-hazard hydraulic structures for which the impacts of potential failure could be significant. As these rainfalls are required for probabilities much rarer than the length of available records, they have to be extrapolated beyond recorded observed events. Daily rainfall stations with at least 60 years of record were used and the extreme value series selected was the AMS. The frequency analysis used the GEV distribution fitted to the AMS using LH-moments, developed by Wang (1997). LH-moments are a generalisation of L-moments which more accurately fit the upper tail of the distribution and increasingly focus on larger events in the data, depending on the degree of the shift, defined as η. When η = 0, LH-moments are simply L-moments. For Australia, LH-moments with a shift η = 2 were chosen. This is considered to be a good compromise between providing a better fit to the higher probabilities of the distribution and giving too much influence to the high outliers (Green et al., 2015). Many countries are exploring the use of LH-moments for estimating extreme rainfall and flood events (Ahmad et al., 2016; Deka et al., 2011; Hossein and Gheidari, 2013).
PMP estimation in Australia
The Australian Bureau of Meteorology has been continually developing procedures for estimating PMP since the first developments in the 1950s. Deterministic methods for PMP estimation have developed from an in-situ maximisation method, to a storm transposition method, and finally to the current generalised methods (Bureau of Meteorology, 1998; 2003).
The development of generalised methods began in the mid-1970s. Generalised methods utilise all the available data over a large area and include adjustments for moisture availability and variable topographic effects on rainfall depth. Storm data undergo envelopment or smoothing over a range of durations and areas. The PMP estimates obtained via this method are generally higher than the other two methods. The generalised methods tend to set a more uniform standard. Currently, Australia has three generalised methods available: the Generalised Southeast Australian Method (GSAM) (Minty et al., 1996), the (Revised) Generalised Tropical Storm Method (GTSMR) (Walland et al., 2003) and the Generalised Short Duration Method (GSDM) procedures for small areas (Bureau of Meteorology, 2003).
UNITED KINGDOM
The methods used to estimate design rainfalls and the PMP in the United Kingdom are summarised in this section.
Design rainfalls in the United Kingdom
In 1975 the UK developed and published the Flood Studies Report (FSR) as the first guideline for flood estimation. For design rainfall estimation an index-storm approach was used with the index variable being the 5-year return period rainfall. The UK was spilt into two regions and regional growth curves were derived for 15 seconds to 25 days for each of the regions (NERC, 1975).
The FSR was replaced by the Flood Estimation Handbook (FEH) in 1999, which used longer rainfall records and contains updated methodology for rainfall and flood estimation in the UK (Stewart et al., 2014). This document was designed to estimate rainfalls up to return periods of 2 000 years and could be used to extrapolate rainfall estimates up to 10 000 years; however, this should be executed with caution. The Focussed Rainfall Growth Extension (FORGEX) method is used to estimate rainfall frequency (Reed et al., 1999). It is an index-flood method where the index variable is the median annual maximum rainfall. The growth curves are derived using a complex empirical approach which combines a regional frequency analysis with an analysis of maximum points. The plotting positions of these points are shifted to accommodate spatial dependence of extremes.
PMP estimation in the UK
For PMP estimation using FSR methods, observed storms were examined and maximised across the UK for durations of 2 and 24 hours (Beran, 1987). Envelope growth factors for all durations were derived which allow for a quick estimation of PMP based on the 5-year return period for durations from 24 hours up to 25 days. Maximum rainfall depths for durations 2 and 24 hours can be determined by linear interpolation on a diagram of rainfall versus logarithm of duration. Rainfall depths for durations shorter than 2 hours and longer than 24 hours are estimated from factors related to average annual rainfall (Beran, 1987). The FEH does not make any revisions to the FSR PMP methodology and this remains the only available procedure for PMP in the UK (Babtie Group, 2000).
After brief use of the FEH design rainfalls in industry, concern was expressed by the dam profession in the UK regarding the results being obtained for high-return-period rainfalls. In a number of cases, the results of the 1 in 10 000 year rainfall depth exceeded the PMP assessed from the FSR (Babtie Group, 2000; MacDonald and Scott, 2001). Consequently, the UK Department for Environment, Food and Rural Affairs (DEFRA) initiated an investigation into the irregularity and the appropriateness of the extrapolation methods in the FEH for the higher return period rainfall. The outcomes of the investigation led DEFRA to publish 'Revised Guidance to Panel Engineers' which states that the FEH should not be used to assess the 1 in 10 000 year return period rainfall; design rainfall values from FSR should be adopted whilst research continues. A new DDF model has been developed using a larger rainfall database. The FEH rainfall depths are in excess of the new DDF model, which is due to be released in the new FEH and made available through the web service from 2015 (Stewart et al., 2014).
USA
The USA's methods for estimating design rainfalls and the PMP are briefly discussed in this section.
Design rainfalls in USA
The National Oceanic and Atmospheric Administration's (NOAA) National Weather Service (NWS) provides the design rainfall estimates for the USA in the form of various atlases. Rainfall frequency estimations are based on the analysis of the AMS utilising an index-flood approach (Bonnin et al., 2011). Rainfall distributions at different sites are assumed to be the same with exception to a scaling factor, which is the index variable, the mean AMS rainfall. The method involves the estimation of the index for a particular site, and a standardised regional growth curve. The growth curve is the ratio of the quantiles to the index. Rainfall estimates are then obtainable by multiplying the site index value with the regional growth curve. The growth curve is estimated using L-moments following the procedure by Hosking and Wallis (1997). For shorter return periods an empirical formula is used to convert the AMS-based frequency estimates to Peak-Over-Threshold (POT) estimates.
Regionalisation was done by cluster analysis which takes into account topography, types of precipitation, and climatology in order to divide the area into fixed boundary regions. Various probability distributions were examined to determine the most suitable distribution for each region. Based on this approach, the rainfall frequency estimates have been published for durations ranging from 5 minutes to 60 days and for return periods of 1 to 1 000 years in NOAA Atlas 14 (Bonnin et al., 2011).
PMP in USA
The NWS also provides methods for determining the PMP for the USA in the form of various Hydrometeorological Reports (HMR). The first set of guidelines were developed in the late 1940s (Bonnin et al., 2011). The generalised method used involves the selection of maximum observed events, moisture maximisation, transposition, and envelopment. For the entire country over 500 storms have been analysed and the maximum observed aerial precipitation depths have been selected for various durations. The selected storm depths were then maximised based on the assumption that the extreme storms are sufficiently large that they have reached their maximum efficiency. The procedure is the same as that described in the WMO generalised method. Isohyetal patterns of storms are then relocated within meteorologically homogeneous regions. The isohyets were then smoothed to the data on several maps for durations of 6 to 72 hours (NWS, 1980). Despite the fact that there have been many developments in PMP estimation since the development of the HMRs, there have been no updates to the methods used in the USA. Since 1999 the NWS no longer receives funding for research into PMP activities and as such developments into PMP estimation have ceased (Bonnin et al., 2011).
DEVELOPMENT OF OTHER APPROACHES FOR PMP ESTIMATION
Many other approaches to estimate PMP have been investigated. Douglas and Barros (2003) investigated an alternative approach for the estimation of PMP by means of multi-fractal analysis. The study involved the assessment of the value and utility of the application of multi-fractal analysis techniques to systematically compute estimates of extreme precipitation from observations in the eastern parts of USA. The multi-fractal approach provides a formal framework to estimate the extreme precipitation events empirically, referred to as Fractal Maximum Precipitation (FMP). Furthermore, this approach provides an objective estimate for the risk associated with the FMP. In the comparison of the multi-fractal estimates of the 1 in 1 000 000 year return period rainfall to the NWS PMP estimates, it was noted that the multi-fractal estimates were greater. Based on this it was concluded that the multi-fractal of extreme events should be taken as the upper bound of known risk to the standard NWS PMP (Douglas and Barros, 2003).
The storm model approach, developed by Collier and Hardaker (1996) in the UK, makes use of physical parameters, such as surface dew-point, height of storm cell, inflow and outflow, to represent the precipitation process. The maximised surface dew-point is used to determine the Maximum Precipitable Water content (MPW). The combination of the MPW with storm efficiency (E) produces the PMP for every duration t, as shown in Eq. 6. The storm efficiency is the ratio of the total rainfall at ground level to the total cloud condensed water:

This method has been applied satisfactorily to produce PMP estimates in Barcelona, Spain, for durations ranging from 5 min to 30 hours. Similar results were obtained using the statistical approach (Casas et al., 2011).
UNCERTAINTY IN THE ESTIMATION OF EXTREME VENTS
Montanari (2007) defines uncertainty in hydrology as a measure of the lack of accuracy regarding observed data and modelling outcomes. Data uncertainty results from measurement errors due to instrumental or human error. In cases where rainfall records are short, the use of a limited period of rainfall data introduces sample uncertainty. As such, estimates of higher order moments become more unstable due to the presence of outliers (Mamoon and Rahman, 2014). Tung and Wong (2014) explain that the sampling uncertainty is transferred to the DDF model, and eventually to the design rainfall estimation. Uncertainties related to regional frequency analysis include the degree of homogeneity assumed in a region, the record lengths of individual sites, the quantity of sites in a region, and the manner in which the data are pooled to compensate for the lack of data at other stations (Mamoon and Rahman, 2014). A changing climate has been noted to affect different aspects of the hydrological cycle, including rainfall and runoff. As there is a strong link between the global climate system and the hydrological cycle, changes in any components of the climate system may result in potential changes to the magnitude and frequency of rainfall (Wang et al., 2013). Regional design rainfall estimates are based on recorded rainfall data. A non-stationary climate may modify regional rainfall characteristics, which may challenge the use of historical data for realistic long-term estimates (Mamoon and Rahman, 2014).
The representativeness of PMP estimations is dependent on the quantity and quality of data on extreme storm events and the depth of the analysis. Although methods for PMP estimation are designed to yield estimates to the nearest millimetre; this does not indicate the degree of accuracy. It must be noted that although storms and their associated floods have physical upper limits, due to limitations in data and hydrometeorological science and the physical complexity of the PMP, only approximations are available for these upper limits (WMO, 2009a). The lack of a standard approach for estimating the PMP as well as the perception that the PMP is an upper limit which cannot be exceeded has caused much criticism in industry as these values are used in the practice of designing and evaluating high-risk flood-related structures. The concept of a fixed upper limit with zero risk is unrealistic, as cases of recorded rainfalls exceeding the PMP have been documented globally (Salas et al., 2014). It is clearly impossible to produce values for PMP which are 100% representative. However, it is good practice to utilise a variety of methods simultaneously to estimate PMP and the results should be analysed, compared and synchronised from multiple perspectives to check consistency of the estimates and to select the best value (Koutsoyiannis, 1999).
DISCUSSION AND CONCLUSIONS
This review of literature indicates that it is clear that new and updated methods for estimating extreme design rainfall events are needed in South Africa. Design rainfall estimates are needed for the estimation of design floods which are not only used for the design of hydraulic structures, but to quantify the risk of failure of these structures as well. The potential loss of life as well as economic impacts associated with the failure of hydraulic structures can be significant. This highlights the importance of obtaining the best possible design rainfall and design flood estimates, which are dependent on the availability of reliable rainfall and flow records. At-site and regional design rainfall estimates are based on recorded rainfall data. However, a changing climate may modify local and regional rainfall characteristics, which may challenge the use of past data for realistic long-term estimates (Mamoon and Rahman, 2014). It is important that design rainfall estimates be updated periodically to include recent extreme events as they may have exceeded those previously recorded. Some countries are continually updating their design rainfalls to include updated rainfall databases with extended record lengths (e.g., Australia and UK). Typically a regional index-flood type approach to frequency analysis is used to estimate design rainfalls which involves the identification of homogenous regions, selection of a probability distribution function and determination of regional frequency curves, and a method for estimating a scaling factor.
The urgent need to update the data and methods used for design flood estimation in South Africa has been identified by SANCOLD and the WRC (Smithers et al., 2014). More than 10 years of additional rainfall data are available since design rainfalls were last estimated. Moreover, South Africa has experienced changes in the occurrence of heavy rainfall events. This presents the opportunity to update design rainfall estimates. Unlike some countries (e.g. Australia, UK, and USA), South Africa does not provide design rainfall estimates for rare events, i.e., for return periods greater than 200 years. Australia has introduced new and different approaches for estimating rare design rainfalls. Cullis et al. (2007) recommend that higher return period floods be used for the design of dams, presenting a need to produce design rainfall estimates for return periods greater than 200 years. This review suggests that variations of L-moments which are better suited to account for larger events in the data be used to achieve this.
The PMP is an extreme rainfall quantity applied by hydrologists and engineers to determine the PMF, an extreme flood quantity used in the design of high-hazard hydraulic structures (Wang, 1984). WMO (2009a; 2009b) presents numerous methods which have been developed to estimate the PMP, which include deterministic (hydro-meteorological) and statistical methods. Although the concept of maximising and transposing extreme storms to estimate PMP is aligned with international practice, many countries have not revised their PMP estimates since their initial development, despite the introduction of the WMO guidelines. PMP estimates for the UK and USA were last estimated in the late-1900s. Consequently, these PMP estimates do not take into account recent extreme events.
In South Africa the only established guideline for PMP estimation is given in HRU (1972), in which envelope curves for regions which experience similar extreme rainfalls were developed. Although the HRU approach is practical and conservative, it is based on only 30 years of data from the 1930s to the 1960s. Over 5 decades of additional rainfall data are now available. Since these guidelines were first published, the country has experienced several significant rainfall events, some of which resulted in serious damage and loss of life (Cullis et al., 2007). Investigations by Görgens et al. (2007) suggest the HRU PMP curves may no longer represent the upper limits of design rainfall estimations everywhere in South Africa and, consequently, the PMF may be underestimated in places. Underestimating PMP estimates and relying on outdated estimates can have severe effects on flood estimation and flood risk management. As such, the current South African PMP estimates are in need of urgent revision (Cullis et al., 2007). The latest modernised methods prescribed by the WMO which take into account factors previously not included in South Africa's PMP estimates, such as atmospheric inversion, should be used to develop updated PMP envelopes for the country.
REFERENCES
ADAMSON PT (1981) Southern African storm rainfall. Technical Report TR 102. Department of Environmental Affairs, Pretoria. [ Links ]
AHMAD I, ABBAS A, SAGHIR A and FAWAD M (2016) Finding probability distributions for annual daily maximum rainfall in pakistan using linear moments and variants. Pol. J. Environ. Stud. 25 (3) 925-937. https://doi.org/10.15244/pjoes/61715. [ Links ]
BABTIE GROUP (2000) Reservoir safety - Floods and reservoir safety: Clarification on the use of FEH and FSR design rainfalls. Final report to the Department of the Environment, Transport and the Regions (DETR), Glasgow, UK. [ Links ]
BALL J, BABISTER M, NATHAN R, WEEKS W, WEINMANN E and TESTONI I (2016) Austalian Rainfall and Runoff: A Guide to Flood Estimation. Commonwealth of Australia, Australia. [ Links ]
BERAN M (1987) The UK Flood Studies Report: Continuing responsibilities and research needs. In: Singh VP (ed)Flood Hydrology. Springer, Dordrecht. 27-39. https://doi.org/10.1007/978-94-009-3957-8_3. [ Links ]
BONNIN G, MARTIN D, LIN B, PARZYBOK T, YEKTA M and RILEY D (2011) NOAA Atlas 14, Precipitation-Frequency Atlas of the United States, Volume 1. U.S. Department of Commerce, National Oceanic and Atmospheric Administration, National Weather Service, Silver Spring, Maryland, USA. [ Links ]
BUREAU OF METEOROLOGY (1998) Generalised Probable Maximum Precipitation Estimates for the Katherine River Catchment to Katherine Town. GPMP/16. Bureau of Meteorology, Canberra. [ Links ]
BUREAU OF METEOROLOGY (2003) The Estimation of Probable Maximum Precipitation in Australia: Generalised Short-Duration Method. Bureau of Meteorology, Canberra. [ Links ]
BURN DH (1990) An appraisal of the "region of influence" approach to flood frequency analysis Hydrol. Sci. J. 35 (2) 149-165. https://doi.org/10.1080/02626669009492415. [ Links ]
CASAS MC, RODRIGUEZ R, PROHOM M, GAZQUEZ A and REDANOC A (2011) Estimation of the probable maximum precipitation in Barcelona (Spain). Int. J. Climatol. 31 (9) 1322-1327. https://doi.org/10.1002/joc.2149. [ Links ]
CHAVAN RS and SRINIVAS VV (2015) Probable maximum precipitation estimation for catchments in Mahanadi River Basin. Aquat. Proced. 4 892-899. https://doi.org/10.1016/j.aqpro.2015.02.112. [ Links ]
COLLIER CG and HARDAKER PJ (1996) Estimating probable maximum precipitation using storm model approach. J Hydrol. 183 (1996) 277-306. https://doi.org/10.1016/0022-1694(95)02953-2. [ Links ]
CULLIS J, GÖRGENS AHM and LYONS S (2007) Review of the selection of acceptable flood capacity for dams in South Africa in the context of dam safety. WRC Report No. 1420/1/07. Water Research Commission, Pretoria. [ Links ]
DEKA S, BORAH M and KAKATY SC (2011) Statistical analysis of annual maximum rainfall in North-East India: an application of LH-moments. Theor. Appl. Climatol. 104 (2011) 111-122. https://doi.org/10.1007/s00704-010-0330-7. [ Links ]
DESA M, NORIAH A and RAKHECHA P (2001) Probable maximum precipitation for 24 h duration over southeast Asian monsoon region-Selangor, Malaysia. Atmos. Res. 58 (1) 41-54. https://doi.org/10.1016/S0169-8095(01)00070-9. [ Links ]
DOUGLAS EM and BARROS AP (2003) Probable maximum precipitation estimation using multifractals: application in the eastern United States. J. Hydrometeorol. 4 (2003) 1012-1024. https://doi.org/10.1175/1525-7541(2003)004<1012:PMPEUM>2.0.CO;2. [ Links ]
FATTAHI E, NOORIAN AM and NOOHI K (2011) Comparison of physical and statistical methods for estimating probable maximum precipitation in southwestern basins of Iran. Desert 15 (2010) 127-132. [ Links ]
GÖRGENS A, LYONS S, HAYES L, MAKHABANE M and MALULEKE D (2007) Modernised South African design flood practice in the context of dam safety. WRC Report No. 1420/2/07. Water Research Commission, Pretoria. [ Links ]
GREEN J, BEESLEY C, FROST A, PODGER S and THE C (2015) National estimates of rare design rainfall. (December 2015). Paper presented at: Hydrology and Water Resources Symposium, December 2015, Hobart, Tasmania, Australia. [ Links ]
GREEN J, BEESLEY C, THE C, PODGER S and FROST A (2016a) Comparing CRCFORGE estimates and the new rare design rainfalls. Paper presented at: ANCOLD Conference, October 2016, Adelaide, Australia. [ Links ]
GREEN J, JOHNSON F, BEESLEY C and THE C (2016b) Book 2 Rainfall Estimation: Chapter 3 - Design Rainfall. In: Ball J, M Babister, R Nathan, W Weeks, E Weinmann, M Retallick and I Testonis (eds) Australian Rainfall and Runoff: A Guide to Flood Estimation. Commonwealth of Australia, Australia. [ Links ]
GREENWOOD JA, LANDWEHR JM, MATALAS NC and WALLIS JR (1979) Probability weighted moments: Definition and relation to parameters of several distributions expressable in inverse form. Water Resour. Res. 15 (5) 1049-1054. https://doi.org/10.1029/WR015i005p01049. [ Links ]
HADDAD K, RAHMAN A and GREEN J (2011a) Design rainfall estimation in Australia: a case study using L-moments and Generalized Least Squares Regression. Stoch. Env. Res. Risk A. 25 (6) 815-825. https://doi.org/10.1007/s00477-010-0443-7. [ Links ]
HADDAD K, RAHMAN A, GREEN J and KUCZERA G (2011b) Design rainfall estimation for short storm durations using L-moments and generalised least squares regression-application to Australian data. Int. J. Water Resour. Arid Environ. 1 (3) 210-218. [ Links ]
HERSHFIELD D (1965) Method for estimating probable maximum precipitation. J. AWWA 57 965-972. https://doi.org/10.1002/j.1551-8833.1965.tb01486.x. [ Links ]
HOSKING JRM and WALLIS JR (1997) Regional Frequency Analysis: An Approach Based on L-Moments. Cambridge University Press, Cambridge, UK. [ Links ]
HOSSEIN M and GHEIDARI N (2013) Comparisons of the L- and LH-moments in the selection of the best distribution for regional flood frequency analysis in Lake Urmia Basin. Civ. Eng. Environ. Syst. 30 (1) 72-84. https://doi.org/10.1080/10286608.2012.749870. [ Links ]
HRU (1969) Design storm determination in South Africa. 1/69. Hydrological Research Unit, University of the Witwatersrand, Johannesburg. [ Links ]
HRU (1972) Design flood determination in South Africa. 1/72. Hydrological Research Unit, University of the Witwatersrand, Johannesburg. [ Links ]
HUTCHINSON M (2007) ANUSLPIN version 4.37 User Guide. The Australian National University, Centre for Resources and Environmental Studies Canberra, Australia. [ Links ]
KJELDSEN T, MACDONALD N, LANG M, MEDIERO L, ALBUQUERQUE T, BOGDANOWICZ E, BRÁZDIL R, CASTELLARIN A, DAVID V, FLEIG A and co-authors (2014) Documentary evidence of past floods in Europe and their utility in flood frequency estimation. J. Hydrol. 517 963-973. https://doi.org/10.1016/j.jhydrol.2014.06.038. [ Links ]
KNOESEN D, SCHULZE R and SMITHERS J (2011) Climate change and short duration day design rainfall: a 2011 perspective. Chapter 7.1. In: Schulze RS (ed) A 2011 Perspective on Climate Change and the South African Water Sector. WRC Report No. TT 518/12. Water Research Commission, Pretoria. 199-205. [ Links ]
KOUTSOYIANNIS D (1999) A probabilistic view of Hershfield's method for estimating probable maximum precipitation. Water Resour. Res. 35 (4) 1313-1322. https://doi.org/10.1029/1999WR900002. [ Links ]
LYNCH S (2004) Development of a raster database of annual, monthly and daily rainfall for southern Africa. WRC Report No. 1156/1/04. Water Research Commission, Pretoria. [ Links ]
MACDONALD D and SCOTT C (2001) FEH vs FSR rainfall estimates: An explanation for the discrepancies identified for very rare events. Dams Reservoirs 11 280-283. [ Links ]
MADSEN H, ARNBJERG-NEILSEN K and MIKKELSEN PS (2009) Update of regional intensity-duration-frequency curves in Denmark: Tendency towards increased storm intensities. Atmos. Res. 92 343-349. https://doi.org/10.1016/j.atmosres.2009.01.013. [ Links ]
MADSEN H, RASMUSSEN PF and ROSBJERG D (1997) Comparison of annual maximum series and partial duration series methods for modeling extreme hydrologic events. Water Resour. Res. 33 (4) 747-757. https://doi.org/10.1029/96WR03848. [ Links ]
MAMOON AA, JOERGENSEN NE, RAHMAN A and QASEM H (2014) Derivation of new design rainfall in Qatar using L-moment based index frequency approach. Int. J. Sustainable Built Environ. 3 111-118. https://doi.org/10.1016/j.ijsbe.2014.07.001. [ Links ]
MAMOON AA and RAHMAN A (2014) Uncertainty in design rainfall estimation: A review. J. Hyrol. Environ. Res. 2 (1) 65-75. [ Links ]
MINTY LJ, MEIGHEN J and KENNEDY MR (1996) Development of the Generalised Southeast Australia Method for estimating probable maximum precipitation. Hydrology Report Series, Report No. 4. Bureau of Meteorology, Melbourne, Australia. [ Links ]
MONTANARI A (2007) What do we mean by 'uncertainty'? The need for a consistent wording about uncertainty assessment in hydrology. Hydrol. Process. 21 841-845. https://doi.org/10.1002/hyp.6623. [ Links ]
NATHAN R and WEINMANN E (2013) Australian rainfall and runoff. Discussion paper: Monte-Carlo simulation techniques. AR&R D2, Engineers Australia: Water Engineering, Barton, Australia. [ Links ]
NERC (1975) Flood Studies Report. National Environment Research, London. [ Links ]
NWS (National Weather Service) (1980) Probable maximum precipitation estimates - United States east of the 105th meridian. Hydrometeorological Report No. 51. National Weather Service, National Oceanic and Atmospheric Administration, Washington, DC, USA. [ Links ]
PARRETT C (1997) Regional analysis of annual precipitation maxima in Montana. 97-4004. United States Geological Survey, Montana, USA. [ Links ]
PEGRAM G and PARAK M (2004) A review of the regional maximum flood and rational formula using geomorphological information and observed floods. Water SA 30 (3) 377-392. https://doi.org/10.4314/wsa.v30i3.5087. [ Links ]
PEGRAM G, SINCLAIR S and BÁRDOSSY A (2016) New methods of infilling southern African raingauge records enhanced by annual, monthly and daily precipitation estimates tagged with uncertainty. WRC Report No. 2241/1/15. Water Research Commission, Pretoria. [ Links ]
PILGRIM D (1984) Australian Rainfall and Runoff: A Guide to Flood Estimation. Institution of Engineers Barton, ACT, Australia [ Links ]
PILGRIM D and CORDERY I (1993) Chapter 9: Flood Runoff. In: Maidment DS (ed) Handbook of Hydrology. McGraw-Hill, New York. [ Links ]
RAKHECHA P and CLARK C (2000) Point and areal PMP estimates for durations of two and three days in India. Meteorol. Appl. 7 (1) 19-26. https://doi.org/10.1017/S1350482700001389. [ Links ]
REED D, FAULKNER D and STEWART E (1999) The FORGEX method of rainfall growth estimation - II: Description. Hydrol. Earth Syst. Sci. 3 197-203. https://doi.org/10.5194/hess-3-197-1999. [ Links ]
REZACOVA D, PESICE P and SOKOL Z (2005) An estimation of the probable maximum precipitation for river basins in the Czech Republic. Atmos. Res. 77 (1) 407-421. https://doi.org/10.1016/j.atmosres.2004.10.011. [ Links ]
SALAS JD, GAVILAN G, SALAS FR, JULIEN PY and ABDULLAH J (2014) Uncertainty of the PMP and PMF. In In: Eslamian S (ed.) Handbook of Engineering Hydrology. Taylor & Francis Group, LLC, USA. 575-603. [ Links ]
SHAW EM (1994) Hydrology in Practice (3rd edn.). Taylor & Francis e-Library, UK. [ Links ]
SMITHERS JC (1996) Short-duration rainfall frequency model selection in Southern Africa. Water SA 22 (3) 211-217. [ Links ]
SMITHERS JC (2012) Review of methods for design flood estimation in South Africa. Water SA 38 (4) 633-646. https://doi.org/10.4314/wsa.v38i4.19. [ Links ]
SMITHERS JC, GÖRGENS A, GERICKE J, JONKER V and ROBERTS CPR (2014) The initiation of a national flood studies programme for South Africa. South African Committee on Large Dams (SANCOLD), Pretoria, South Africa. [ Links ]
SMITHERS JC and SCHULZE RE (2000a) Development and evaluation of techniques for estimating short duration design rainfall in South Africa. WRC Report No. 681/1/00. Water Research Commission, Pretoria. [ Links ]
SMITHERS JC and SCHULZE RE (2000b) Long duration design rainfall estimates for South Africa. WRC Report No. 811/1/00. Water Research Commission, Pretoria. [ Links ]
SMITHERS JC and SCHULZE RE (2003) Design rainfall and flood estimation in South Africa. WRC Report No. 1060/1/03. Water Research Commission, Pretoria. [ Links ]
STEDINGER J, VOGEL R and FOUFOULA-GEORGIOU E (1993) Chapter 18: Frequency analysis of extreme events. In: Maidment DS (ed) Handbook of Hydrology. McGraw-Hill, New York. [ Links ]
STEWART L, VESUVIANO G, MORRIS D and PROSDOCIMI I (2014) The new FEH rainfall depth-duration-frequency model: results, comparisons and implications. Paper presented at: 12th British Hydrological Society National Symposium, 2-4 Sept 2014, Birmingham, UK. [ Links ]
THE C, BEESLEY C, PODGER S, GREEN J, HUTCHINSON M and JOLLY C (2015) Very frequent design rainfalls − an enhancement to the new IFDs. Paper presented at: Hydrology and Water Resources Symposium, December 2015, Hobart, Tasmania, Austaralia. [ Links ]
TUNG Y and WONG C (2014) Assessment of design rainfall uncertainty for hydrologic engineering applications in Hong Kong. Stoch. Env. Res. Risk A. 28 583-592. https://doi.org/10.1007/s00477-013-0774-2. [ Links ]
VAN DER SPUY D and RADEMEYER P (2014) Flood frequency estimation methods as applied in the Department of Water Affairs, Pretoria, RSA. Department of Water Affairs, Pretoria. [ Links ]
VAN VUUREN S, VAN DIJK M and COETZEE G (2013) Status review and requirements of overhauling flood determination methods in South Africa. WRC Report No. TT 563/13. Water Research Commission, Pretoria. [ Links ]
VOGEL RM and FENNESSY NM (1993) L-Moments diagrams should replace product moment diagrams. Water Resour. Res. 29 (6) 1746-1752. https://doi.org/10.1029/93WR00341. [ Links ]
WALLAND DJ, MEIGHEN J, XUEREB KC, BEESLEY CA and T HTM (2003) Revision of the Generalised Tropical Storm Method for Estimating Probable Maximum Precipitation. Hydrology Report Series, Report No. 8. Bureau of Meteorology, Melbourne, Australia. [ Links ]
WANG B-H (1984) Estimation of probable maximum precipitation: case studies. J. Hydraul. Eng. 110 (10) 1457-1472. https://doi.org/10.1061/(ASCE)0733-9429(1984)110:10(1457). [ Links ]
WANG D, HAGEN SC and ALIZAD K (2013) Climate change impact and uncertainty analysis of extreme rainfall events in the Apalachicola River basin, Florida. J. Hydrol. 480 125-135. https://doi.org/10.1016/j.jhydrol.2012.12.015. [ Links ]
WANG QJ (1997) LH moments for statistical analysis of extreme events. Water Resour. Res. 33 (12) 2841-2848. https://doi.org/10.1029/97WR02134. [ Links ]
WMO (World Meterological Organisation) (1984) Manual for Estimation of Probable Maximum Precipitation. Second edition. Operational Hydrology Report No.1. WMO Report No. 332. World Meterological Organisation, Geneva. [ Links ]
WMO (World Meterological Organisation) (2009a) Guide to Hydrological Practices Volume II Management of Water Resources and Application of Hydrological Practices, Sixth edition. WMO Report No. 168. World Meterological Organisation, Geneva. [ Links ]
WMO (World Meterological Organisation) (2009b) A manual on estimation of probable maximum precipitation (PMP). WMO Report No. 1045. World Meterological Organisation, Geneva. [ Links ]
Received 27 November 2018
Accepted in revised form 25 June 2019
* Corresponding author, email: Johnsonk1@ukzn.ac.za

