


Servicios Personalizados
Articulo
 Inglés (pdf)
 Articulo en XML
 Referencias del artículo
Indicadores

Links relacionados
-
 Citado por Google
 -
 Similares en Google
Compartir

 Permalink
Water SA
versión On-line ISSN 1816-7950
versión impresa ISSN 0378-4738
Water SA vol.45 no.3 Pretoria jul. 2019
http://dx.doi.org/10.17159/wsa/2019.v45.i3.6745
RESEARCH PAPERS
Evaluating the effectiveness of freshwater fishes as bio-indicators for urban impacts in the Crocodile (West) catchment, South Africa
Jonathan C LevinI; Darragh J WoodfordI, II, *; Gavin C SnowI
ISchool of Animal, Plant and Environmental Sciences, University of the Witwatersrand, Private Bag 3, Wits 2050, Johannesburg, South Africa
IISouth African Institute for Aquatic Biodiversity, Private Bag 1015, Grahamstown 6140, South Africa
ABSTRACT
Urbanisation in South Africa has resulted in the degradation of aquatic ecosystems across a rural-to-urban gradient; impacting the availability of clean water. Biological organisms, including fish assemblages, have been used as indicators of environmental change, as part of monitoring programmes designed to protect and improve aquatic ecosystem conditions. However, the effectiveness of individual freshwater fish species as bio-indicators for urban impacts has not yet been evaluated. This study investigated the occurrence of freshwater fish species across three urban gradients within the upper Crocodile River sub-management area as potential bio-indicators. Having collected presence and absence data, five native fish species were determined to be widespread. Their effectiveness as bio-indicators for six environmental drivers, identified through principle component analysis, was assessed using species stressor-response curves derived from logistic regression analysis. Of the five species, the largescale yellowfish (Labeobarbus marequensis) and stargazer catfish (Amphilius uranoscopus) showed potential to be effective bio-indicators for urban impacts on aquatic water quality and instream habitat. These taxa, as effective urban bio-indicators, have the potential to improve the efficiency of urban river health assessments through reducing data gathering and staff training requirements.
Keywords: aquatic ecosystems, integrity, Fish Response Assessment Index (FRAI), species occurrence, stressor-response curves
INTRODUCTION
South Africa's aquatic ecosystems provide numerous essential ecosystem services, including the provision of water to rural communities, and ensuring water and food security, thus supporting socio-economic development (Karr and Chu, 2000; Ollis et al., 2006). Through the years, various anthropogenic factors, such as urbanisation (Wepener et al., 2015), have degraded aquatic ecosystems to a point where their ability to provide crucial ecosystem services has become compromised (Deksissa et al., 2003). Urban impacts on freshwater ecosystems include alteration of instream habitats through canalisation, sedimentation and the loss of riparian vegetation (Paul and Meyer, 2001) and physico-chemical change through polluted runoff and the inflow of sewage from wastewater treatment works (Nyenje et al., 2010). These physical and chemical alterations can have severe impacts on aquatic biodiversity, ecological function, and the usability of the water as a resource to human communities downstream (Paul and Meyer, 2001; Jackson et al., 2016).
To ensure water management areas remain fit to supply water for present and future domestic, agricultural and recreational needs (du Plessis et al., 2014), it is vital to manage and protect aquatic ecosystems surrounding populated areas (Roux, 1999). Monitoring aquatic ecosystems is one of the tools used in their protection, as it allows for environmental degradation to be detected and measured. Ecological monitoring relies on a combination of abiotic and biotic environmental factors to assess the relationship between urbanisation and its impact on aquatic ecosystems (Roux, 1999). Biomonitoring makes use of organisms known as bio-indicators that live within, and respond accordingly to, environments experiencing external and internal stresses (Li et al., 2010). In South Africa, many bio-indicators, including macrophytes, macroinvertebrates, diatoms, bacteria and fish communities have been used to assess the integrity of aquatic ecosystems (Wepener, 2008; Fourie et al., 2014). Fish, being relatively long-lived and occurring at various trophic levels (Armon and Hänninen, 2015), are frequently used as bio-indicators, as they can respond to a multitude of physical, chemical and biological processes within the aquatic environment, across wide temporal scales (Kleynhans, 1999).
In South Africa, the Fish Response Assessment Index (FRAI) uses the freshwater fish assemblage found in rivers as a measure to assess the ecological state of the country's aquatic ecosystems (Kleynhans, 2007; Avenant, 2010). The index was developed for the then Department of Water Affairs and evolved from a previous index known as the Fish Assemblage Integrity Index (Kleynhans, 1999). The FRAI is based upon expert opinion regarding the environmental preferences and intolerances of reference fish assemblages across South Africa, to certain sets of environmental drivers (Kleynhans, 2007). The index aims to measure how fish assemblages respond, through their occurrence, to instream aquatic habitat modifications; due to instream environmental drivers shaping the river reach (Kleynhans, 2007). These drivers include hydrology and geomorphology as well as the physico-chemical water quality properties (Avenant, 2010).
While the FRAI is designed to be a general index of fish community response to environmental change, it has not specifically been used to measure the response of fish to the impacts of urbanisation. Understanding the specific impacts of urbanisation-derived biophysical stressors on aquatic indicators is required in South Africa, as urbanisation is a leading cause of current land-cover change (Jewitt et al., 2015) and is thus a leading driver of ongoing aquatic ecosystem degradation. Understanding the specific responses of conspicuous, easy-to-identify indicator taxa like fish to urban environmental stressors could greatly improve our ability to monitor the impact of expanding urban landscapes on aquatic ecosystems. Wenger et al. (2008) demonstrated that urbanisation gradients drive fish species occurrence, owing to the susceptibility of some species to anthropogenic impacts (e.g. physico-chemical). There is, however, no literature currently available indicating the effectiveness of individual freshwater fish species as indicators for the ecological integrity (instream habitat and water quality) of aquatic ecosystems along rural-urban gradients, particularly in South Africa. An appropriately chosen set of individual indicator species could be as useful a monitoring tool as community-based indices of environmental change, provided they show a strong and consistent positive affinity with undisturbed habitats to which they are endemic (Carignan and Villard, 2002).
This study aimed to assess the usefulness of individual freshwater fish species as indicators for aquatic ecosystem modifications associated with urbanisation. The study targeted species with an expected wide natural distribution within a partially urbanised catchment, to ensure a biologically defensible indicator-stressor relationship across the rural-to-urban gradient (Carignan and Villard, 2002).
METHODS
Study area
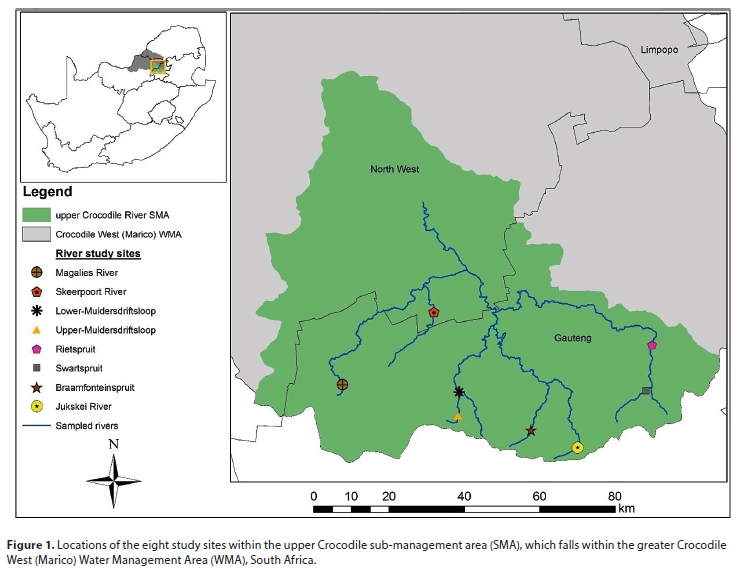
The study sites for this investigation were selected from rivers within the upper Crocodile (West) River catchment, South Africa. This catchment is a sub-management area within the larger Crocodile (West) Marico Water Management Area (Fig. 1). The southern section of the sub-management area is characteristically urban, with large residential and industrial land uses across the City of Johannesburg Municipality (DWAF, 2008). Moving towards Midrand and the City of Tshwane (Pretoria) the two latter land uses continue, while urban sprawls become increasingly common (DWAF, 2008). The remaining land uses within the sub-management area are comprised of peri-urban small-holdings, agricultural and mining activities.
River study sites were selected based upon a gradient of urbanisation within the upper Crocodile River sub-management area. The urban gradient, comprised of urban, peri-urban and rural categories, was classified based upon the percentage of urban land cover in the rivers' upstream reaches. Seven rivers were selected for the research, with a total of eight river study sites (Fig. 1).
Characterising the urban gradient
A 2014 national land-cover map (Geoterraimage, 2014) was analysed using ArcGIS 10.3 (ESRI, 2015) to identify land cover upstream of each river site. The surrounding land cover was classified into six classes: water, vegetation, bare non-vegetated, agriculture, urban, and mining. The urban category was created by combining all urban land uses (urban schools, urban residential, etc.) into one 'urban' land cover class. This class was then used to place each river site along the urban gradient, as either rural, peri-urban or urban (Ding et al., 2015). To obtain the upstream land cover classes surrounding each river, a 1 km buffer was placed around them. To assign each river study site an urban category, a standardised rule was formulated, following McEwan and Joy (2009). The rule classified sites with less than 10%, between 10% and 60%, and greater than 60% upstream urban land covers to be rural, peri-urban and urban, respectively. The eight study sites were comprised of two rural reference sites, four peri-urban sites and two urban sites.
Physico-chemical parameters
Temperature (°C), dissolved oxygen (mg/L and %), conductivity (μS/cm), and pH (pH units) were recorded using a YSI Professional Plus Multi-parameter meter. To obtain average results for each study site, physico-chemical results were automatically recorded every 30 s for 5 min, 3 times within 30 min, each in a different aquatic meso-habitat (where available). Velocity (m/s) and discharge (m3/s) were calculated once at each study site using an auto-calibrated SonTek/YSI FlowTracker discharge probe (Xylem, San Diego). Turbidity was measured using a HI98703-01 Hanna Turbidity Meter, in nephelometric turbidity units (NTU) (DWAF, 1996). To analyse nutrient concentrations within the aquatic ecosystem, water was collected on site and filtered through 0.45 μm syringe filters. The filtrate was then placed into sealable sterile plastic bags, then a portable ice chest, and later moved into a freezer. The samples were defrosted and immediately analysed spectrophotometrically according to the methods outlined in Bate and Heelas (1975) for nitrate-N + nitrite-N, and Parsons et al. (1984) for ammonium-N and orthophosphate-P. Nutrient concentrations were expressed in mg/L.
Assessing prevalence of velocity/depth classes
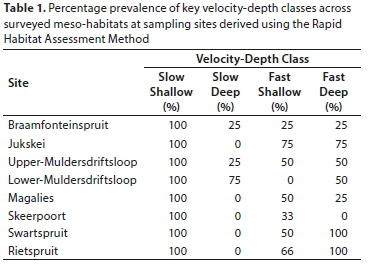
To measure the availability of velocity/depth classes, which are the principal habitat availability signifiers on which fish habitat preferences in the FRAI are based (Kleynhans, 2007), the Rapid Habitat Assessment Method (RHAM) was performed at each study site (following Kleynhans and Louw, 2009). Cross-sectional transects were placed across all available instream meso-habitats, where available, within a 100 m river reach following Peck et al. (2006). The sampled meso-habitats included riffles, runs, pools and pool-runs (Kleynhans and Louw, 2009). The field data were then analysed using the RHAM algorithmic macro in Excel (Kleynhans and Louw, 2009), to indicate the dominant velocity-depth class/classes within each of the meso-habitats sampled, per site.
Sampling freshwater fishes
Each river site was sampled using the Fish Response Assessment Index (FRAI) sampling protocol as outlined in Kleynhans (2007). Each site was sampled once, during low flow conditions (March-April 2017). Moving upstream within the study site, a SAMUS 720MS backpack electro-fisher was used to sample each available meso-habitat for 10 min (Kleynhans, 2007). To prevent avoidance of the electrical current, a 1 x 5 m seine net was used as a downstream block net on each meso-habitat. Each fish present was then processed according to the individual habitat in which it was found, and released into the stream.
The prevalence of velocity-depth classes across meso-habitats determined from RHAM (Table 1) and class preferences of each sampled species (following predictions of FRAI Version 1) enabled an expected species prevalence (across sampled meso-habitats) to be assigned to each site. For example, a species with a known preference for slow-shallow habitat would be given an expected frequency-of-occurrence (FROC) score of 5 if slow-shallow prevalence was 100%, or a FROC score of 1 if the same class prevalence was 25%. An expected species pool for each site was generated using a pristine headwater fish community dataset from the adjacent Groot Marico catchment (Kimberg et al., 2014) within the Crocodile (West) and Marico Water Management Area (WMA3), and checked for missing expected species using the FROC dataset for each site's respective sub-quaternary catchment (Kleynhans et al., 2007). Expected prevalence scores per species per site were assigned based on availability of velocity-depth classes, and observed fish species prevalence data were then entered into the FRAI Version 1 spreadsheet, which used metric groups of individual fish species preferences and tolerances to numerically assess divergence from the expected fish assemblage composition at a given site (Kleynhans, 2007). Automated preferences and weightings were used for all algorithmic settings. The output of the FRAI model was a Present Ecological Status (PES) percentage for each fish assemblage. Using the PES, an ecological category was derived. Ecological categories (ranging from A - pristine to F - critically modified) are indicative of the aquatic ecosystem's ecological integrity (Kleynhans, 2007). To determine whether there was any significant difference in the integrity of the rivers across the three land cover categories, a non-parametric Kruskal-Wallis test was performed on the PES percentages within each category.
Evaluating individual fish species as suitable indicator species
To assess individual fish species as possible indicators, we determined their response to environmental stressors along the urban gradient. To identify the key environmental stressors which best characterise the urban gradient, principle component analysis (PCA) was performed in R (R Core Team, 2017). The PCA identifies the variables that explain the largest portion of the dataset's variance (Shetty et al., 2015). To accurately determine which variables had a significant association with each principle component (PC), the Dimdesc function in the FactoMineR package was used (Le et al., 2008).
Having identified the key stressors describing the urban gradient and its impacts, the distributional responses of fish species to these stressors were assessed. Logistic regression analysis was performed on the naturally widespread fish species, relative to each key stressor. The regression output was individual species stressor-response curves (sensu Meador et al., 2005), indicating the species' threshold of survivability relative to each key environmental driver (Market et al., 2003).
Effective bio-indicator species display a negative probability of occurrence relationship with metrics of increasing environmental degradation, which can be modelled using logistic regression (Oliveira and Cortes, 2006). Consequently, we defined an ideal indicator species to be one that displays a negative binomial pattern of occurrence across the rural-urban gradient, representing a species stressor-response curve. To indicate how well the species tracks the stressor, an R2 value derived from the fit of the probabilistic curve relative to the fish species occurrence, was used as a goodness-of-fit indicator. An R2 value of 1 demonstrated a perfect fit to a binomial stressor-response curve, thus indicating a good bio-indicator response of the fish species to that particular stressor. These data were analysed using R (R Core Team, 2017) and later plotted in SigmaPlot (Systat Software, 2017).
RESULTS
Land cover analysis
Following the land cover analysis upstream of each study site, the sites on the Magalies and Skeerpoort rivers were classified as rural, owing to having urban land covers of 0.05% and 0.62%, respectively. The study sites on the Upper-Muldersdriftsloop and the Swartspruit were determined to have urban land covers of 58.38% and 52.46%, respectively. The study sites on the Lower-Muldersdriftsloop and Rietspruit had urban land covers of 55.48% and 24.58%, respectively. All four sites are thus characterised as peri-urban. The study sites on the Braamfonteinspruit and Jukskei rivers were determined to be urban, owing to having urban land covers of 75.49% and 73.94%, respectively.
Physico-chemical and nutrient stressors
Field sampling took place between 20 April and 8 May 2017. Among the physico-chemical parameters measured, turbidity increased on average across the gradient (Table 2), with the urban gradient having the highest (16.96 NTU), similarly so with electrical conductivity (519.11 µS/cm). This is opposed to dissolved oxygen (7.42 mg/L to 5.49 mg/L) and pH (7.39 to 6.45), which on average both decreased as gradients became increasingly urban. Among the river sites, the urban Jukskei River study site had the highest electrical conductivity (624.73 µS/cm), lowest dissolved oxygen (5.49 mg/L and 47.17%) and pH (6.39).
The concentrations of the three macro-nutrients investigated, on average, progressively increased as river sites became progressively more urban. Regarding nitrate + nitrite, the peri-urban sites (3.14 mg/L), particularly the Rietspruit (6.03 mg/L) study site, had the highest average concentration. The most noticeable macro-nutrient increase was pertaining to ammonium, which on average increased from 0.02 mg/L to 5.25 mg/L along the urban gradient (Table 2), with the Jukskei River study site having the highest concentration (9.01 mg/L). Orthophosphate, in contrast, increased the least on average along the gradient.
Fish Response Assessment Index (FRAI)
A total of 9 fish species were sampled, which matched the expected species pool. Three of the nine species, including the shortspine suckermouth (Chiloglanis pretoriae van der Horst, 1931), the straightfin barb (Enteromius paludinosus Peters, 1852) and the banded tilapia (Tilapia sparrmanii A. Smith, 1840) were not present in upland rivers (Table 3). Additionally, sharptooth catfish (Clarias gariepinus Burchell, 1822) was only found in upland streams when directly downstream of an impoundment. As a result, five of the nine fish species sampled were determined to be widespread (occurring in upland and lowland streams). The designation of species as upland, lowland or widespread was verified using community data from Kimberg et al. (2014), which associated fishes from within WMA3 with natural habitat features along the elevation gradient.
Of the widespread species, the largescale yellowfish (Labeobarbus marequensis A. Smith, 1841) and stargazer catfish (Amphilius uranoscupus Pfeffer, 1889) both only occurred in rural upland and lowland rivers, while the southern mouthbrooder (Pseudocrenilabrus philander Weber, 1897) and Marico barb (Enteromius motebensis Steindachner, 1894) occurred in the rural and peri-urban sites of upland and lowland rivers. The smallscale yellowfish (Labeobarbus polylepis Boulenger, 1907) was found in peri-urban and rural lowland rivers, as well as rural upland rivers (Table 3).
A PES, indicative of the current condition of the river, was derived for each of the eight study sites using FRAI (Table 4). The rural Magalies and Skeerpoort study sites were determined to have the highest average PES of 85.41%, deviating 14.60% from reference conditions, with an Ecological Category of A/B. As the percentage land cover became progressively more urban, the PES of the study sites declined. The peri-urban study sites had an average PES of 36.9%, deviating 63.1% from reference conditions, with an Ecological Category of E. Additionally, urban sites had an average PES of 22.91%, deviating 77.09% from reference conditions, and an Ecological Category of E. The average PESs for the three urban categories did not differ significantly (Chi = 5.13, df = 2, p = 0.08), although this may have been an artefact of insufficient site replication across the three urban gradient classes.

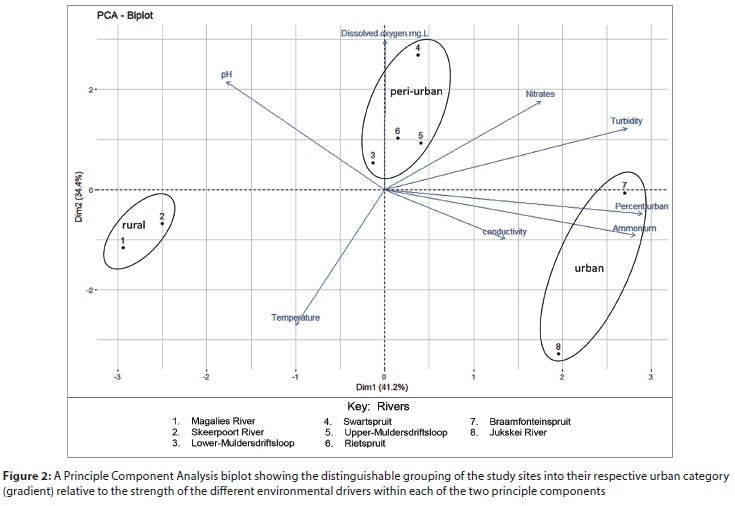
Stressor principle component analysis
The cumulative percentage of PCs 1 to 3 accounted for 89% of recorded variance and were thus retained for further analyses (following Mishra, 2010). Urban land cover, turbidity and ammonium were significantly correlated with PC 1 (Fig. 2, Table 5). Temperature and dissolved oxygen were correlated with PC 2 (Fig. 2, Table 5), and had an auto-correlated relationship, (r = −0.68, df = 6, p = 0.07). Conductivity was the only variable significantly correlated with PC 3 (Table 5). Subsequently, six key environmental drivers were determined for use in the logistic regression analysis as they contribute the greatest (∑ = 89%) to the dataset's variance.

The study sites were distinguishably clustered into their respective rural-urban classifications along PC 1, which accounts for most of the dataset's variance (41.2%). The three environmental drivers which were significantly correlated with PC 1 were thus considered the key stressors best describing the urban gradient and its impacts (Table 5).
Logistic regression analysis
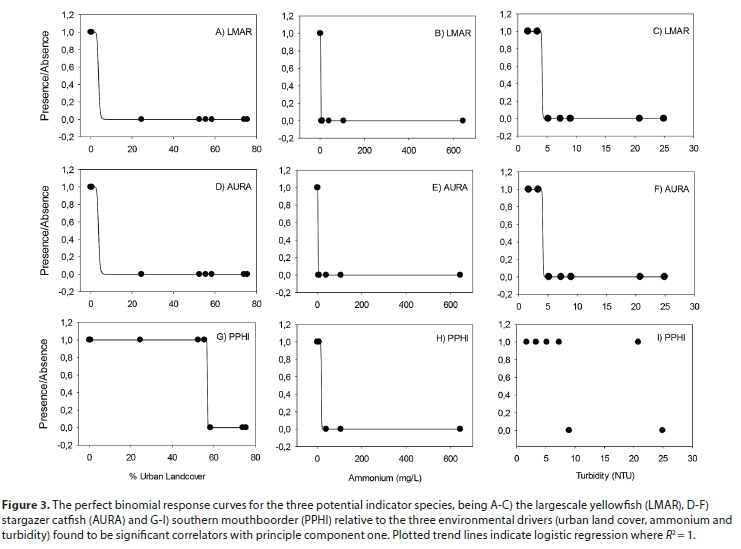
Logistic regression analysis was performed on each of the five widespread native fish species relative to the six key environmental drivers determined during the PCA. Through the plotting of species response curves, using a probabilistic model, it was determined that each of the five species had at least one perfect species stressor-response curve, as represented by R2 = 1. Of the five species, three demonstrated perfect species stressor-response curves for more than two of the environmental drivers (Table 6) and thus, are the potential indicator candidates. These three species only displayed prefect binomial responses to the environmental drivers in PC 1 (Table 6).
Among the three potential indicator species, the southern mouthbrooder demonstrated perfect species response curves relative to stressors 'urban land cover' and 'ammonium'. The species' apparent survivability threshold was reached when urban land cover exceeded 58% and ammonium exceeded 0.45 mg/L (Fig. 3). The largescale yellowfish and the stargazer catfish both displayed perfect, identical species stressor-response curves relative to urban land cover, ammonium and turbidity. The apparent survivability thresholds for both species were 13% for urban land cover, 0.08 mg/L for ammonium and 4.00 NTU's for turbidity (Fig. 3). Although the southern mouthbrooder responded well to two of the six drivers, the largescale yellowfish and the stargazer catfish responded to all three drivers best describing the urban gradient (PC1), and thus can be considered better potential indicator species for urban impacts.
DISCUSSION
Investigating the response of freshwater fishes at species level has the potential to provide significant information on species survivability thresholds, relative to particular anthropogenic factors (e.g. pollution and habitat modification) in urban river catchments (Wenger et al., 2008). In this study, we detected strong presence/absence responses in four native fish species to key environmental stressors directly associated with the rural-to-urban gradient. This indicates a potential for these species to perform as indicators of urban impacts on stream ecosystem integrity.
Characteristics of the rural-urban gradient
As urban land cover increased, there were noticeable changes in the average physico-chemical water quality parameters within the rivers. This can be attributed to the greater number of domestic and industrial establishments along the gradient, which have the potential to discharge pollution either directly into the rivers (Ansara-Ross et al., 2008) or through stormwater drains, which eventually exit into rivers (Koehn et al., 2011).
On average, turbidity increased from 2.53 NTU in the rural study sites, to 10.54 NTU and 16.96 NTU in peri-urban and urban sites, respectively. Such elevated turbidity levels in both peri-urban and urban rivers may be attributed to the greater number of impervious surfaces and associated stormwater drains as regions become increasingly urban (Mwangi, 2014). Increases in turbidity may function as an indicator for catchment hardening due to drains and impermeable surfaces becoming more predominant across the urban gradient (Koehn et al., 2011). Turbidity was one of the stressors best describing the urban gradient in this study and its impacts are a recognised environmental driver influencing freshwater fish survival (Kjelland et al., 2015). Higher suspended solids are also associated with increased benthic siltation, potentially limiting the availability of instream habitats for habitat specialists (Gorman and Karr, 1978).
Nutrients, including nitrogen and phosphorus, were other major stressors associated with increased urbanisation. Stormwater drains and impermeable surfaces have a significant role in the nutrient loading of peri-urban and urban rivers (Ward and Winter, 2016). Drains and their associated urban surfaces facilitate the transportation of urban non-point-source nutrient run-off, including detergents, fertilisers and animal waste, into aquatic ecosystems (Carey et al., 2013). Both phosphorus and nitrogen are crucial water quality parameters as elevated concentrations of either may cause excessive toxic and non-toxic algal growth. Such growth and the subsequent bacterial decay of accumulated detritus may result in hypoxic or anoxic water conditions (Carey et al., 2013), depleting fish communities (Smith et al., 1999). Along the gradient, both the peri-urban (0.13 mg/L) and urban (0.58 mg/L) sites exceeded the orthophosphate limit (<0.025 mg/L) used to prevent harmful eutrophic conditions (Dallas and Day, 2004). A similar trend was evident for average nitrogen concentrations, where the peri-urban sites (3.14 mg/L) exceeded the nitrogen threshold (<2.5 mg/L) set to limit harmful eutrophic conditions (Dallas and Day, 2004). Among the sites, the peri-urban Rietspruit study site had the highest nitrate concentration (6.03 mg/L); exceeding the national prescribed nutrient threshold (DWAF, 1996). The most likely source of elevated nitrogen in this tributary is the East Rand Water Care Association (ERWAT), a wastewater treatment works (WWTW) located in Kempton Park, Gauteng, which continuously discharges treated effluent into the river (N Thlaku, ERWAT, pers. comm., 2017). Such facilities are a main point source for nitrogen in many rivers across South Africa (Dabrowski and De Klerk, 2013).
Ammonium was another key stressor associated with urbanisation. In urban areas, blocked and ruptured sewage mains are a common occurrence, resulting in untreated sewage entering nearby rivers (Matowanyika, 2010). Associated with instream sewage contamination are elevated ammonium concentrations; thus ammonium is an effective indicator for such contamination (Passell et al., 2007; Constable et al., 2015). Such sewage input may explain the increase in ammonium concentrations across the urban gradient, resulting in average peri-urban (0.22 mg/L) and urban concentrations (5.25 mg/L) exceeding the acute toxicity threshold (<0.1 mg/L) (DWAF, 1996). Among the sites, the Jukskei River had the highest ammonium concentration (9.01 mg/L) and was the only site to exceed the South African Target Water Quality Range for toxic ammonia (> 0.007 mg/L); set to prevent physiological harm to fish species (DWAF, 1996; Passell et al., 2007). It is likely that inflow of untreated sewage into the Jukskei River during the sampling period may account for the site's hypoxic conditions, which is a known by-product of high quantities of organic waste (Dallas and Day, 2004).
Urban land cover percentage, another strong correlate with the urban gradient in the PCA, is representative of urban expansion. While it is a key driver impacting nearby water quality, urban expansion also impacts the integrity of riparian vegetation. As urbanisation progresses, riparian zones become increasingly degraded (Meador and Goldstein, 2003) and urban land cover can thus be an indicator for riparian integrity. Such degradation has profound impacts on aquatic ecosystem integrity through altering water temperature, and instream food availability through decreasing the input of allochthonous material and increasing river sedimentation; all of which can impact fish assemblage diversity (Ryan, 1991; Meador and Goldstein, 2003; Reid et al., 2008).
Fish community response to urbanisation
To assess whether fish species responded to the distinguishable physico-chemical water quality conditions along the urban gradient, fish assemblage structure was first assessed using a standardised fish sampling procedure, the Fish Response Assessment Index (FRAI). Having performed FRAI, the Ecological Category, and associated description of current ecological condition of the water resource, was derived for each study site (Kleynhans and Louw, 2007).
From the Ecological Categories, it is evident that as the land cover surrounding the rivers became increasingly urban, the ecological integrity of the rivers subsequently decreased as represented by declining fish diversity (Meador et al., 2005). This is observed in the change from near-natural conditions (Category: A/B) in rural aquatic ecosystems such as the Magalies and Skeerpoort rivers, to seriously modified conditions (Category E) in the urban Braamfonteinspruit and Jukskei rivers. This negative fish diversity response is supported by Roux and Selepe (2015), who found that fish assemblages in South Africa respond negatively to urbanisation, resulting in a river with a lower Ecological Category (Kleynhans, 2007). This is owing to the fish community responding to poorer water and habitat quality conditions derived from surrounding anthropogenic activities (Avenant, 2010; Shetty et al., 2015). Although there was no significant difference in the average PES among urbanisation classes, FRAI was nonetheless effective in detecting a decline in ecological integrity across the rural-to-urban gradient.
Potential bio-indicator species
Of the nine fish species recorded, only five were determined to be naturally widespread within the study area. The sharptooth catfish, which is naturally associated with lowland rivers in the western Limpopo basin (Kimberg et al., 2015), was also present in two upland study sites. Both sites, however, are located downstream of urban impoundments, which are likely demographic sources for this species in these small streams (Weyl et al., 2016). Due to the possibility that this species was historically stocked for angling in these waterbodies (Weyl et al., 2016), it was excluded from the list of naturally widespread species for the purpose of this study.
Logistic regression analysis performed on each of the five widespread species, relative to the six environmental drivers, produced probabilistic curves representative of species stressor-response curves. These curves were used to analyse the effectiveness of individual fish species as bio-indicators for environmental drivers along the urban gradient. All five of the widespread fish species responded with a minimum of one perfect binomial response curve (R2 = 1). Three of the five species, the southern mouthbrooder, largescale yellowfish and stargazer catfish, were the best indicator candidates as they responded with perfect binomial response curves to most of the environmental drivers, including urban land cover, ammonium and turbidity.
Of the three potential indicator species, the southern mouthbrooder appeared the most robust to the impacts of urbanisation. It displayed higher occurrence thresholds for urban land cover (58%) and ammonium (0.45 mgN/L), compared to those of the largescale yellowfish and stargazer catfish (13% and 0.08 mgN/L). Furthermore, while southern mouthbrooder only responded to ammonium (an indicator for water pollution) and urban land cover (indicating riparian degradation), the largescale yellowfish and stargazer catfish also responded to turbidity (indicating suspended sediment). Owing to this apparent sensitivity to all three urban stressors, they are the two best potential indicator species for urban impacts.
These observed binomial responses can be attributed to the species' environmental preferences. For instance, the largescale yellowfish predominately feeds on plant and algal matter, and insects (Skelton, 2001; Fouché, 2009). This may account for the species' response to urban land cover, which is an indicator of riparian zone degradation that limits the allochthonous input of plant matter and insects needed to maintain fish assemblage diversity (Harris, 1995). The largescale yellowfish also responded to turbidity; however, owing to it being a habitat generalist (Fouché, 2009), sedimentation does not necessarily impact its habitats (Berkman and Rabeni, 1987). Rather, its response may be attributed to sediment-laden water inhibiting respiration through clogging gills and/or reducing hunting effectiveness through visual impairment (Ryan, 1991; Fouche, 2009). The susceptibility of largescale yellowfish to pollution can also be inferred from its perfect binomial response to ammonium (at low concentrations).
The binomial response of stargazer catfish to urban land cover, an indicator of riparian degradation, strongly suggests that the species prefers habitat where riparian vegetation is present. This species is a habitat specialist, occupying rocky biotopes in fast-flowing waters and is thought to lay eggs in the interstitial spaces (Skelton, 2001). However, as the instream sediment load increases, these interstitial spaces collect sediment (Ryan, 1991), subsequently removing potential spawning habitat. Increased siltation may also impact this species' feeding ability, as it feeds on small organisms off of rocky surfaces (Skelton, 2001), which are susceptible to being disturbed by increased sediment (Berkman and Rabeni, 1987).
CONCLUSION
Fish have become well established in South Africa as an assemblage-level indicator of ecosystem health, and in this study confirmed that rivers decline in their eco-status classification across a rural-to-urban gradient. In addition, two widespread fish species within the upper Crocodile River sub-management area were identified as potential species-level bio-indicators of stressors associated with urbanisation.
The largescale yellowfish and the stargazer catfish have the potential to indicate modifications in both water quality and instream habitat. This is due to both species having responded with negative logistic stressor-response curves to variables indicating pollution (ammonium), catchment hardening (turbidity) as well as riparian degradation (urban land cover). To confirm the apparent effectiveness of these species and others as bio-indicators for urban impacts, it is recommended that further sampling is conducted to improve replication of this dataset and to further develop research on other fish species-stressor relations.
Individual fish species as bio-indicators for water quality and habitat modifications provide an opportunity for tiered river health assessments optimised for time and practitioner capability. For instance, assessing the presence of indicator species in their known habitats could act as a first-tier assessment for practitioners who do not have the time, resources or training to perform established procedures such as RHAM or FRAI. If an indicator species disappears from a site, it could trigger the requirement to have trained practitioners perform the latter assessments to establish whether the ecological status of the river has degraded due to increased urbanisation. Thus for long-term monitoring by agencies with human capacity limitations, less time could be spent on training individuals to identify only key indicator species for such first-tier monitoring. We recommend that more research be directed towards identifying such species and verifying their susceptibility to key anthropogenic impacts like urbanisation, as well as others such as mining. In the case of other forms of human impact, we recommend that the key physico-chemical and habitat stressors associated with that impact be identified and then directly compared to the distributions of potential indicator species.
ACKNOWLEDGEMENTS
This research was funded by National Research Foundation incentive funding (Grant 103581) and a Wits University Science Faculty research grant to DJW. The authors thank the Gauteng Provincial Government (Permit 0191) and North West Department of Rural, Environmental and Agricultural Development (Permit HQ-04/09/17-352) for fieldwork authorisation, and Rietvlei Nature Reserve, Walter Sisulu Botanical Gardens, Riverstone Lodge, Highlander Trout Lodge, Serengeti Golf Estate and Happy Acres Environmental Education Centre for access to river sites. Sampling was authorised by the University of the Witwatersrand Animal Research Ethics Committee (clearance certificate 2017/03/23/C). The authors thank Refilwe Chilo and Prenisha Govender for their assistance in the field, Gina Walsh for FRAI and RHAM application support, and Jason Marshall for statistical analysis support.
REFERENCES
ANSARA-ROSS TM, WEPENER V, VAN DEN BRINK PJ and ROSS MJ (2008) Probabilistic risk assessment of the environmental impacts of pesticides in the Crocodile (west) Marico catchment, North-West Province. Water SA 34 (5) 637-646. [ Links ]
ARMON RH and HÄNNINEN O (2015) Environmental Indicators. Springer, New York. 643 pp. [ Links ]
AVENANT MF (2010) Challenges in using fish communities for assessing the ecological integrity of non-perennial rivers. Water SA 36 (4) 397-405. https://doi.org/10.4314/wsa.v36i4.58407 [ Links ]
BATE GC and HEELAS BV (1975) Studies on the nitrate nutrition of two indigenous Rhodesian grasses. J. Appl. Ecol. 12 941-952. https://doi.org/10.2307/2402100 [ Links ]
BERKMAN HE and RABENI CF (1987) Effect of siltation on stream fish communities. Environ. Biol. Fishes 18 (4) 285-294. https://doi.org/10.1007/BF00004881 [ Links ]
CAREY RO, HOCHMUTH GJ, MARTINEZ CJ, BOYER TH, DUKES MD, TOOR GS and CISAR JL (2013) Evaluating nutrient impacts in urban watersheds: Challenges and research opportunities. Environ. Pollut. 173 138-149. https://doi.org/10.1016/j.envpol.2012.10.004 [ Links ]
CARIGNAN V and VILLARD MA (2002) Selecting indicator species to monitor ecological integrity: a review. Environ. Monit. Assess. 78 (1) 45-61. https://doi.org/10.1023/A:1016136723584 [ Links ]
DABROWSKI JM and DE KLERK LP (2013) An assessment of the impact of different land use activities on water quality in the upper Olifants River catchment. Water SA 39 (2) 231-244. https://doi.org/10.4314/wsa.v39i2.6 [ Links ]
DALLAS HF and DAY JA (2004) The effect of water quality variables on aquatic ecosystems: a review. WRC Report No. TT 224/04. Water Research Commission, Pretoria. [ Links ]
DEKSISSA T, ASHTON PJ and VANROLLEGHEM PA (2003) Control options for river water quality improvement: A case study of TDS and inorganic nitrogen in the Crocodile River (South Africa). Water SA 29 (2) 209-218. https://doi.org/10.4314/wsa.v29i2.4858 [ Links ]
DING J, JIANG Y, FU L, LIU Q, PENG Q and KANG M (2015) Impacts of land use on surface water quality in a Subtropical River Basin: a case study of the Dongjiang River Basin, Southeastern China. Water 7 (8) 4427-4445. https://doi.org/10.3390/w7084427 [ Links ]
DU PLESSIS A, HARMSE T and AHMED F (2014) Quantifying and predicting the water quality associated with land cover change: a case study of the Blesbok Spruit Catchment, South Africa. Water 6 (10) 2946-2968. https://doi.org/10.3390/w6102946 [ Links ]
DWAF (Department of Water Affairs and Forestry, South Africa) (1996) South African Water Quality Guidelines Volume 7 Aquatic Ecosystems: Second Edition. DWAF, Pretoria. [ Links ]
DWAF (Department of Water Affairs and Forestry, South Africa) (2008) The development of a reconciliation strategy for the Crocodile (West) water supply system. Department of Water Affairs and Forestry, DWAF Report No. P WMA 03/000/00/3408. DWAF, Pretoria. [ Links ]
ESRI (2015) ArcGIS Desktop: Release 10.3. Redlands, CA: Environmental Systems Research Institute. [ Links ]
FOURIE HE, THIRION C and WELDON CW (2014) Do SASS5 scores vary with season in the South African highveld? A case study on the Skeerpoort River, North West province, South Africa. Afr. J. Aquat. Sci. 39 (4) 369-376. https://doi.org/10.2989/16085914.2014.978256 [ Links ]
FOUCHÉ PSO (2009) Aspects of the ecology and biology of the Lowveld Largescale Yellowfish (Labeobarbus marequensis, Smith, 1843) in the Luvuvhu River, Limpopo River System, South Africa. Doctorate of Philosophy in Zoology, University of Limpopo, South Africa. [ Links ]
GORMAN OT and KARR JR (1978) Habitat structure and stream fish communities. Ecology 59 (3) 507-515. https://doi.org/10.2307/1936581 [ Links ]
GEOTERRAIMAGE (2015) 2013 - 2014 South Africa National Land-Cover Dataset, Geoterraimage. URL: http://bgis.sanbi.org/DEA_Landcover/project.asp (Accessed 2 March 2017). [ Links ]
HARRIS JH (1995) The use of fish in ecological assessments. Austral Ecol. 20 (1) 65-80. https://doi.org/10.1111/j.1442-9993.1995.tb00523.x [ Links ]
JACKSON MC, WOODFORD DJ and WEYL OLF (2016) Linking key environmental stressors with the delivery of provisioning ecosystem services in the freshwaters of southern Africa. Geo: Geogr. Environ. 3 (2) 1-12. https://doi.org/10.1002/geo2.26 [ Links ]
JEWITT D, GOODMAN PS, ERASMUS BFN, O'CONNOR TG and WITKOWSKI ETF (2015) Systematic land-cover change in KwaZulu-Natal, South Africa: Implications for biodiversity. S. Afr. J. Sci. 111 (9) 1-9. https://doi.org/10.17159/sajs.2015/20150019 [ Links ]
KARR JR (1981) Assessment of biotic integrity using fish communities. Fisheries 6 (6) 21-27. https://doi.org/10.1577/1548-8446(1981)006<0021:AOBIUF>2.0.CO;2 [ Links ]
KARR JR and CHU EW (2000) Sustaining living rivers. Hydrobiologia 422 1-14. https://doi.org/10.1023/A:1017097611303 [ Links ]
KIMBERG PK, WOODFORD DJ, ROUX H and WEYL OLF (2014) Species-specific impact of introduced largemouth bass Micropterus salmoides in the Groot Marico Freshwater Ecosystem Priority Area, South Africa. Afr. J. Aquat. Sci. 39 451-458. https://doi.org/10.2989/16085914.2014.976169 [ Links ]
KJELLAND ME, WOODLEY CM, SWANNACK TM and SMITH DL (2015) A review of the potential effects of suspended sediment on fishes: potential dredging-related physiological, behavioral, and transgenerational implications. Environ. Syst. Decis. 35 (3) 334-350. https://doi.org/10.1007/s10669-015-9557-2 [ Links ]
KLEYNHANS CJ (1999) The development of a fish index to assess the biological integrity of South African rivers. Water SA 25 (3) 265-278. [ Links ]
KLEYNHANS CJ (2007) Module D: Fish Response Assessment Index in River EcoClassification: Manual for EcoStatus Determination (version 2). Joint Water Research Commission and Department of Water Affairs and Forestry report. WRC Report No. TT 330/08. Water Research Commission, Pretoria. [ Links ]
KLEYNHANS CJ and LOUW M (2007) River EcoClassification: Manual for Ecostatus Determination (Version 2) Module A: EcoClassification and EcoStatus Determination. WRC Report No. TT 329/08. Water Research Commission, Pretoria. [ Links ]
KLEYNHANS CJ and LOUW M (2009) The Rapid Habitat Assessment Method Manual. Water for Africa. Department of Water Affairs and Forestry Report No. RDM/ Nat/00/CON/0707. DWAF, Pretoria. [ Links ]
KLEYNHANS CJ, LOUW MD and MOOLMAN J (2007) Reference Frequency of Occurrence of Fish Species in South Africa. Report produced for the Department of Water Affairs and Forestry (Resource Quality Services) and the Water Research Commission. URL: http://www.dwaf.gov.za/iwqs/rhp/eco/FROC/ReportFinalFROC.pdf [ Links ]
KOEHN K, BRYE KR and SCARLAT C (2011) Quantification of stormwater runoff using a combined GIS and curve number approach: a case study for an urban watershed in the Ozark Highlands, USA. Urban Water J. 8 (4) 255-265. https://doi.org/10.1080/1573062X.2011.595802 [ Links ]
LE S, JOSSE J and HUSSON F (2008) FactoMineR: An R Package for Multivariate Analysis. J. Stat. Softw. 25 (1) 1-18. URL https://cran.r-project.org/web/packages/FactoMineR/index.html [ Links ]
LI L, ZHENG B and LIU L (2010) Biomonitoring and bioindicators used for river ecosystems: definitions, approaches and trends. Procedia Environ. Sci. 2 1510-1524. https://doi.org/10.1016/j.proenv.2010.10.164 [ Links ]
MATOWANYIKA W (2010) Impact of Alexandra Township on the water quality of the Jukskei River. MSc thesis, University of the Witwatersrand, Johannesburg, South Africa. [ Links ]
MCEWAN AJ and JOY MK (2009) Differences in the distributions of freshwater fishes and decapod crustaceans in urban and forested streams in Auckland, New Zealand. New Zeal. J. Mar. Freshw. Res. 43 1115-1120. https://doi.org/10.1080/00288330.2009.9626534 [ Links ]
MEADOR MR and GOLDSTEIN RM (2003) Assessing water quality at large geographic scales: relations among land use, water physicochemistry, riparian condition, and fish community structure. Environ. Manage. 31 (4) 504-517. https://doi.org/10.1007/s00267-002-2805-5 [ Links ]
MEADOR MR, COLES JF and ZAPPIA H (2005) Fish assemblage responses to urban intensity gradients in contrasting metropolitan areas: Birmingham, Alabama and Boston, Massachusetts. Am. Fish. Soc. Symp. 47 409-423. [ Links ]
MISHRA A (2010) Assessment of water quality using principal component analysis: a case study of the river Ganges. J. Water Chem. Technol. 32 (4) 227-234. https://doi.org/10.3103/S1063455X10040077 [ Links ]
MWANGI FN (2014) Land use practices and their impact on the water quality of the upper Kuils River (Western Cape Province, South Africa). PhD thesis, University of Western Cape, South Africa. [ Links ]
NYENJE PM, FOPPEN JW, UHLENBROOK S, KULABAKO R and MUWANGA A (2010) Eutrophication and nutrient release in urban areas of sub-Saharan Africa-a review. Sci. Total Environ. 408 (3) 447-455. https://doi.org/10.1016/j.scitotenv.2009.10.020 [ Links ]
OLLIS DJ, DALLAS HF, ESLER KJ and BOUCHER C (2006) Bioassessment of the ecological integrity of river ecosystems using aquatic macroinvertebrates: an overview with a focus on South Africa. Afr. J. Aquat. Sci. 31 (2) 205-227. https://doi.org/10.2989/16085910609503892 [ Links ]
OLIVEIRA SV and CORTES RMV (2006) Combining logistic models with multivariate methods for the rapid biological assessment of rivers using macroinvertebrates. Environ. Monit. Assess. 112 93-113. https://doi.org/10.1007/s10661-006-0766-5 [ Links ]
PARSONS TR, MAITA Y and LALLI CM (1984) A Manual of Chemical and Biological Methods for Seawater Analysis. Pergamon Press, New York. 173 pp. [ Links ]
PASSELL HD, DAHM CN and BEDRICK EJ (2007) Ammonia modeling for assessing potential toxicity to fish species in the Rio Grande, 1989-2002. Ecol. Appl. 17 (7) 2087-2099. https://doi.org/10.1890/06-1293.1 [ Links ]
PAUL MJ and MEYER JL (2001) Streams in the urban landscape. Annu. Rev. Ecol. Syst. 32 (1) 333-365. https://doi.org/10.1146/annurev.ecolsys.32.081501.114040 [ Links ]
PECK DV, AVERILL DK, HERLIHY AT, HUGHES RM, KAUFMANN PR, KLEMM DJ, LAZORCHAK JM, MCCORMICK FH, PETERSON SA, CAPPAERT MR and co-authors (2006) Environmental monitoring and assessment program - surface waters western pilot study: field operations manual for non-wadeable rivers and streams. EPA/620/R-06/003, 2006. United States Environmental Protection Agency, Washington DC. [ Links ]
R CORE TEAM (2017) R: A language and environment for statistical computing. R Foundation for Statistical Computing, Vienna, Austria. [ Links ]
REID DJ, LAKE PS, QUINN GP and REICH P (2008) Association of reduced riparian vegetation cover in agricultural landscapes with coarse detritus dynamics in lowland streams. Mar. Freshw. Res. 59 (11) 998-1014. https://doi.org/10.1071/MF08012 [ Links ]
ROUX DJ (1999) Design of a national programme for monitoring and assessing the health of aquatic ecosystems, with specific reference to the South African river health programme. Environ. Sci. For. 96 13-32. [ Links ]
ROUX F and SELEPE M (2015) EcoStatus of the Komati River Catchment, Inkomati River System. Mpumalanga Tourism and Parks Agency, South Africa. [ Links ]
RYAN PA (1991) Environmental effects of sediment on New Zealand streams: a review. New Zeal. J. Mar. Freshw. Res. 25 (2) 207-221. https://doi.org/10.1080/00288330.1991.9516472 [ Links ]
SKELTON PH (2001) A Complete Guide to the Freshwater Fishes of Southern Africa. Struik, Cape Town. [ Links ]
SHETTY A, VENKATESHWARLU M and MURALIDHARAN M (2015) Effect of water quality on the composition of fish communities in three coastal rivers of Karnataka, India. Int. J. Aquat. Biol. 3 (1) 42-51. https://doi.org/10.22034/ijab.v3i1.46 [ Links ]
SMITH VH, TILMAN GD and NEKOLA JC (1999) Eutrophication: impacts of excess nutrient inputs on freshwater, marine, and terrestrial ecosystems. Environ. Pollut. 100 (1) 179-196. https://doi.org/10.1016/S0269-7491(99)00091-3 [ Links ]
THLAKU N (2017) Personal communication, 07 July 2017. Ms Neo Thlaku, Corporate Social Investment and Stakeholder Relations, Ekurhuleni Water Care Company (ERWAT), P.O. Box 13106, Norkem Park, 1631, South Africa. [ Links ]
WARD EW and WINTER K (2016) Missing the link: urban stormwater quality and resident behaviour. Water SA 42 (4) 571-576. https://doi.org/10.4314/wsa.v42i4.07 [ Links ]
WENGER SJ, PETERSON JT, FREEMAN MC, FREEMAN BJ and HOMANS DD (2008) Stream fish occurrence in response to impervious cover, historic land use, and hydrogeomorphic factors. Can. J. Fish. Aquat. Sci. 65 (7) 1250-1264. https://doi.org/10.1139/F08-046 [ Links ]
WEPENER V (2008) Application of active biomonitoring within an integrated water resources management framework in South Africa. S. Afr. J. Sci. 104 367-373. [ Links ]
WEPENER V, DLAMINI P, O'BRIEN GC and MALHERBE W (2015) Development of a relative risk assessment framework to assess multiple stressors in the Klip River system. WRC Report No. 22404/1/15. Water Research Commission, Pretoria. [ Links ]
WEYL OLF, DAGA VS, ELLENDER BR and VITULE JRS (2016) A review of Clarias gariepinus invasions in Brazil and South Africa. J. Fish Biol. 89 386-402. https://doi.org/10.1111/jfb.12958 [ Links ]
Received 13 July 2018
Accepted in revised form 27 June 2019
* Corresponding author, email: darragh.woodford@wits.ac.za

