


Servicios Personalizados
Articulo
 Inglés (pdf)
 Articulo en XML
 Referencias del artículo
Indicadores

Links relacionados
-
 Citado por Google
 -
 Similares en Google
Compartir

 Permalink
Water SA
versión On-line ISSN 1816-7950
versión impresa ISSN 0378-4738
Water SA vol.45 no.3 Pretoria jul. 2019
http://dx.doi.org/10.17159/wsa/2019.v45.i3.6733
RESEARCH PAPERS
Membrane surface properties and their effects on real waste oil-in-water emulsion ultrafiltration
Marjana Simonič*
Faculty of Chemistry and Chemical Engineering, University of Maribor, Smetanova 17, 2000 Maribor, Slovenia
ABSTRACT
Membrane surface properties and their effect on the efficiency of ultrafiltration (UF) of real waste oily emulsions was studied. Experiments were performed in cross-flow operation at total recycle condition in a lab-scale system. The ceramic UF membrane in the tubular type module was employed. During the experiments permeate flux was measured. The most important influential factors, such as temperature, TMP, and pH, were considered during the experiments. Zeta potential was measured in order to explain the phenomena on the membrane surface. The isoelectric point of the fouled membrane was shifted to the alkaline range. COD removal efficiency reached 89%. Gas chromatography measurements were performed in order to determine the composition of waste emulsions. SEM micrographs showed the formation of calcite on the membrane, which contributed to membrane fouling. Chemical cleaning was examined using alkaline and acid solutions, and a cleaning strategy was determined.
Keywords: ceramic ultrafiltration, waste oily emulsions, cleaning, scaling
INTRODUCTION
Real oil-in-water emulsions contain up to 95% water and 5% solvents, such as alcohols (nonyl-phenols, ethoxylated alcohols), formaldehyde-based biocides, sequestrate media, corrosion inhibitors (benzotriazole, propylene glycole) and surfactants (amine propoxylate) (Lobo et al., 2006; Bennito et al., 2010). The contents are not known in detail due to confidential formulas of producers. The quantity of additives varies in different products, even if the purpose of the product is the same (Lin and Lan, 1998). In practice, different sources of emulsions are mixed together; therefore, such waste emulsions are very difficult to treat due to their diverse concentration and composition (Cheng et al., 2005; Gutiérrez et al., 2007). More than one process has to be adopted for efficient emulsion treatment (Bensadok et al., 2007). Pre-treatment is mostly done by breaking the emulsion using coagulants (Cañizares et al., 2008). In the next step, oil and organic additives are separated from the de-emulsified solution.
The application of ultrafiltration (UF) has been accepted as a highly effective process to treat oil-in-water emulsions. Membrane separation techniques are superior to conventional treatment (Lobo et al., 2006; Fu and Chung, 2011; Fenglin 2006). Razvanpour et al. (2009) and Hesampour et al. (2008) studied the effect of factors such as pH, temperature, transmembrane pressure (TMP), oil content, and membrane type on flux. pH value influences the membrane surface charge and consequently oil retention. If pH increases emulsion stability increases (Razvanpour et al., 2009). It was also found that flux increases with increasing pH, while oil retention decreases. Zeta potential is the main indicator of emulsion stability (Coca et al., 2011) and should be slightly negative. The same authors claim that non-ionic surfactants improve the stability of emulsion.
However, the efficiency of ultrafiltration is limited by membrane fouling and concentration polarisation, resulting in a permeate flux decline and, therefore, increasing energy consumption of the process (Faibish and Cohen, 2001). Fouling can be divided into reversible fouling, which can be removed by physical cleaning, and irreversible fouling that must be treated with chemical agents.
In an oil-in-water emulsion the drops are smaller than 20 µm (Hu et al., 2002), thus the application of microfiltration, and its efficiency and cleaning, has been extensively studied (Silalahi et al., 2009; Hua et al., 2007; Zhou et al., 2010; Ghandashtani et al., 2015). The use of ultrafiltration is particularly interesting for the treatment of cutting oil used in various industries, since the value of oil rejection is high. Emulsion separations have been studied at laboratory scale by mixing a certain amount of carefully selected oils in water, optionally with surfactant (Križan et al., 2014; Ju et al., 2015). However, we did not find any studies reported in the literature on real waste emulsions particularly those collected from cutting fluid industries, mixed together followed by separation of oil from water. An enterprise in Slovenia is dealing with such emulsions containing various cutting fluids. Therefore, this research was initiated to investigate the feasibility of using ceramic UF membranes for oil removal from waste emulsions after the emulsion breaking process.
The aim of this study was to evaluate the performance of α-Al2O3/ZrO2 tubular ceramic membrane for oil removal from real waste emulsions and to study different types of cleaning agent for efficient flux recovery. The UF membrane has a pore size of 50 nm. UF performance using a model solution was reported for a previous study (Križan et al., 2014). In this study, UF performance was studied and eventually the membrane was fouled by waste emulsion. Chemical cleaning was done using alkaline and acid solutions as well as a combination thereof. After chemical cleaning the membrane was thoroughly washed with water and cleaning efficiency was determined by assessing flux recovery compared with the permeability of non-fouled membrane. Cleaning efficiency was studied at two different temperatures, concentrations and TMPs. The novelty of this study lies in the measurement of zeta potential, together with other techniques, such as SEM and GC/MS analyses, in order to explain membrane fouling phenomena during ultrafiltration of real waste emulsions.
METHODS
Slovene enterprise is engaged in real oil-in-water emulsion transport and handling. Around 2 000 t/yr of emulsion from different industrial branches are mixed together, transported and collected in one large reservoir. Firstly, emulsion breaking is performed using Al2(SO4)3 and anionic flocculant (PAM A-100). Samples were taken after this pre-treatment step in order to determine water quality. COD was determined to be between 18 000 and 30 000 mg/L O2. These values are far above the limit values for discharge into water resources, which for COD in Slovenia is determined at 120 mg/L O2 (Official Gazette of Republic Slovenia, 2005). Secondly, ultrafiltration (UF) was chosen as the next step in the emulsion treatment procedure. Three real oil-in-water samples (denoted N1, N2 and N3) were taken after pre-treatment over a period of 1 month. The pre-treatment was directed towards reduction of COD and turbidity.
UF performance
Filtration experiments were performed in a lab-scale plant in cross-flow operation. The ceramic membrane, with a pore size of 50 nm and an active area 0.418 m2, was integrated in a tubular stainless-steel module. Membrane characteristics are summarized in Table 1.

Figure 1 shows a schematic diagram of the filtration equipment used in this study. The oil-in-water solution was pumped by motor pump (PK) from a feed tank (Tank B1) into a tubular module (membrane module). VK4 valve allowed the regulation of TMP. Concentrate as well as permeate were returned to the feed tank.

Analyses
pH, electro-conductivity and COD were measured according to standard methods SIST ISO 10523, SIST EN 27888 and SIST ISO 6060, respectively. Preparation of samples, headspace-solid phase microextraction (HSME) and GC/MS conditions are reported elsewhere (Pickl et al., 2011).
Zeta potential measurements
The streaming current measurements were done using an electro-kinetic analyser (SurPASS, Anton Paar GmbH, Austria) equipped with a cylindrical cell, where pieces of membrane (2 r > 25 µm) were mounted into the measuring cell. A ١ mM KCl solution was used as the background electrolyte and, prior to measurement, the given sample was rinsed with this aqueous solution. The pH dependence of the zeta potential within the range pH 6-9 was determined using 0.1 M NaOH as the titration liquid. The zeta potential was calculated from the measured streaming current using the Helmholtz-Smoulchowski equation, which takes into account any surface conductivity (Križan et al., 2014).
Membrane cleaning
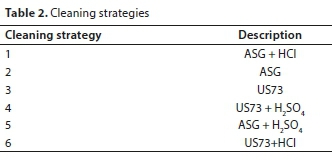
Membrane cleaning was necessary after each experiment, due to membrane fouling during filtration. Two alkaline solutions, ASG (PRU 06-03, Gütling, Germany) and US73 (Ultrasil 73, Henkel-Ekolab Ltd., Germany), and two acid solutions, H2SO4 (pH = 3) and HCl (pH = 3), were applied for membrane cleaning. Solutions were chosen based on the previous experience of the research team, as reported in Križan et al. (2014), with some improvements. Cleaning was done at first by flushing the membrane with pure water for 5 min. Then alkaline solution was heated to 40°C during cleaning and the filtration run for 1 h at a pressure of 100 kPa. In the next step the whole system was flushed with pure water for 5 min followed by acidic cleaning at room temperature for 30 min. In the last step the membrane was flushed with pure water. Verification of the cleaning was done by comparing the water flux after filtration with the initial water flux measured on a virgin membrane under similar conditions. The sustainable value for the flux Jrec to be achieved was 220 L/(m2∙h) at pressure of 200 kPa. Six different strategies for cleaning were implemented, as seen in Table 2.
Scanning electron microscopy
After the experiment, in order to visualize the structure of the deposits formed due to adsorption on the membrane surface, the effluent solution after cleaning of the fouled membrane was investigated by a scanning electron microscope (SEM), Quanta 200 3D (FEI Company).
RESULTS AND DISCUSSION
Zeta potential of clean membrane
The zeta potential versus pH data for the experiments performed is shown in Fig. 2. An iso-electrical point (IEP) for applied ceramic membrane was determined at pH = 5.3. For this membrane, the surface charge is positive at lower pH range, passes through the IEP and becomes negative in the higher pH range. The shape of the zeta potential curve is indicative of amphoteric surfaces. Varying values for ceramic membrane IEP, ranging from 5.5 to 8.2, have been reported (Wakily et al., 2010). According to Lin (2006), the maximum permeability was obtained as a result of pH values roughly corresponding to the IEP of the membranes. Therefore, the UF experiments took place at pH = 5, but also at original pH.

UF operation
The results with model emulsions were thoroughly investigated in a previous study (Križan et al., 2014). The pure water flux and that of waste emulsion were determined. Figure 3a shows the fluxes of pure water (Jw), emulsion at original pH (Je) and pure water after back-flushing (Jwb), and Fig. 3b the fluxes of pure water (Jw), emulsion at pH = 5 (Je) and pure water after back-flushing (Jwb), respectively.


The emulsion flux increases with TMP. If the UF was performed at original emulsion pH, the flux was close to zero at TMP below 150 kPa, while emulsion flux reached 22 L/(m2∙h) in the same TMP region if the emulsion pH was adjusted to 5. The flux increase is in agreement with another study (Tanis-Canbur et al., 2018) which showed that permeate flux increased if the electrostatic interaction (determined by zeta potential) between membrane and oil emulsion was low. In our experiments there was low interaction between membrane (IEP at pH = 5.3) and emulsion with pH = 5. Consequently, the adsorption of surfactants and oil onto the membrane was limited, leading to a decrease in cake layer formation.
It is seen that the emulsion flux is higher at pH = 5 than at original emulsion pH, and increases with TMP. After the back-flush, pure water flux was measured in order to determine the fouling rate. The results are denoted in Fig. 3a and 3b as 'Jwb'. It is clearly seen that the flux after back-flushing is higher in Fig. 3b and the slope of Jwb in Fig. 3b is steeper than that in Fig. 3a. Therefore, it was confirmed that the emulsion pH near IEP (see Fig. 2) allowed higher emulsion fluxes than at original emulsion pH, due to a lower fouling rate, as reported for other studies (Wakily et al., 2010).
The same procedure as described above for the UF protocol was used with Sample N2. The results are not presented for Sample N2 as these were almost the same as for Sample N1 at original pH (Fig. 3a), and even if pH was adjusted to 5. The UF trials with Sample N3 were performed with an emulsion with pH = 5. The results for UF are shown in Fig. 4. The flux of emulsion at pH = 5, the pure water flux and the water flux after back-flushing of the membrane, were very similar to those presented in Fig. 3b. The permeate flux of the waste emulsion was a little higher compared with Sample N1 (see Fig. 3b). It was assumed that the slight Sample N3 flux increase was due to a slightly lower COD, shown in Table 3.

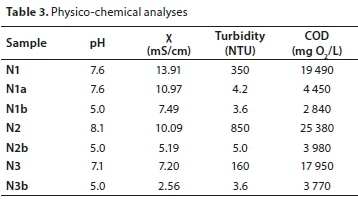
The COD varies widely across Samples N1, N2 and N3 (Table 3). The COD is lower for Samples N1 and N3 and differs by 8%, while the COD difference between N2 and N3 exceeded 23%. Higher organic pollutant content in Sample N2 caused an increase in cake layer formation (Tanis-Kanbur et al., 2018) and consequently lower emulsion flux. The limiting flux of 100 L/(m2∙h) was reached with acidic samples N1 and N3, as shown in Fig. 3b and Fig. 4. Almost the same limiting flux value was previously reported by Matos et al. (2008).
Physico-chemical analyses
pH, electro-conductivity and COD were measured in untreated samples, denoted by N1, N2 and N3. UF-treated samples where pH was adjusted to 5 are denoted by N1b, N2b and N3b. Sample N1a is treated Sample N1 at original pH value. Results are presented in Table 3. As seen from Table 3 the electro-conductivity is very high, in all cases above 10 mS/cm. It is seen that COD decreased by up to 85% for Sample N1, by 84% for Sample N2 and by 79% for Sample N3. pH of original samples varied from 7.1 to 8.1. It was discovered that pH has an important influence on COD removal. This could be attributed to the particle size distribution measurement, in accordance with the results of a previous study (Križan et al., 2014), where particles were determined to be larger at pH = 5 than in neutral range. COD of UF-treated samples was nearly 8% lower if the pH was adjusted to 5 (N1b) compared to samples treated at original pH (N1a). Turbidity was removed by 99.3% and the emulsion was within the drinking water quality limit for turbidity in all three treated samples.
Membrane cleaning
Efficiency of membrane cleaning was determined by assessing flux recovery compared with the permeability of non-fouled membrane. Fouled membranes were cleaned using alkaline solution ASG at 40°C; however, the flux did not reach the initial flux of 220 L/(m2∙h) (at 200 kPa) after cleaning. The SEM image of the effluent solution after cleaning is presented in Fig. 5. The presence of calcite, which has a typical rhomboidal structure, is seen in the SEM image, with a crystal size of 9.07 µm in diameter. The same calcite size was previously reported by Martos et al. (2010). One of the main mechanisms suggested to explain flux decline in a membrane system is filter cake formation (Shaefer et al., 2004). In this study, crystalline CaCO3 particles were formed in the bulk of the emulsion and were deposited onto the membrane. If the emulsion pH was set to 5, solubility of CaCO3 significantly increased with the shift from alkaline to acidic pH (Doberšek and Goričanec, 2014); consequently fewer crystals were formed in emulsion in comparison with the emulsion at original pH.

Therefore, the restoration of the initial flux after solely alkaline cleaning was not achieved (Fig. 6, Cleaning Strategy 2). Cleaning with acid was necessary to remove the calcite. HCl solution (pH = 3) was used and then flushed with distilled water. Calcite dissolved in acid (Doberšek and Goričanec, 2014) and the flux reached the initial value (99.9%) as seen in Fig. 6 (Cleaning Strategy 1).
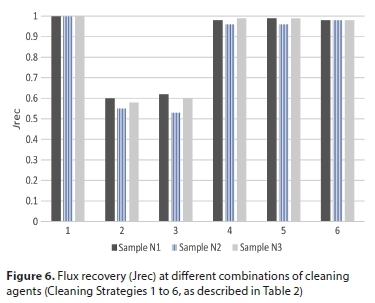
Many combinations were tested, and those combinations with the first step alkaline cleaning plus the second step acid cleaning gave satisfactory results with flux recovery above 95%. Alkaline cleaning alone could not remove all organic and inorganic pollutants, which were present in waste emulsions (see Fig. 6, Cleaning Strategies 2 and 3): cleaning with ASG media (Cleaning Strategy 2) recovered the flux slightly better in comparison with US73 (Cleaning Strategy 3).
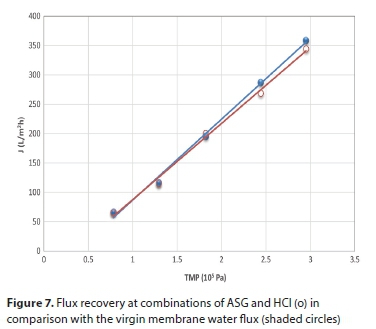
Based on these results, the best cleaning option was, firstly, sequential usage of ASG at 40°C for 1 h at TMP = 100 kPa, followed by flushing with distilled water (till pH of effluent was neutralised) and, secondly, the usage of HCl (pH = 3) for 30 min followed by final flushing with distilled water. Comparison of flux recovery compared with the permeability of non-fouled membrane is shown in Fig. 7. Instead of HCl, sulphuric acid (pH = 3) was used after alkaline cleaning and flux recovery reached 98% of initial flux (Fig. 6, Cleaning Strategy 4).
Cleaning tests also showed that the temperature of alkaline media as well as acids should be at least 40°C. The strategy at higher TMP of 200 kPa was not successful. The recoveries were worse, well below 60%, and are not presented. The results are in agreement with those reported for another study (Silalahi et al., 2009), where lower TMP during cleaning enabled better recoveries in comparison with higher TMP. Authors assumed that the foulant could be compacted into membrane pores at higher TMPs, e.g. 200 kPa.
Zeta potential of fouled membrane
The reduction in permeate flux of the ceramic membrane was observed during filtration of the oily wastewater. Membrane cleaning was not performed in order to foul the membrane, and eventually the flux stopped. The fouled membrane was removed from the filtration unit and, after careful cross-section slicing, placed in the streaming potential cell without rinsing, in order not to disturb any surface deposits on the membrane. Figure 8 demonstrates the zeta potential values of the fouled membrane as a function of pH. It can be observed that the zeta potential values of fouled membranes were just a little more negative when compared to those of the clean membrane (Fig. 2). The shape and slope of the fouled membrane curve differed from those of the clean membrane, in the region from pH 5 to 7, indicating contamination of the membrane surface due to fouling. However, the negative zeta potential remained for a great part very similar to that of the non-fouled membrane. Therefore, not only was the membrane surface fouled, but the membrane's pores were also narrowed, concurring with the literature (Faibish and Cohen, 2001).

Under acidic conditions (pH 5), the membrane gets a positive charge and electrical repulsion promotes the retention of positively charged cationic surfactant. Positive surface sites are thus not diminished, as seen from Fig. 2. In contrast, more positively charged solutes are attached to the surface and the IEP shifts to a higher pH = 7, as seen from Fig. 8. Most likely, negatively charged surfactants are attached to the membrane surface and influence its surface charge (Tanis-Kanbur et al., 2018). As the conductivity is very high, it is assumed that many charged ions are present in waste emulsion, and contribute to the membrane surface charge. The hydrophilic head of the surfactant attaches to the membrane surface and the hydrophobic tails are oriented towards the bulk phase (Lobo et al., 2006), increasing the hydrophobicity of the surface and reducing the aqueous flux through the membrane. It is known that a variety of non-ionic silane surfactants which are present in cutting oils have been synthesized recently (Cheng et al., 2005). The amino groups were present in silane which could contribute to the IEP shift.
At neutral pH, there is electrical repulsion between the anionic surfactants (and oils) and negatively charged membrane. Non-ionic surfactants fouled the membrane, reducing the flux due to adsorption, not only on the surface by cake formation, but also through narrowing of the membrane pores (Faibish and Cohen, 2001). The process is even faster at higher TMP. Therefore, the emulsion flux during UF was the same at TMP 250 kPa and 300 kPa, and fouling increased. As a result of attractive forces, ions may be strongly adsorbed onto the membrane surface as well as into the pores. In this way, the effective pore radius would be reduced. Since the membrane was positively charged in the acidic range, a higher quantity of oils may be attracted. As seen from Fig. 8, in the alkaline region the plateau in zeta potential is less pronounced due to the coverage of negatively charged surface groups, such as anionic surfactants (Matos et al., 2008). However, the coverage of non-polar organic molecules from emulsions, such as long-chain fatty acids (C20-C32), is possible (Pickl et al., 2011). Their presence in emulsions was detected with GC-MS analysis (Fig. 9). Problems were experienced during quantitation of the GC-MS analysis; therefore, these results could only be used qualitatively.
CONCLUSIONS
The applicability of ultrafiltration was tested for COD reduction in waste emulsions. Real oil-in-water waste emulsions had already been pre-treated by an emulsion-breaking process. The results showed that the emulsion could be treated using UF. The highest efficiency was achieved with two different real waste emulsion samples at acidic pH, pH = 5, near isoelectric point. The COD decreased by 89% and 85% in the first and second emulsion samples, respectively. Although the removal efficiency is satisfactory, the values are still very high (above 2 000 mg/L O2) and subsequent treatment in the wastewater treatment plant should be applied in order to reduce organic pollution. The efficiency of chemical cleaning of fouled ceramic membranes was examined. Low recoveries of fouled membrane were achieved using alkaline cleaning agent only, although most organic pollutants were removed. The fouled membranes could be fully restored in two steps: alkaline cleaning is necessary in the first step and acid cleaning to remove scale in the second step.
ACKNOWLEDGEMENTS
The author would like to acknowledge the Slovenian Research Agency for their financial support (Project No. P2-0032).
REFERENCES
BENITO JM, CAMBIELLA A, LOBO A, GUTIERREZ G, COCA J and PAZOS C (2010) Formulation, characterization and treatment of metalworking oil-in-water emulsions. Clean Technol. Environ. Polic. 12 31-41. https://doi.org/10.1007/s10098-009-0219-2 [ Links ]
BENSADOK K, BELKACEM M and NAZZAL G (2007) Treatment of cutting oil/water emulsion by coupling coagulation and dissolved air flotation. Desalination 206 440-448. https://doi.org/10.1016/j.desal.2006.02.070 [ Links ]
CAÑIZARES P, MARTÍNEZ F, JIMENEZ C, SAEZ C and RODRIGO M A (2008). Coagulation and electrocoagulation of oil-in-water emulsions. J. Hazardous Mater. 151 44-51. https://doi.org/10.1016/j.jhazmat.2007.05.043 [ Links ]
CHENG C, PHIPPS D and ALKHADDAR R M (2005) Treatment of spent metalworking fluids. Water Res. 39 4051-4063. https://doi.org/10.1016/j.watres.2005.07.012 [ Links ]
COCA J, GUTIÉRREZ G and BENITO J (2011) Treatment of oily wastewater. In: Coca-Prados J and Gutiérrez-Cervelló G (eds) Water Purification and Management. Springer Netherlands, Dordrecht. 1-55. [ Links ]
DOBERŠEK D and GORIČANEC D (2014) An experimentally evaluated magnetic device's efficiency for water-scale reduction on electric heaters. Energy 77 271-278. https://doi.org/10.1016/j.energy.2014.09.024 [ Links ]
FAIBISH RS and COHEN Y (2001) Fouling resistant ceramic-supported polymer membranes for ultrafiltration of oil-in-water microemulsions. J. Membr. Sci. 185 (2) 129-143. https://doi.org/10.1016/s0376-7388(00)00595-0 [ Links ]
FU Y and CHUNG D D (2011) Coagulation of oil in water using sawdust, bentonite and calcium hydroxide to form floating sheets. Appl. Clay Sci. 53 634-641. https://doi.org/10.1016/j.clay.2011.05.014 [ Links ]
GHANDASHTANI MB, ASHTIANI FZ, KARIMI M and FOULADITAJAR A (2015) A novel approach to fabricate high performance nano-SiO2 embedded PES membranes for microfiltration of oil in water emulsions. Appl. Surf. Sci. 349 393-402. https://doi.org/10.1016/j.apsusc.2015.05.037 [ Links ]
GUTIÉRREZ G, CAMBIELLA A, BENITO JM, PAZOS C and COCA J (2007) The effect of additives on the treatment of oil-in-water emulsions by vacuum evaporation. J. Hazardous Mater. 144 649-654. https://doi.org/10.1016/j.jhazmat.2007.01.090 [ Links ]
HESAMPOUR M, KRZYZANIAK A and NYSTROM M (2008) Treatment of waste water from metal working by ultrafiltration, considering the effects of operating conditions. Desalination 222 212-221. https://doi.org/10.1016/j.desal.2007.01.155 [ Links ]
HU X G, BEKASSY-MOLNAR E and VATAI G (2002) Study of ultrafiltration behaviour of emulsified metalworking fluid. Desalination 149 191-197. https://doi.org/10.1016/S0011-9164(02)00758-0 [ Links ]
HUA F L, TSANG Y F, WANG Y J, CHAN SY, CHUAH and SIN S N (2007) Performance study of ceramic microfiltration membrane for oily wastewater treatment. Chem. Eng. J. 128 (2-3) 169-175. https://doi.org/10.1016/j.cej.2006.10.017 [ Links ]
JU J, WANG T and WANG Q (2015) Superhydrophilic and underwater superoleophobic PVDF membranes via plasma-induced surface PEGDA for effective separation of oil-in-water emulsions. Colloids Surf. A: Physicochem. Eng. Aspects 481 151-157. https://doi.org/10.1016/j.colsurfa.2015.01.041 [ Links ]
KRIZAN J, PETRINIC I, GORSEK A and SIMONIC M (2014) Ultrafiltration of oil-in-water emulsion by using ceramic membrane: Taguchi experimental design approach. Cent. Eur. J. Chem. 12 (2) 242-249. https://doi.org/10.2478/s11532-013-0373-6 [ Links ]
LIN HF (2006) Ceramic membrane technology applied to oily wastewater separation. PhD dissertation, The Hong Kong Polytechnic University, China. [ Links ]
LIN SH and LAN WJ (1998) Treatment of waste oil/water emulsion by ultrafiltration and ion exchange. Water Res. 32 (9) 2680-2688. https://doi.org/10.1016/S0043-1354(98)00035-9 [ Links ]
LOBO A, CAMBIELLA Á, BENITO J M, PAZOS C and COCA J (2006) Ultrafiltration of oil-in-water emulsions with ceramic membranes: Influence of pH and crossflow velocity. J. Membr. Sci. 278 (1-2) 328-334. https://doi.org/10.1016/j.memsci.2005.11.016 [ Links ]
MATOS M, LOBO A, FERNANDEZ E, BENITO JM, PAZOS C and COCA J (2008) Recycling of oily ultrafiltration permeates to reformulate O/W emulsions. Colloids Surf. A: Physicochem. Eng. Aspects 331 (1-2) 8-15. https://doi.org/10.1016/j.colsurfa.2008.06.004 [ Links ]
MARTOS C, COTO B, PEÑA JL, RODRÍGUEZ R, MERINO-GARCIA D and PASTOR G (2010) Effect of precipitation procedure and detection technique on particle size distribution of CaCO3.J. Crystal Growth 312 (19) 2756-2763. https://doi.org/10.1016/j.jcrysgro.2010.06.006 [ Links ]
NORDIN AK and JÖNSSON (2010) Influence of module configuration on total economics during ultrafiltration at high concentrations. Chem. Eng. Res. Design 88 1555-1562. https://doi.org/10.1016/j.cherd.2010.04.003 [ Links ]
Official Gazette of Republic Slovenia (2005) Decree on Emission of Material and Heat by Wastewater Discharge from Cutting Oil Production, No47/2005, Ljubljana, Slovenia. [ Links ]
PICKL KE, ADAMEK V, GORGES R and SINNER FM (2011) Headspace-SPME-GC/MS as a simple cleanup tool for sensitive 2,6-diisopropylphenol analysis from lipid emulsions ad adaptable to other matrices. J. Pharm. Biometric. Anal. 55 (5) 1231-1236. https://doi.org/10.1016/j.jpba.2011.03.019 [ Links ]
REZVANPOUR A, ROOSTAAZAD R, HESAMPOUR M, NYSTRÖM M and GHOTBI C (2009) Effective factors in the treatment of kerosene-water emulsion by using UF membranes. J. Hazardous Mater. 161 1216-1224. https://doi.org/10.1016/j.jhazmat.2008.04.074 [ Links ]
SCHAEFER AI, ANDRITSOS N, KARABELAS AJ, HOEK EMV, SCHNEIDER R and HYSTROM M (2004) Chapter 8. Fouling in nanofiltration. In: Schäfer AI, Waite TD and Fane AG (eds) Nanofiltration-Principle and Application. Elsevier, New York. [ Links ]
SILALAHI SHD and LEIKNES T (2009) Cleaning strategies in ceramic microfiltration membranes fouled by oil and particulate matter in produced water. Desalination 236 (1-3) 160-169. https://doi.org/10.1016/j.desal.2007.10.063 [ Links ]
TANIS-KANBUR MB, VELIOGLU S, TANUDJAJA HJ, HU X and CHEW JW (2018) Understanding membrane fouling by oil-in-water emulsion via experiments and molecular dynamics simulation. J. Membr. Sci. 566 140-150. https://www.sciencedirect.com/science/article/pii/S037673881831562X?via%3Dihub [ Links ]
ZHOU J, CHANG Q, WANG Y, WANG J and MENG G (2010) Separation of stable oil-water emulsion by the hydrophilic nano-sized ZrO2 modified Al2O3 microfiltration membrane. Sep. Purif. Technol. 75 (3) 243-228. https://doi.org/10.1016/j.seppur.2010.08.008 [ Links ]
WAKILY H, MEHRALI M and METSELAAR H (2010) Preparation of Homogeneous Dense Composite of Zirconia and Alumina (ZTA) using Colloidal Filtration. World Acad. Sci. Eng. Technol. 70 140-145. [ Links ]
Received 29 August 2017
Accepted in revised form 27 May 2019
* Corresponding author, email: marjana.simonic@um.si

