


Services on Demand
Article
 English (pdf)
 Article in xml format
 Article references
Indicators

Related links
-
 Cited by Google
 -
 Similars in Google
Share

 Permalink
Water SA
On-line version ISSN 1816-7950
Print version ISSN 0378-4738
Water SA vol.45 n.3 Pretoria Jul. 2019
http://dx.doi.org/10.17159/wsa/2019.v45.i3.6731
RESEARCH PAPERS
Effects of nitrogen loading from domestic wastewater on groundwater quality
Tamás Mester*; Dániel Balla; Gergő Karancsi; Éva Bessenyei; György Szabó
Department of Landscape Protection and Environmental Geography, University of Debrecen, Egyetem tér 1. H-4032 Debrecen, Hungary
ABSTRACT
In this study the effects of nitrogen effluent from a permeable constructed sewage tank on groundwater quality were investigated. Sampling took place before and 1.5 years after the closure. Using a 3D hydrogeological model, the spatial distribution of dissolved inorganic nitrogen (DIN), comprising the species NH4+, NO2− and NO3−, was modelled in the saturated zone and the amounts and changes in the ratio of NH4-N, NO2−N, NO3−N were determined. The first part of our general hypothesis, that the groundwater was heavily contaminated in the area surrounding the sewage tank, was clearly verified, since every investigated nitrogen compound exceeded the contamination limit values; but the second part of our hypothesis, that the degree of contamination would significantly decrease after the sewage tank was taken out of use has not been confirmed, since the amount of nitrogen present in inorganic forms increased in the modelled zone. The increase in DIN and the relatively high concentration of NH4+ (35 mg/L) in the immediate vicinity of the tank can be explained by the fact that organic matter (OM) accumulated over the decades provided a constant supply of inorganic nitrogen forms.
Keywords: ammonium, nitrite, nitrate, groundwater quality, pollution, wastewater, nitrogen loading
INTRODUCTION
In inhabited areas the significant nitrogen (N) contamination of groundwater, generated mainly by domestic wastewater input, has now become a crucial issue (Drake and Brauder 2005; Kringel et al., 2016). Domestic sewage typically has total nitrogen concentrations of 20 to 100 mg∙L−1, primarily as NH4+ (Robertson et al., 2012). Nitrogen enters the shallow groundwater in numerous organic and inorganic forms and, due to their high solubility, is easily transported from septic and sewage tanks to the deeper aquifer zones, thus contaminating the aquifers (Simmons et al., 1992; Heatwole and McCray 2007, Moodley et al, 2017; Adams et al. 2019). Inappropriate wastewater treatment has led to widespread N pollution of aquatic systems, not only in the less-developed areas of the world, but in developed areas as well (Fantong et al., 2013; Gooddy et al., 2014; Benrabah et al., 2016, Robertson et al., 2016; Adhanom et al., 2018).
Based on investigations carried out in Tennessee, Hanchar (1991) concluded that septic tank effluent affected groundwater quality. The slightly elevated nitrite, nitrate and ammonium content can also be explained as a result of the efflux from the septic-tanks. Reay (2004) reached a similar conclusion after investigating the effects of septic tanks on groundwater. The nitrogen load to septic tanks is significant (5.7 to 10.7 kg∙household−1∙yr−1) and, as a consequence, the amount of the dissolved inorganic nitrogen (DIN) measured in the shallow groundwater can be 100 times higher than the DIN values measured in the nearby surface water. The research of McQuillan (2004) carried out in New-Mexico demonstrated that contamination originating from septic tanks has the largest effect on the groundwater, when compared to other sources of contamination.
Urbanization and intense agricultural and industrial activity have caused serious pollution of the environment and water resources on the African continent (Attoui et al., 2016). Pollution sources are related to raw sewage and domestic or industrial wastewater discharges as well as agricultural runoff. In addition, the increase in the number of inhabitants leads to over-exploitation, increasing the vulnerability of groundwater (Nlend et al., 2018). Abdalla and Khalil (2018) investigated the surface and groundwater contamination in Qus City in Egypt. The sewage network is under construction, and the sewage is disposed in uninsulated underground sewage sites, which have direct contact with groundwater; therefore, wastewater infiltrates easily into the shallow aquifer. 94% of groundwater samples showed evidence of mixing between groundwater and wastewater. In the urban environment of Yaounde mass flow of nutrients from latrines and septic tanks was assessed to evaluate the groundwater quality. The rapid increase of electrical conductivity from the background to the built-up areas and the ammonium and nitrate concentrations above the WHO limit suggest anthropogenic effects (Kringel et al., 2016).
Similar problems can be identified in the countries of East-central Europe. In this region the most common contamination sources are pit latrines and uninsulated sewage tanks (Banks et al., 2002; Smoroń 2016; Mester et al., 2017). The N contamination of groundwater of anthropogenic origin is evidenced by several studies. Adumitroaei et al. (2016) investigated the inorganic nitrogen species, in the oxidized (NO2−, NO3−) and reduced (NH4+) forms, in groundwater in the northern and central part of Vaslui County, Romania. Both forms of nitrogen were above concentration limit values proving their anthropogenic origin. Based on investigations carried out in Serbia, Devic et al. (2014) concluded that NO3− of anthropogenic origin is one of the key factors impairing groundwater quality.
In the rural areas of Hungary, one of the most important sources of organic and inorganic (NH4+, NO2, NO3−) nitrogen compounds is wastewater originating from households, the collection of which remains an unsolved problem in many places (Mester and Szabó 2013; Szabó et al., 2016). Hungary with the accession to the European Union ratified the Water Framework Directive (WFD) (2000/60/EC) and the Urban Wastewater Treatment Directive (UWTD) (271/91/EEC), which regulate the issue of contamination originating from agriculture and domestic wastewater. The UWTD requires the establishment of a sewage system in every settlement with a population over 2 000. The establishment of the sewage system in Hungary has accelerated over recent years. While in 2004, 31.5% of the households with a public water supply system were not connected to the sewage system, this ratio decreased to 14.5% in 2016 (KSH, 2017).
Because of the expensive transportation costs, in many cases local inhabitants have chosen to build sewage tanks using permeable walls of concrete or brick (uninsulated sewage tanks) so that the wastewater would be able to seep into the soil, resulting in the contamination of groundwater as shown in Fig. 1 (Mester et al., 2016).
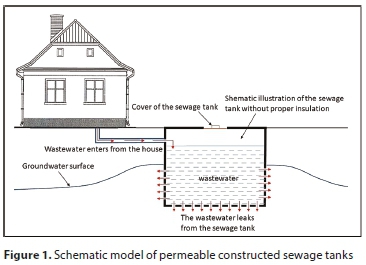
These sewage tanks pose a significantly higher risk of environmental damage than do septic tanks, since raw untreated sewage water flows into the groundwater from them, and consequently, in settlements without a sewage system these tanks are the most important sources of contamination of the groundwater.
After reviewing the literature, we concluded that even though papers have been published on the environmental problems caused by sewage effluent in settlements (Wolf et al., 2004; McArthur et al., 2012; Edo et al., 2014, Augustsson et al., 2016; Szabó et al., 2016), few studies have been carried out focusing on the direct environmental impact of a specific sewage tank (Mester et al., 2016, 2017). We are not aware of studies showing what types of changes occur in the quality of groundwater after eliminating a sewage tank. Since the elimination of these sources of contamination is a major goal throughout the world our studies could help to clarify the recovery processes of the groundwater.
In this study, investigations in the immediate area of a sewage tank were carried out, and the effects of nitrogen effluent from uninsulated sewage tanks on the groundwater were demonstrated. The sewage system in the studied settlement was constructed in October 2014; therefore, the sewage tank we examined was no longer in use. Given that we started the investigations before the sewage system was constructed, we were able to carry out comparative examinations involving an active and an out-of-use sewage tank. The nitrogen flowing out from sewage tanks migrates into the groundwater primarily in the form of NH4+, NO2−, NO3− (Heatwole and McCray, 2007) and the ratio of the above compounds is an important index combination; that is why we chose these nitrogen compounds to evaluate the groundwater quality, and the recovery process after the elimination of sewage water emissions.
Our general hypothesis was that the groundwater was heavily contaminated in the vicinity of the uninsulated sewage tanks, and the degree of contamination would significantly decrease 1.5 years after the elimination of wastewater emissions.
In order to test our hypothesis, we performed the following tasks: (i) investigation of the spatial distribution of NH4+, NO2−, NO3− concentrations in the immediate area of active and out-of-use sewage tanks, (ii) estimation of the volume of the nitrogen-contaminated groundwater using a 3D model, (iii) Identification of the amount of NH4+, NO2−, NO3− present in the modelled saturated zone, (iv) evaluation of the changes in the ratio of the nitrogen forms investigated.
MATERIALS AND METHODS
Site location and characteristics
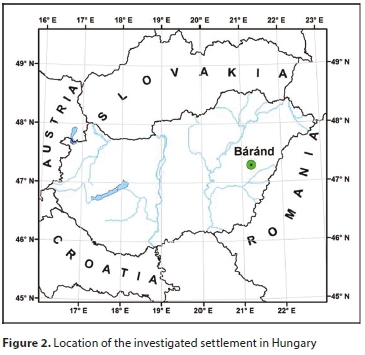
The investigated settlement - Báránd - is located in the eastern part of the Great Hungarian Plain, on the Nagy-Sárrét on the western part of the alluvial deposit of the Sebes-Körös River (Fig. 2), and has a population of 2 631 (KSH, 2015). The altitude of the Nagy-Sárrét is typically 85-89 m and the region is classified as a flat plain (relative relief 0-3 m∙km−2). The groundwater level is close to the surface, at a depth of 1-2 m; consequently, all the soil types have been formed under the influence of water (Michéli et al., 2006). In the study area the most frequent soil types are Solonetz, Vertisol, Kastenozem, and Chernozem, and in the built-up area - as a result of anthropogenic effects - Technosol (Novák and Tóth, 2016).
Field sampling and laboratory analysis
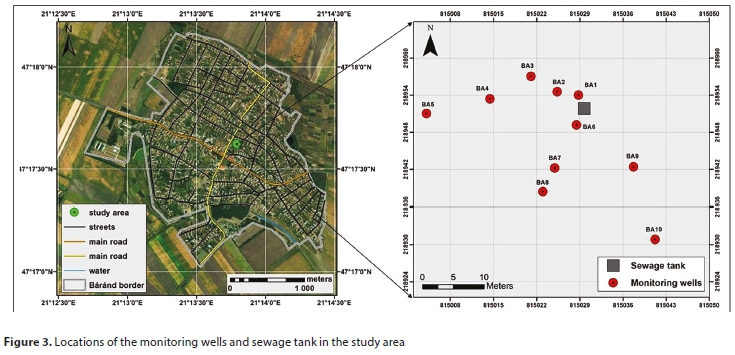
In order to analyse the effect of sewage tanks located in the settlement on the environment, we selected a sewage tank located in the centre of the settlement (Fig. 3). Monitoring wells were established with a depth of 3 m in the immediate vicinity of the sewage tank (Fig. 3).
In this study an analysis of the water samples collected during the spring of 2013 and the spring of 2016 was performed. The well casing was made of PVC pipes with a diameter of 50 mm. For the water sampling a peristaltic pump was used. Before sampling the volume of water originally contained in the wells was extracted 3 times according to the Hungarian Standard (MSZ 21464:1998). The groundwater levels in the monitoring wells were measured at the time of sampling. The hermetically closed samples were delivered to the Laboratory of Geography at the University of Debrecen, stored in a refrigerator and analysed within 24 h. Before the analysis samples were filtered using 1288 filter paper. The ammonium nitrite and nitrate concentrations were determined using UV-VIS spectrophotometer (Literathy, 1973). The chemical oxygen demand (CODMn) was determined in accordance with Hungarian Standard (MSZ 12750/21-71). Soil samples were collected from one of the monitoring wells at 20-cm intervals down to a depth of 3 m, and their texture was determined by the Köhn-pipette method (Müller et al., 2009).
In order to identify the elevation of the groundwater levels, a digital relief map was created, using two Trimble S9 dual-frequency, high precision geodesic GPS devices (accuracy 2 cm). The interpolation of the surface was completed with a free triangular mesh.
Model calculation
The spatial geological models were developed with Surfer 11 and RockWorks 14 modelling software. In order to demonstrate the NH4+, and NO3− concentrations, isometric maps were created using the kriging geostatistical method in Surfer. Using the RockWorks software the 3D model of the area was compiled, during which kriging interpolation was used. In order to construct the 3D model of the distribution of the contaminant concentration (M), RockWorks applies the following formula:
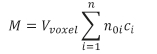
where: M is the volume of the water body which exceeds the specified concentration, Vvoxel is the volume of the voxel, n0i is the effective porosity, and ci is the concentration value measured in the monitoring wells.
The 3D models describe the distribution of the investigated contaminants down to 3 m below the surface level in the saturated zone, since data regarding the soil texture was available only to this depth.
Based on the models created with RockWorks, the volume of the water bodies contaminated with NH4+, NO2− and NO3− in terms of the given concentrations was identified. Since the soil texture was loam in the investigated area, it was calculated based on a pore space of 45% (Stefanovits, 1981). Then, based on the results, the amount of inorganic nitrogen compounds which can be found in the given water body was identified in grams.
RESULTS
Soil texture
The soil texture plays a key role in the determination of groundwater flow. Figure 4 shows the granulometric composition of the soil samples from the BA5 monitoring well. Coarse sand (particle size of 0.2-2 mm) was not identified in any of the soil samples with depths of 0-300 cm.
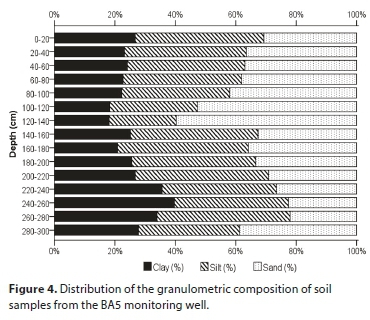
It can be seen that the soil texture was loam in all of the investigated soil depths. The Zamarin filtration coefficient values identified on the basis of these results are very low, varying between 1.23 × 10⁻⁷ m∙s−1 and 5.20 × 10⁻⁷ m∙s−1 in the investigated layers (Zamarin, 1928).
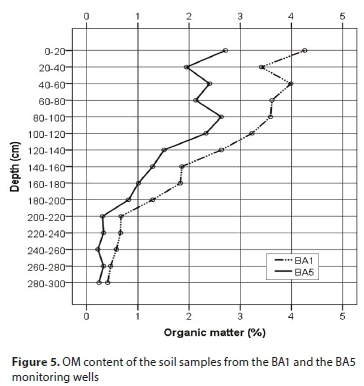
Organic matter content of the soil
In 2013 the organic matter content of the soil was studied in the monitoring wells in the sections which were closest to (BA1) to and furthest from (BA5) the sewage tank. An average of 40% higher OM content was measured in the section closest to the sewage tank. This significant difference between the sections within a 25 m distance is related to the accumulation of organic matter leaking from the sewage tank, since under natural conditions there was probably no significant difference between the two sections.
Organic matter content of groundwater
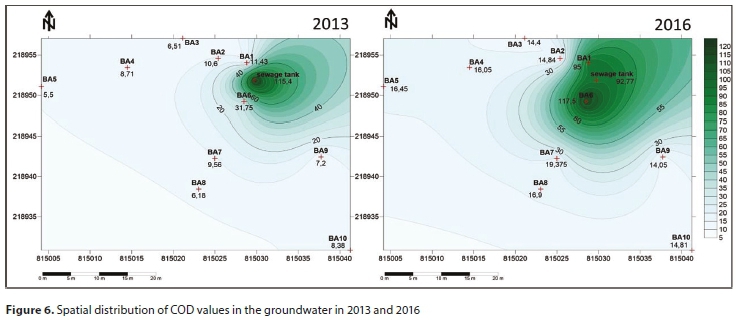
The highest COD values of the groundwater were measured in the vicinity of the sewage tank, similarly to the OM content of the soil (Fig. 6).
It can be stated that the spatial distribution of COD values 1.5 years after the closure of the sewage tank showed the same pattern. These values are significantly reduced within a few meters from the sewage tank, but concentrations exceeded the contamination limit (6/2009 Government Decree) (4.5 mg∙L−1) in every monitoring well, indicating anthropogenic effects. Based on the measurements, it can be concluded that inorganic nitrogen forms are still being supplied.
Spatial distribution and amount of inorganic nitrogen forms (NH4+, NO2−, NO3−)
Sewage water emission in the study area
In Hungary an average of 100 L∙capita−1∙day−1 of wastewater is generated, with a significant distribution (Takács 2013). Based on the water consumption data in the 4-person household studied, 116 L∙capita−1∙day−1 of wastewater is generated on average, or a total of 464 L∙day−1 of wastewater per household (Mester et al., 2016). Based on the above, 170 m3∙yr−1 of wastewater flowed into the sewage tank from the household investigated. According to our records of wastewater transportation by sewage suction trucks, in 2013, 90 m3 of wastewater was transported from the sewage tank in total, indicating that the amount of wastewater effluent from the sewage tank was 80 m3 in 2013, making up 47% of the generated wastewater (Mester et al., 2017).
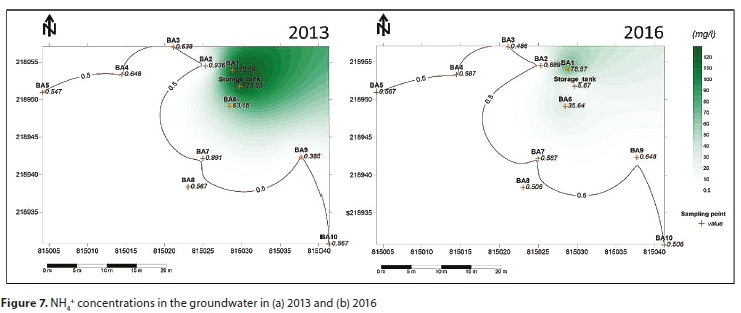
Spatial distribution and amount of NH4+
The most important contaminants of domestic wastewater originate from the decomposition of organic matter. During the first step of the process NH4+ is created, producing a concentration above 90 mg∙L−1 (Takács, 2013), which is characteristic of the raw wastewater found in used sewage tanks (124 mg∙L−1) (Fig. 7). Due to the high organic carbon content, conditions are anaerobic and nitrification of NH4+ is limited. Moving away from the sewage tank, as the organic carbon content decreases nitrification progressively occurs. Therefore, the concentration of ammonium rapidly decreases, such that at a distance of 15-20 m from the well it decreases to a concentration close to the contamination limit value of 0.5 mg∙L−1 (6/2009 Government Decree) (Fig. 7).
Even 1.5 years after closure, a concentration above 90 mg∙L−1 was not measured in the monitoring wells, in the BA1 well the concentration of NH4+ was still 78.57 mg∙L−1, and it did not decrease to below the contamination limit in the case of more distant monitoring wells, which can be explained by two reasons (Fig. 7b): The very high concentrations detected in the vicinity of the sewage tank were caused by the considerable amount of organic material accumulated while the sewage tank was in use, the decomposition of which is still in progress 1.5 years after the sewage tank went out of use. Another possible cause was that in the modelled area the clay content of the soil varies between 18 and 40% (Fig. 4). According to Nieder et al. (2011), medium-textured soils have a fixed NH4+-N content of 60-270 mg∙kg−1. If the amount of NH4+ in the groundwater decreases by nitrification, a part of the fixed NH4+ can be released, which can be an additional source of NH4+ (Stefanovits et al., 1999).
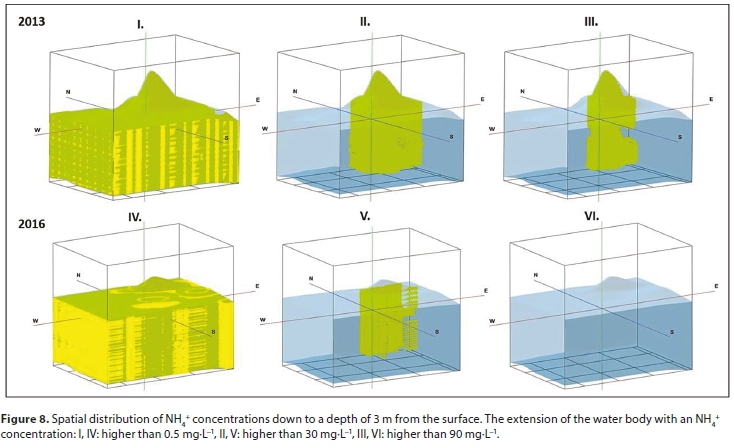
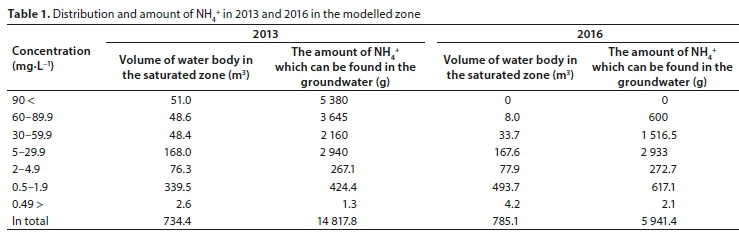
Since the 3D kriging interpolation method provides us with a more accurate picture of the spatial distribution of contaminants, a static hydrogeological model was created using the Rockworks software. In 2013 the groundwater dome caused by the sewage water flowing out from the tank could be observed (Fig. 8-I,II,III); by 2016, 1.5 years after the last sewage water emissions, the dome had completely disappeared (Fig. 8-IV,V,VI). In 2013, in a layer modelled with the software down to a depth of 3 m, a concentration above 90 mg∙L−1 in 51 m3 from a water body of 734.4 m3 of the saturated zone was measured (Fig. 8-III), while the modelled saturated zone can be considered almost entirely contaminated in 2013 and 2016. (Fig. 8-I,IV).
Based on the water volumes established in the modelled zone, the amount of NH4+ in the study area in 2013 and 2016 was estimated (Table 1). Even though the groundwater level had increased slightly by 2016, causing the volume of the saturated zone to increase, the amount of NH4+ had decreased to almost a third of its former value.
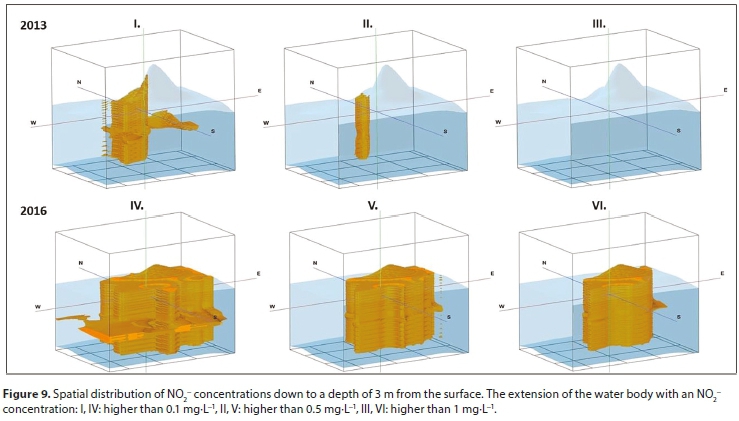
Spatial distribution and amount of NO2−
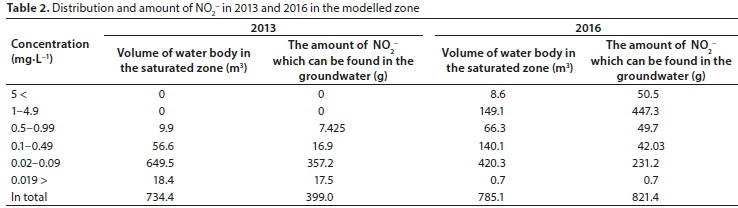
The NH4+ content originating from the decomposition of the organic materials is oxidized into nitrite through the activity of Nitrosomonas bacteria under aerobic conditions. In 2013, in the majority of the modelled saturated zone the amount of NO2− was under the contamination limit (0.1 mg∙L−1) (6/2009 Government Decree) in 677 m3 of a water body of 734 m3 (Fig. 9-I), and it was present in a concentration above 0.5 mg∙L−1 only in a water body of 10 m3 (Fig. 9-II).
In 2016, however, a significant increase in the concentration of NO2− could be identified, since after ending sewage water emissions the conditions for nitrification improved in the direct vicinity of the sewage tank. While in 2013 a concentration above 1 mg∙L−1 was not measured, in 2016 the concentration increased to a level of 1 mg∙L−1 in 149 m3 of a water body of 785 m3 (Fig. 9-VI, Table 2). The amount of NO2− increased to a value more than 2 times higher than that of the value measured in 2013 (Table 2).
Spatial distribution and amount of NO3−
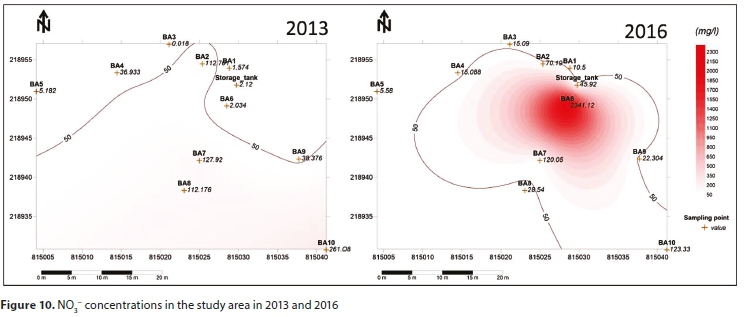
Under aerobic conditions the amount of NO2− is not maintained in the water for a long period of time, because it is oxidized into nitrate through the activity of the Nitrobacter bacteria. In the case of NO3− significant changes can be identified as well. While in the vicinity of the sewage tank a concentration of 1-3 mg∙L−1 was measured in 2013 (Fig. 10-A), the concentrations increased drastically after the sewage tank went out of use. The concentration value increased from the 2.02 mg∙L−1 measured in 2013, to 2 341 mg∙L−1 in the BA6 monitoring well, which is almost 50 times higher than the contamination limit of 50 mg∙L−1 (6/2009 Government Decree), equivalent to the maximum permissible limit of nitrate concentration in drinking water required by the WHO (WHO, 2011) (Fig. 10-B). Significant changes can also be detected regarding the spatial distribution of concentrations. While in 2013 the NO3− values showed a gradual increase as one moved away from the well, in 2016 these values had decreased in the same direction.
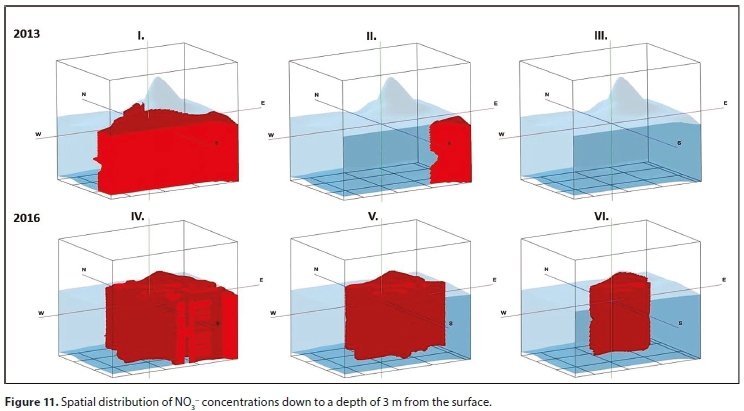
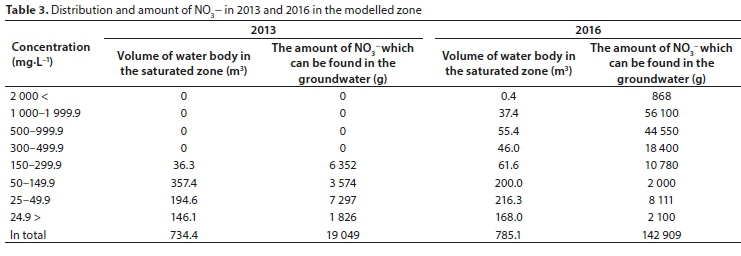
While in 2013 no water bodies with a concentration above 500 mg∙L−1 were found in the modelled saturated zone, in 2016, from a water body of 785 m3, 94 m3 and 37 m3 showed concentrations above 500 mg∙L−1 and 1 000 mg∙L−1, respectively (Fig. 11, Table 3).
The extension of the water body with an NO3−concentration: I, III: higher than 50 mg∙L−1, II, V: higher than 150 mg∙L−1, III, VI: higher than 500 mg∙L−1.
Based on the estimation performed, the amount NO3− present in the modelled zone had increased 7.5 times from 19 049 g in 2013, to reach a value of 142 909 g by 2016 (Table 3).
Similarly to NO2−, in the case of NO3− the conditions for nitrification significantly improved as a consequence of the ending of fresh sewage water emissions, and this led to extremely high concentrations in the direct proximity of the sewage tank.
Ratio and mass balance of inorganic nitrogen forms
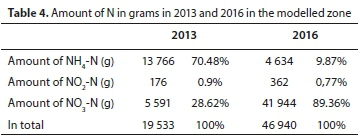
The ratio of NH4-N, NO2−N and NO3−N is a very important index combination from the perspective of the cleaning process of waters. After the identification of inorganic nitrogen forms the values of NH4-N, NO2−N and NO3−N were calculated in grams. It was concluded that in the modelled zone 1.5 years after the closure of the sewage tank the amount of nitrogen present in inorganic forms had increased from 19 533 g to 46 940 g, which is more than twice as high as the baseline value in 2013.
With regard to the nitrogen forms investigated it was not expected that inside the modelled zone the nitrogen concentration would increase after the closure of the sewage tank. This increase can be explained by the fact that the sewage tank had been in use for 27 years, and during this time a large amount of organic material accumulated in the vicinity of the sewage tank, the decomposition of which provided the source for the permanent creation of inorganic nitrogen forms, even after the sewage tank went out of use. This is proven by the NH4+ concentration of close to 80 mg∙L−1 which was measured in the BA1 well found in the direct vicinity of the sewage tank (Fig. 5), which was measured 1.5 years after the sewage tank was closed.
During the period when the sewage tank was in use, the organic nitrogen forms were predominant in the direct vicinity of the sewage tank. This suggests that the increase in inorganic nitrogen forms after the ending of the sewage water emissions can only be explained by the alteration of the previously accumulated organic forms. Thus the amount of organic nitrogen constantly decreases, since the supply of organic material has stopped.
Significant changes also took place regarding the ratio between inorganic nitrogen forms. The ratio of NH4+ decreased from 70% to under 10%. Among the more oxidized forms the ratio of NO2− did not show a significant change, which can be explained by the fact that in the presence of oxygen NO2− oxidizes into nitrate at a faster rate. While in 2013, 29% of the inorganic nitrogen forms were nitrate, by 2016 this value had increased to close to 90% (Table 4). Based on the above it can be concluded that the degree of oxidation of nitrogen had significantly increased by 2016.
CONCLUSIONS
Our hypothesis that in the vicinity of uninsulated sewage tanks the groundwater is heavily contaminated was clearly verified. For each parameter investigated in the immediate vicinity of the sewage tank, concentrations characteristic of raw wastewater were measured (COD, NH4+, NO2−, NO3−).
Our hypothesis, however, that 1.5 years after the ending of sewage water emissions the extent of contamination would significantly decrease, has not been confirmed. A decrease in the concentration of NH4+ could be detected, while the amount of NO3− increased, which can be partly explained by the fact that after the ending of sewage water emissions the conditions for nitrification were improved. The OM content of the soil near the sewage tank was significantly higher than at the border of the modelled area, which is the result of the accumulation of organic matter leaking from the sewage tank over decades. A similar spatial distribution in the COD values of the groundwater was detected, which remained 1.5 years after the closure of the sewage tank.
The rate of the cleaning process primarily depends on the amount of organic material accumulated in the vicinity of the source of contamination, therefore the amount of inorganic nitrogen forms can only be expected to decrease after the decomposition of organic materials. Based on our results it can be concluded that the cleaning process of the groundwater has already started, but could still take years to finish.
Even though our investigations focused on a specific sewage tank, the processes occurring in the study area can be generalized to any equipment from which sewage water can be emitted into the groundwater.
CONFLICT OF INTEREST
The authors declare no conflict of interest.
ACKNOWLEDGMENTS
The research was financed by the Higher Education Institutional Excellence Programme (20428-3/2018/FEKUTSTRAT) of the Ministry of Human Capacities in Hungary, within the framework of the 4.thematic programme of the University of Debrecen.
REFERENCES
ABDALLA F and KHALIL R (2018) Potential effects of groundwater and surface water contamination in an urban area, Qus City, Upper Egypt. J. Afr. Earth Sci. 141 164-178. https://doi.org/10.1016/j.jafrearsci.2018.02.016 [ Links ]
ADAMS JB, PRETORIUS L and SNOW GC (2019) Deterioration in the water quality of an urbanised estuary with recommendations for improvement. Water SA 45 (1) 86-96. https://doi.org/10.4314/wsa.v45i1.10 [ Links ]
ADHANOM G, HUGHES J and ODINDO A (2018) The effect of anaerobic baffled reactor effluent on nitrogen and phosphorus leaching from four soils in a laboratory column experiment. Water SA 44 (1) 1-12. https://doi.org/10.4314/wsa.v44i1.01 [ Links ]
ADUMITROAEI M V, GAVRILOAIEI T, SANDU A V and IANCU GO (2016) Distribution of mineral nitrogen compounds in groundwater in Vaslui County (Romania). Cancer 12 13. [ Links ]
ATTOUI B, TOUMI N, MESSAOUDI S and BENRABAH S (2016) Degradation of water quality: the case of plain west of Annaba (northeast of Algeria). J. Water Land Dev. 31 3-10. https://doi.org/10.1515/jwld-2016-0031 [ Links ]
AUGUSTSSON A, UDDH SÖDERBERG T, JARSJÖ J, ÅSTRÖM M, OLOFSSON B, BALFORS B and DESTOUNI G (2016) The risk of overestimating the risk-metal leaching to groundwater near contaminated glass waste deposits and exposure via drinking water. Sci. Total Environ. 566-567 1420-1431. https://doi.org/10.1016/j.scitotenv.2016.06.003 [ Links ]
BANKS D, KARNACHUK OV, PARNACHEV VP, HOLDEN W and FRENGSTAD B (2002) Groundwater contamination from rural pit latrines: examples from Siberia and Kosova. Water Environ. J. 16 147-152. https://doi.org/10.1111/j.1747-6593.2002.tb00386.x [ Links ]
BENRABAH S, ATTOUI B and HANNOUCHE M (2016) Characterization of groundwater quality destined for drinking water supply of Khenchela City (eastern Algeria). J. Water Land Dev. 30 13-20. https://doi.org/10.1515/jwld-2016-0016 [ Links ]
DEVIC G, DJORDJEVIC D and SAKAN S (2014) Natural and anthropogenic factors affecting the groundwater quality in Serbia. Sci. Total Environ. 468-469 933-942. https://doi.org/10.1016/j.scitotenv.2013.09.011 [ Links ]
DRAKE VM, and BAUDER JW (2005) Ground water nitrate‐nitrogen trends in relation to urban development, Helena, Montana, 1971-2003. Groundwater Monit. Remediation 25 (2) 118-130. https://doi.org/10.1111/j.1745-6592.2005.0017.x [ Links ]
EDO FA, EJIOGU CC, UZOIJE AP, NWACHUKWU MA and OKOLI CG (2014) Impact of open sewage dumpsites on groundwater quality in Igwuruta, Rivers State, Nigeria. J. Glob. Biosci. 3 (6) 919-930. [ Links ]
FANTONG WY, FOUEPE AT, DJOMOU SL, BANSEKA HS, ANAZAWA K, ADELANA SMA and NKENG GE (2013) Temporal pollution by nitrate (NO3), and discharge of springs in shallow crystalline aquifers: Case of Akok Ndoue catchment, Yaounde (Cameroon). Afr. J. Environ. Sci. Technol. 7 (5) 167-174. [ Links ]
GOODDY DC, MACDONALD DMJ, LAPWORTH DJ, BENNETT SA and GRIFFITHS KJ (2014) Nitrogen sources, transport and processing in peri-urban floodplains. Sci. Total Environ. 494 28-38. https://doi.org/10.1016/j.scitotenv.2014.06.123 [ Links ]
HANCHAR DW (1991) Effects of septic-tank effluent on ground-water quality in Northern Williamson County and Southern Davidson County, Tennessee. U.S. Geological Survey Water-Resources Investigations Report 91-4011. USGS, Nashville, Tennessee. https://doi.org/10.3133/wri914011 [ Links ]
HEATWOLE KK and MCCRAY JE (2007) Modeling potential vadose-zone transport of nitrogen from onsite wastewater systems at the development scale. Contam. Hydrol. 91 184-201. https://doi.org/10.3133/wri914011 [ Links ]
HUNGARIAN STANDARDS INSTITUTION (1998) MSZ-21464:1998. Sampling of groundwaters. Hungarian Standards Institution, Budapest. [ Links ]
KRINGEL R, RECHENBURG A, KUITCHA, D, FOUÉPÉ A, BELLENBERG S, KENGNE IM and FOMO MA (2016) Mass balance of nitrogen and potassium in urban groundwater in Central Africa, Yaounde/Cameroon. Sci. Total Environ. 547 382-395. https://doi.org/10.1016/j.scitotenv.2015.12.090 [ Links ]
KSH (2015) Hungarian Central Statistical Office. URL: https://www.ksh.hu/docs/hun/hnk/hnk_2015.pdf (Accessed 24 March 2017). [ Links ]
KSH (2017) Hungarian Central Statistical Office. URL: http://www.ksh.hu/docs/hun/xstadat/xstadat_eves/i_zrk006.html (Accessed 21 March 2018). [ Links ]
LITERÁTHY P (1973) United Water Examination Methods I. Chemical methods (in Hungarian). Vol. 1, Department IV of Water Quality and Water Technology of the Water Management Scientific Research Institute, Budapest, Hungary. 233 pp. [ Links ]
MCARTHUR JM, SIKDAR PK, HOQUE MA and GHOSAL U (2012) Waste-water impacts on groundwater: Cl/Br ratios and implications for arsenic pollution of groundwater in the Bengal Basin and Red River Basin. Vietnam. Sci. Total Environ. 437 390-402. https://doi.org/10.1016/j.scitotenv.2012.07.068 [ Links ]
MCQUILLAN D (2004) Ground-water quality impacts from on-site septic systems. Proceedings, National Onsite Wastewater Recycling Association, 13th Annual Conference, Albuquerque, NM, 7-10 November 2004. 13. [ Links ]
MESTER T, SZABÓ GY, BALLA D, KARANCSI G, SZABÓ G and TÓTH CS (2016) Egy nem zárt rendszerű szennyvízakna talajvízszintre gyakorolt hatásának vizsgálata (in Hungarian) [The investigation of the effects of an open sewage tank on the groundwater level]. Theory meets practice in GIS VII. 311-317. [ Links ]
MESTER T, SZABÓ GY, BESSENYEI É, KARANCSI G, BARKÓCZI N and BALLA D (2017) The effects of uninsulated sewage tanks on groundwater. A case study in an eastern Hungarian settlement. J. Water Land Dev. 33 123-129. https://doi.org/10.1515/jwld-2017-0027 [ Links ]
MESTER T and SZABÓ G (2013). Nitrate contamination in the groundwater wells of an Eastern Hungarian settlement. In: Ozdemir CC, Şahinkaya S, Kalıpcı E, and Oden MK (eds) International Conference on Environmental Science and Technology, Cappadocia. Conference CD. Digital Proceeding of THE ICOEST'2013. 1-16. [ Links ]
MICHÉLI E, FUCHS M, HEGYMEGI P and STEFANOVITS P (2006) Classification of the major soils of Hungary and their correlation with the World Reference Base for Soil Resources (WRB). Agrochem. Soil Sci. 55 (1) 19-28. https://doi.org/10.1556/agrokem.55.2006.1.3 [ Links ]
MOODLEY KG, SOBANTU P, GERICKE G, CHETTY DK and PIENAAR DH (2017) Comparison of UV and ELS detectors in HSPEC analysis of natural organic matter in dam water. Water SA 43 (3) 520-528. https://doi.org/10.4314/wsa.v43i3.17 [ Links ]
MÜLLER HW, DOHRMANN R, KLOSA D, REHDER S and WOLF ECKELMANN W (2009) Comparison of two procedures for particle-size analysis: Köhn pipette and X-ray granulometry. J. Plant Nutr. Soil Sci. 172 172-179. https://doi.org/10.1002/jpln.200800065 [ Links ]
NIEDER R, BENBI DK and SCHERER HW (2011 Fixation and defixation of ammonium in soils: a review. Biol. Fertil. Soils 47 (1) 1-14. https://doi.org/10.1007/s00374-010-0506-4 [ Links ]
NLEND B, CELLE-JEANTON H, HUNEAU F, KETCHEMEN-TANDIA B, FANTONG WY, BOUM-NKOT SN and ETAME J (2018) The impact of urban development on aquifers in large coastal cities of West Africa: Present status and future challenges. Land Use Polic. 75 352-363. https://doi.org/10.1016/j.landusepol.2018.03.007 [ Links ]
NOVÁK TJ and TÓTH CSA (2016) Development of erosional microforms and soils on semi-natural and anthropogenic influenced solonetzic grasslands. Geomorphology 254 121-129. https://doi.org/10.1016/j.geomorph.2015.11.018 [ Links ]
REAY WG (2004) Septic tank impacts on groundwater quality and nearshore sediment nutrient flux. Ground Water 42 (7) 1079-1089. https://doi.org/10.1111/j.1745-6584.2004.tb02645.x [ Links ]
ROBERTSON WD, MOORE TA, SPOELSTRA J, Li L, ELGOOD RJ, CLARK ID, SCHIFF SL, ARAVENA R and NEUFELD JD (2012). Natural attenuation of septic system nitrogen by Anammox. Ground Water 50 541-553. https://doi.org/10.1111/j.1745-6584.2011.00857.x [ Links ]
ROBERTSON WD, VAN STEMPVOORT DR, ROY JW, BROWN SJ, SPOELSTRA J, SCHIFF SL, RUDOLPH DR, DANIELESCU S and GRAHAM G (2016) Use of an artificial sweetener to identify sources of groundwater nitrate contamination. Ground Water 54 579-587. https://doi.org/10.1111/gwat.12399 [ Links ]
SIMMONS RC, GOLD AJ and GROFFMAN PM (1992) Nitrate dynamics in riparian forests: groundwater studies. J. Environ. Qual. 21 659-665. https://doi.org/10.2134/jeq1992.00472425002100040021x [ Links ]
SMOROŃ S (2016) Quality of shallow groundwater and manure effluents in a livestock farm. J. Water Land Dev. 29 59-66. https://doi.org/10.1515/jwld-2016-0012 [ Links ]
STEFANOVITS P, FILEP GY and FÜLEKY GY (1999) Soil sciences (in Hungarian) Mezőgazda Kiadó, Budapest. [ Links ]
SZABÓ GY, BESSENYEI É, HAJNAL A, CSIGE I, SZABÓ G, TÓTH CS, POSTA J and MESTER T (2016) The use of sodium to calibrate the transport modeling of water pollution in sandy formations around an uninsulated sewage disposal site. Water Air Soil Pollut. 227 (2) 1-13. https://doi.org/10.1007/s11270-015-2742-6 [ Links ]
TAKÁCS J (2013) Possibilities for reducing the nutrient content of domestic wastewaters. hulladékOnline. 4 (1). [ Links ]
The joint decree nr. 6/2009 (IV. 14.) of KvVM-EüM-FVM [the Hungarian Ministries of Environment, Healthcare and Agriculture, respectively] about the limit values and standard procedures to assess the pollution level, in order to protect the geological medium and ground waters against pollution. [ Links ]
WHO (2011) Guidelines for Drinking-water Quality (4th edn). World Health Organization, Geneva. 541 pp. [ Links ]
WOLF L, HELD I, EISWIRTH M and HÖTZL H (2004) Impact of leaky sewers on groundwater quality, Acta Hydrochim. Hydrobiol. 32 (4−5) 361-373. https://doi.org/10.1002/aheh.200400538 [ Links ]
ZAMARIN JA (1928) Calculation of ground-water flow (in Russian). Trudey I.V.H. Taskeni. [ Links ]
Received 2 July 2018
Accepted in revised form 2 July 2019
* Corresponding author, email: mester.tamas@science.unideb.hu

