


Servicios Personalizados
Articulo
 Inglés (pdf)
 Articulo en XML
 Referencias del artículo
Indicadores

Links relacionados
-
 Citado por Google
 -
 Similares en Google
Compartir

 Permalink
Water SA
versión On-line ISSN 1816-7950
versión impresa ISSN 0378-4738
Water SA vol.45 no.3 Pretoria jul. 2019
http://dx.doi.org/10.17159/wsa/2019.v45.i3.6711
RESEARCH PAPERS
Modelling mesophilic-thermophilic temperature transitions experienced by an aerobic membrane bioreactor treating furfural plant effluent
LG Kay; CJ Brouckaert*; RC Sindall
Pollution Research Group, Department of Chemical Engineering, University of KwaZulu-Natal, King George V Avenue, Durban, 4041, South Africa
ABSTRACT
A mathematical model was developed of an aerobic membrane bioreactor (MBR) treating effluent from a by-products facility at a sugar mill producing furfural, based on measurements of microbial kinetics and stoichiometry at different temperatures. The model was calibrated and validated against plant data using volumetric flow into the MBR and volumetric sludge wasting from the MBR as inputs. The model is able to predict steady-state and unsteady-state operation of the MBR under both mesophilic and thermophilic conditions, and the transitions between the two regimes. Comparison of model simulations and plant data suggests that thermophilic operation is advantageous, but it is less stable than mesophilic operation and frequent feed disruptions can have detrimental effects on MBR operation.
Keywords: wastewater treatment modelling, furfural process effluent, thermophilic, physico-chemical framewor
INTRODUCTION
The Sezela Mill Complex, operated by the Illovo Group, consists of a sugar mill with an attached downstream products facility. The downstream site includes a furfural production plant and a range of smaller plants that produce derivatives of furfural. The furfural plant generates an effluent as a by-product of the furfural production process, which is acidic in nature and has a high chemical oxygen demand (COD). The COD consists primarily of acetic acid, with minor amounts of formic acid and intermittent furfural contamination (Judd, 2011). The discharge of the effluent has a negative effect on the mill's water balance. Possible treatment of the effluent therefore provides an opportunity for water recovery, attractive for financial and environmental reasons. This prompted the construction of a pilot-scale aerobic membrane bioreactor (MBR).
The MBR has a hydraulic design capacity of 1 200 m3∙d−1 but in practice treats a feed flow rate of no more than 1 000 m3∙d−1. The MBR is a 4 600 m3 (29 m diameter, 7 m depth) open cylindrical tank and air is supplied to the mixed liquor through diffusers distributed along the bottom of the tank. It is fitted with a bank of 12 EK400 Kubota flat sheet modules, with a total membrane area of 2 840 m2, submerged within the tank. Two 224 kW blowers, rated at 7 060 Nm3∙h−1 at 740 mbar, supply air via the fine bubble diffusers along the floor of the tank. A third 61.5 kW blower, rated at 2 880 Nm3∙h−1 at 500 mbar, also supplies air as coarse bubbles to scour and clean the membranes. MBR technology was selected due to the suspected presence of an unknown trace toxin in the process effluent that is thought to inhibit conventional aerobic or anaerobic treatment (Judd, 2011). The high (12 to 14 g/L) mixed liquor suspended solids (MLSS) achieved by the MBR is thought to overcome this limitation.
When a steady high feed rate can be sustained, the temperature rises to around 50°C (thermophilic operation), and at a steady low feed rate it operates at around 40°C (mesophilic operation). During mesophilic operation the hydraulic retention time (HRT) is approximately 13 days, and the sludge retention time (SRT) approximately 105 days. For thermophilic operation, the HRT and SRT are about 6 days and 55 days, respectively.
Feed fluctuations to the MBR occur frequently, due to both external and internal operational factors. During these fluctuations, the temperature of the MBR shifts, which often results in a transition between mesophilic and thermophilic temperature regimes. The transition to lower temperature is marked by a dramatically reduced biomass activity, which leads to operational instability.
Thermophilic operation has the advantages of specific reaction rates several times higher than those for mesophilic operation, and lower sludge production. However, more aeration is required, there is an increased tendency for foaming, and the sludge may have poor settling characteristics (LaPara and Alleman, 1999).
It was proposed that an integrated model capable of predicting temperature, pH and biomass activity (via oxygen utilization rate) would be a useful tool to explore design options and to devise operational strategies that best mitigate feed fluctuations and keep the process as stable as possible.
There has recently been a coordinated effort to establish a comprehensive modelling framework for bio-processes, extending the representation of the biologically mediated reactions to include other physico-chemical phenomena which interact with them (e.g. Batstone et al., 2012; Lizarralde et al., 2015; Solon et al., 2017). Although the energy balance is a logical part of such a framework, it has not received much attention up to now, as few bio-processes involve sufficiently large energy transfers to cause significant interactions with the material transformations taking place. The Illovo MBR model provided an opportunity to demonstrate the incorporation of the energy balance into the framework in a particularly uncomplicated example. It has only one rate-limited biological reaction, four ionic equilibrium systems (acetate, carbonate, ammonia and phosphate), two phase transfer processes (evolution of carbon dioxide and evaporation of water), and one energy balance. Although the energy balance contains a number of terms, those representing transfers to or from the environment turned out to be minor compared to those originating within the process itself.
This study describes the development of a mathematical model of the mass and energy balances over the MBR, based on measurements of the microbial kinetics and stoichiometry at different temperatures. The model was used to simulate the dynamic operation of the MBR under mesophilic and thermophilic modes of operation and the transition between the two temperature regimes.
METHODS
The investigation involved a combination of experimental work and model development.
Experimental methods
Influent to the MBR was sampled daily and used to produce weekly composite samples. The composite samples were tested for COD using the standard closed reflux, colorimetric method (5220 D) and for total acidity using a titrimetric method using 0.1 N sodium hydroxide (2310 B) (Bridgewater et al., 2012).
The mixed liquor was sampled near the MBR surface when the blowers were running to ensure adequate homogeneity, and transported immediately to the respirometer to ensure negligible thermal shock. The MBR operating temperature was between 40 and 50°C; the temperature of the sample dropped by no more than 5°C during transportation to the respirometer. The temperature was then increased by the respirometer to the original sampling temperature.
The MLSS concentration of the MBR was obtained daily, following standard methods for total suspended solids (TSS) determination (2540 D) (Bridgewater et al., 2012).
A BM-EVO respirometer (Surcis, 2019) was used to carry out oxygen uptake rate (OUR) tests. This is essentially a 1 L, 2 compartment, mixed reaction vessel, equipped with aeration in one compartment, a circulating pump and a dissolved oxygen (DO) probe in the un-aerated compartment.
The endogenous respiration rate of the MBR mixed liquor was measured by a cyclic OUR test, in which intermittent aeration is used to drive the DO concentration between set limits, and the rate of decline of the oxygen concentration is measured while the aeration is off.
Exogenous respiration rate was measured using a dynamic oxygen uptake response test. After continuous aeration until conditions of endogenous respiration were achieved (about 24 h), the sample was circulated between the aerated and non-aerated compartments, with the DO electrode located in the non-aerated compartment. The drop in DO concentration when substrate is added is a measure of the increased rate of respiration caused by the uptake of the substrate. The relationship between the drop in DO and the reaction rate was established by calibrating the apparatus with a substance with a known chemical oxygen demand (sodium sulphite), and one with a known biological oxygen demand (sodium acetate).
Model development
The model of the Illovo MBR was an assembly of features taken from literature models to match the particular aspects of the system. The biological reactions were formulated following the IWA ASM1 (International Water Association Activated Sludge Model No 1) (Henze et al., 1987), simplified as acetic acid was the only substrate under consideration. ASM1 does not consider energy balances, so the energy balance model of Sedory and Stenstrom (1995) was selected due to its ability to give a complete breakdown of the heat exchange mechanisms occurring, and its extensive use by various authors (LaPara and Alleman, 1999; Gillot and Vanrolleghem, 2003; Makinia et al., 2005).
The development of the model was carried out over the following series of steps:
•A mass balance over the MBR was formulated with a suitable description of the pertinent kinetic processes, and an ionic speciation subroutine was added for prediction of pH
•An energy balance over the MBR was formulated to predict temperature
•A temperature-dependent description of the kinetic parameters in the mass balance was obtained from laboratory tests at mesophilic (40°C) and thermophilic (50°C) temperatures
•The combined mass and energy balance were calibrated using parameters obtained from the experimental work and the literature
•The dynamic model was validated against an independent set of plant data
•A sensitivity analysis was carried out to determine the effects of various parameters in the energy balance on temperature
•The model was used to simulate both mesophilic and thermophilic operation of the MBR and the results used to assess how process operation could be improved
Model components and reactions
The model was formulated in two stages. Initially it only considered biological reactions, using a formulation similar to ASM1. Later, when it was realised that pH was important, because the plant operators used it to regulate the feed to the reactor, equilibrium ionic reactions were added to the model for pH prediction, which required some additional components, and some additional detail in the representation of the existing components.
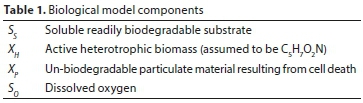
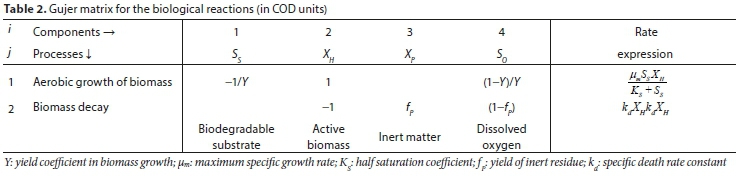
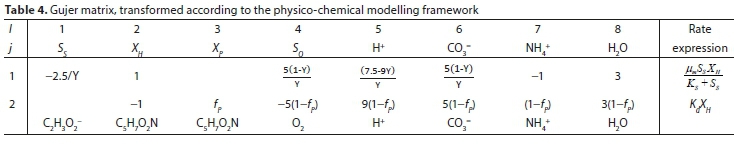
The biological reactions included only growth and decay of heterotrophic microorganisms as the feed contained only soluble, readily biodegradable organic substrate (assumed to be acetic acid). Nitrification was not included in the model, as just sufficient nitrogen and phosphorus were dosed in to satisfy the biomass nutrient requirements. Table 1 lists the components involved in the biological reactions; the stoichiometry and kinetics of the biological reactions are represented as a Gujer matrix in Table 2; the ionic model components are listed in Table 3; the transformed Gujer matrix including ionic components appears in Table 4.
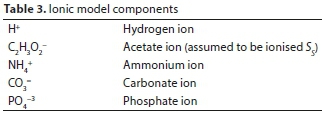
Including pH prediction requires a transformation that is characteristic of the physico-chemical framework: adding relevant ionic components and assigning atomic content to the biological reaction components, so that the interaction between the biological and ionic reactions can be represented. Thus SS was assumed to be acetic acid C2H4O2, and XH and Xp were assigned the same elemental formula C5H7O2N.
The stoichiometric coefficients in Table 4 are expressed in molal units rather than COD units as in Table 2, and reflect balances over the reactions on the elements C,H,O,N and electrons. The COD of each component is inherent in its elemental formula, and the unit conversions are 64 g COD∙mol−1 for C2H3O2− and 160 g COD∙mol−1 for C5H7O2N. The parameter Y is not affected by the change in units. The rate expressions continue to use COD units.
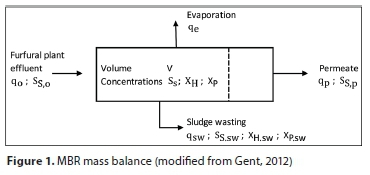
Mass balance
The mass of fluid within the MBR (i.e. liquid level) fluctuates depending on the feed rate into the MBR as well as the sludge and permeate withdrawal rates; these are all independent of one another. To simplify the mass balance, the mass content of the MBR was assumed constant, as plant data shows only small fluctuations in liquid level during operation, ±٠.١ m in 6.5 m.
The overall mass balance was therefore represented as:

Where:
mo is the mass flow rate of the furfural plant effluent fed into the MBR (kg∙s−1)
me is the mass flow rate of evaporation from the MBR (kg∙s−1)
msw is the mass flow rate of sludge wasting from the MBR (kg∙s−1)
mp is the mass flow rate of the permeate from the MBR (kg∙s−1)
Assuming a uniform density throughout the reactor, and of the feed, evaporated water, sludge wasting and permeate streams, the mass balance is written in volumetric terms as follows:

Where:
qo is the volumetric flow rate of the furfural plant effluent fed into the MBR (m3∙s−1)
qe is the volumetric flow rate of evaporation from the MBR (m3∙s−1)
qsw is the volumetric flow rate of sludge wasting from the MBR (m3∙s−1)
qp is the volumetric flow rate of the permeate from the MBR (m3∙s−1)
This is illustrated in Fig. 1.
Component mass balances
Complete mixing of the MBR contents was assumed for the mass balance model; therefore the soluble concentrations of each of the components in the outlet streams (permeate and sludge wasting) were taken as equal to the concentrations of each component within the MBR. It was assumed that no solids pass through the membranes; consequently, the solids concentration of the waste sludge stream is the same as that in the MBR.
Readily biodegradable substrate, SS
SS enters the MBR with the feed, exits through the sludge wasting and permeate streams, and is consumed by reaction. It was assumed that soluble SS can pass through the membrane. The furfural plant effluent is primarily acetic acid; SS is assumed to consist entirely of acetic acid. The mass balance for the substrate is:

Where:
SS,o is the concentration of the substrate in the furfural plant effluent stream (kg∙m−3)
SS,sw is the concentration of the substrate in the sludge wasting stream (equal to residual substrate concentration SS) (kg∙m−3)
SS,p is the concentration of substrate in the permeate (equal to residual substrate concentration SS) (kg∙m−3)
rSS is the rate of consumption of the substrate (kg∙m−3∙s−1)
V is the volume of the mixed liquor within the MBR (m3)
Active heterotrophic biomass, XH
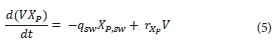
The model assumes no biomass enters the MBR with the feed; it is only generated from growth on SS. Sludge dosing from the neighbouring conventional activated sludge (CAS) plant was not considered, which occasionally occurs in practice to boost the microbial population. The biomass was modelled with complete retention by the membranes; it was assumed that particulate material can only be removed through sludge wasting. The mass balance for active biomass is:
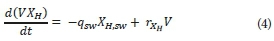
Where:
XH,sw is the concentration of the biomass in the sludge wasting stream (equal to residual biomass concentration XH) (kg∙m−3)
rXH is the biomass growth rate (kg∙m−3∙s−1)
Inert organic matter from decay, XpP
XP is particulate material generated during the decay of biomass, and is only removed through sludge wasting. The mass balance for XP within the MBR is:
Where:
XP,sw is the concentration of inert organic matter from decay (equal to residual inert organic matter concentration XP) (kg∙m−3)
rXP is the rate of inert organic matter from decay formation (kg∙m−3∙s−1)
Energy balance
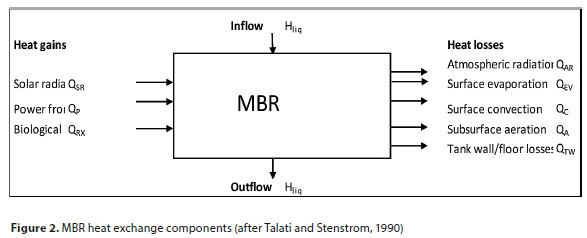
The energy balance model of Sedory and Stenstrom (1995) was selected due to its detailed set of heat exchange mechanisms, and its extensive use by several authors (LaPara and Alleman, 1999; Gillot and Vanrolleghem, 2003; Makinia et al., 2005). The assumption of complete mixing implies a uniform temperature in the MBR, equal to the outlet stream temperature.
The overall energy balance is represented by:
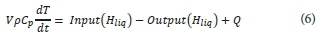
Where Q is the sum of the various heat transfer terms illustrated in Fig. 2:

Where:
QSR is the heat gain from solar radiation (W)
QAR is the heat loss from atmospheric radiation (W)
QC is the heat loss due to surface convection (W)
QEV is the heat loss due to surface evaporation (W)
QA is the heat loss due to aeration (W)
QTW is the heat loss due to convection from the tank sides and floor (W)
QRX is the heat gain from the exothermic reaction (W)
QP is the heat gain from the compressors (W)
Input(Hliq) and Output(Hliq) sre the enthalpy input and output terms, respectively (W).
Enthalpy flows
The enthalpy terms consider the heat provided or lost by the liquid streams entering and leaving the MBR. They do not include enthalpy lost due to evaporation of water from the MBR, which is accounted for separately through the surface evaporation and aeration heat transfer terms.
The enthalpy terms are defined as follows:
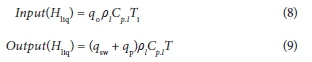
Where:
ρl is the density of the MBR inlet and outlet streams, assumed equal to water (kg∙m−3)
Ti is the influent temperature (°C)
T is the MBR temperature (°C)
Cp.l is the liquid heat capacity, assumed to be constant at 4 170 J∙kg−1∙K−1
Solar radiation
Radiation from the sun is an important factor due to the open surface of the MBR. A correlation was developed by Raphael (1962) to predict the contribution from solar radiation to the energy balance:
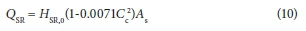
Where:
CC is the cloud cover (tenths)
AS is the surface area of the reactor contents in direct contact with the environment (m2)
HSR,0 is the average daily absorbed solar radiation for clear sky conditions (W∙m−2)
This is dependent on meteorological conditions, site latitude, and the time of year. The average daily absorbed solar radiation may be calculated from a simplified form presented by Talati and Stenstrom (1990):
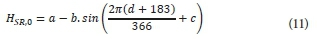
Where:
d is the day of the year (out of 366)
The values for a, b and c are obtained from the following correlations:
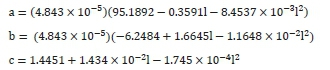
Where:
l is the latitude of the reactor (°)
This correlation is valid between 26° and 46° latitude and must be adjusted by adding 183 days for use in the Southern Hemisphere.
Atmospheric radiation
The heat exchange that results from atmospheric radiation is based on Stefan Boltzmann's radiation law. This is expressed as the difference between the incoming and back radiation as follows:
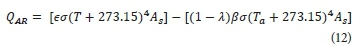
Where:
ϵ is the water-surface emissivity
σ is the Stefan-Boltzmann constant (W∙m−2∙K-4)
λ is the water-surface reflectivity
β is the atmospheric radiation factor
Ta is the ambient temperature (°C)
The atmospheric radiation factor β ranges between 0.75 and 0.85 for most conditions. Previous research has found that 0.97 and 0.03 are good estimates for the emissivity and reflectivity of water (ϵ and λ), respectively (Talati and Stenstrom, 1990).
Surface convection
The temperature difference between the air and the water surface provides the driving force for heat loss by surface convection. The following was obtained from Novotny and Krenkel (1973):
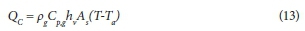
Where:
ρg is the density of air (kg∙m−3)
Cp,g is the specific heat of air at constant pressure (J∙kg−1∙K−1)
hv is the convective transfer coefficient (m∙s−1)
The rate of convective heat loss is affected by the vapour transfer coefficient, which is dependent on the wind velocity. The following equation was developed by Novotny and Krenkel (1973):

Where WS is the wind speed (m∙s−1)
Surface evaporation
The calculation of the heat loss due to evaporation from the MBR mixed liquor surface developed by Novotny and Krenkel (1973) is dependent on wind velocity, relative humidity, and temperature:
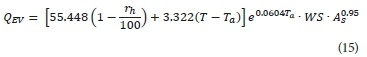
Where:
rh is the relative humidity of ambient air (%).
Aeration
Evaporation of water occurs in the course of contact between air from aerators and water in the tank. Air bubbles are assumed to enter the MBR at ambient temperature and humidity, and leave the system at the MBR operating temperature, saturated with water vapour (Novotny and Krenkel, 1973). The amount of water transferred depends on the air flowrate, tank temperature, ambient air temperature, and relative humidity.
The evaporative heat losses are dependent on the difference in the vapour pressure between the water and air. The equation was developed by Novotny and Krenkel (1973) and modified to this final form by Talati (1988):
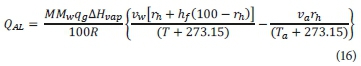
Where:
QAL is the evaporative heat loss due to aeration (W)
R is the universal gas constant (8.314 J∙mol−1∙K−1)
va is the vapour pressure of water at air temperature (Pa)
vw is the vapour pressure of water at reactor temperature (Pa)
hf is the exit air humidity factor - assumed to be 1, as air is assumed to be saturated at exit
MMw is the molar mass of water (kg∙mol−1)
∆Hvap is the latent heat of evaporation (J∙kg−1)
Tank wall and floor conduction/convection
Heat losses from the aeration tank walls and floor depend upon the material of construction, the heat transfer area, and its thickness. Heat transfer coefficients for the tank material to air and the tank material to earth are different. Therefore, this model includes two terms: one for the MBR tank wall area exposed to air and one for the MBR tank area exposed to the ground.
The governing equation is as follows:
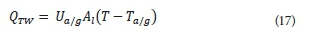
Where:
Ua/g is the overall heat transfer coefficient for conduction from liquid phase through the reactor walls to air/ground (W∙m−2∙K−1)
Al is the area of the reactor that surrounds the liquid phase (m2)
Ta/g is the temperature of the air/ground (°C)
The overall heat transfer coefficient is given by:
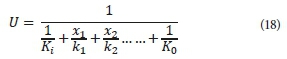
Where:
xi is the thickness of materials (m)
k1 is the thermal conductivity of materials (W∙m−1∙K−1)
Ki is the surface conductance at the air-surface area inside the tank (W∙m−2∙K−1)
Ko is the surface conductance at the air-surface area outside the tank (W∙m−2∙K−1)
The factor 1/Ki becomes zero if liquid is in contact with the surface of the wall. If the outside wall is in contact with air, an approximate value of K0 is taken as 33.90 W∙m−2∙K−1. If the wall is surrounded by an earth embankment greater than 3 m thick, K0 becomes 0.285 W∙m−2∙K−1 (Sedory and Stenstrom, 1995).
Heat of reaction
The heat generated from reaction is calculated for the two principle reactions, the growth of biomass and the subsequent oxidation of decaying biomass:
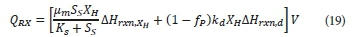
Where:
∆Hrxn,XH is the heat of reaction for the growth reaction (J∙mol X−1)
∆Hrxn,d is heat of reaction for the endogenous respiration reaction (J∙mol X−1)
V is the reactor volume (m3)
The reaction rate expressions in Eq. 19 were previously defined in Table 2, and were assumed to be independent of temperature, and calculated at standard conditions. The heat of reaction for growth (ΔHrxn,) is dependent on the biological yield (Y).
Mechanical power
In diffused aeration systems, the air stream is heated by compression. The heat input to the system is dependent upon the efficiency of the compressor. A fraction of the temperature increase during compression is lost as the bubbles expand when they rise through the medium.
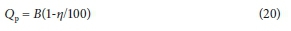
Where:
B is the power of the aerator/compressor (W)
η is the efficiency of the aerator/compressor (%)
Implementation in MATLAB
The mass balance, energy balance, and speciation routine for the prediction of pH were simulated using MATLAB R2010a.
The mass and energy balances form a set of linked ordinary differential equations (ODE's). Their solution was found by numerical integration using the MATLAB function 'ode23t'.
RESULTS
The results from the laboratory investigation were values and temperature dependence of the reaction kinetic parameters. These were then combined with several sets of historical plant data to calibrate and validate the whole model.
Reaction kinetic parameters
Specific death rate constant, kd
To determine kd of the activated sludge, cyclic OUR tests were performed using the respirometer. The mixed liquor sample was aerated for 24 h prior to the test to ensure any external substrate present in the sample was consumed, and endogenous respiration reached. A plot of the natural logarithm of the OUR during endogenous respiration, as a function of time, describes the exponential decay of biomass as a straight line with slope kd. For an exponential decay, the relationship between OUR and active biomass concentration does not need to be known, since it does not affect the slope of the logarithmic plot. Three samples were tested at 40°C (mesophilic) and two samples were tested at 50°C (thermophilic). The results of these tests and the average values for each temperature of study are shown in Table 5.
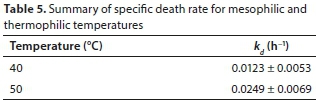
Table 5 shows a two-fold increase in kd between mesophilic and thermophilic operation. This is within the range expected based on other related studies (Vogelaar et al., 2003; Abeynayaka, 2009).
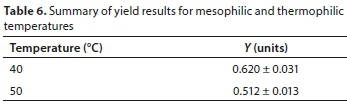
Aerobic yield of heterotrophic biomass, Y
Y was estimated using the dynamic response test performed on the respirometer. Six tests were performed at 40°C, and four tests were carried out at 50°C.
The integral of the respirogram gives the oxygen consumed during the test.
Y was determined from the ratio of the oxygen consumed to the COD of the added substrate. The calculated Y values are shown in Table 6 and it can be seen that it is significantly lower at the higher temperature.
Heterotrophic maximum growth rate μm and half saturation coefficient KS
µm and Ks were determined by fitting a mass balance model of the respirometer to the OUR data. The experimentally determined values for kd and Y were fixed, and µm and Ks were found by regression.
The active biomass concentration was estimated as a fraction of the MLSS concentration. A MLSS to MLVSS (mixed liquor volatile suspended solids) ratio of 0.75, and an active biomass concentration (XH) to MLVSS ratio of 0.35 was used (Casey, 2006; Ubisi et al., 1997).
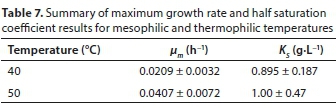
Four respirograms were used for the mesophilic kinetic regression and three respirograms were used for the thermophilic kinetic regression. The average parameter values for each of the temperatures were found and the standard deviation calculated. These results are summarised in Table 7.
Temperature dependence
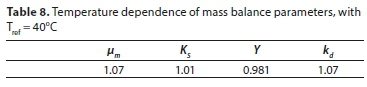
The effect of temperature on the reaction rate of biological processes was expressed empirically as r(T) = r(Tref)•θ(T-Tref) (Tchobanaglous et al., 2003). Estimates of the temperature dependence of these parameter values were derived from values at 40 and 50°C. The values of θ for the various kinetic parameters are shown in Table 8. These experimentally obtained parameters were used as initial estimates in the calibration of the combined MBR model.
pH model
In the physico-chemical modelling approach, the concentrations of ionic components are inputs to an ionic speciation subroutine at each interation step (Brouckaert et al., 2010). The variables of interest that the speciation routine calculates are the pH of the solution, the activity coefficients (γ), the concentrations of the species (c), and the dissolved CO2 concentration. The driving force for CO2 transfer depends on the dissolved CO2 concentration and the partial pressure of CO2 in air bubbles in contact with the liquid. The rate of CO2 evolution to the bubbles controls the accumulation of dissolved CO2, and therefore strongly influences the system pH.
The molar concentration of hydrogen ions entering the MBR was assumed to be the same as the molar concentration of acetic acid, as determined from the measured COD. Urea and phosphoric acid are dosed daily into the MBR to maintain a healthy microbial community. A nutrient dosing ratio of nitrogen and phosphorus was assumed from literature, as COD:N:P of 100:11:2 on a mass basis (1:0.25:0.021 on a molar basis) (Milenko and Vrtovsek, 2004). The pH of the feed stream was matched to plant data by adjusting the carbonate concentration.
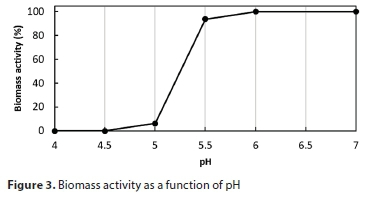
The effect of the pH on the biomass activity in the Illovo MBR had been investigated by Kennedy and Young (2006). Their data were incorporated into the model to simulate the effect of lowered pH on the MBR microbial system. The biomass activities were normalised as percentages, and piecewise linear interpolation between the values was used, as shown in Fig. 3. The biomass activity factor was applied to the growth rate parameter µm.
Model calibration
Calibration of the model against data from the full-scale plant was necessary in order to test the applicability of the kinetic parameters obtained from the laboratory tests, and to establish parameters related to the plant operation. Unfortunately, the reactor was not operating normally during the laboratory and modelling investigation. A fault in a distillation unit in the furfural process resulted in a reduced effluent supply, with the result that thermophilic operation was not achieved during that year (2013), and historical data from 2012 had to be used for the calibration. This had the disadvantages that the biomass used in the laboratory tests might not have been fully representative of the biomass present at the previous time, and that it was not possible to check conditions that had not been recorded, such as wind speed or cloud cover. Furthermore, certain online measurements, notably the temperature of the feed to the reactor, had been overwritten, due to the limited storage capacity of the SCADA control system. In the calibration regression these unknown variables were treated as constant parameters, constrained to fall within their known ranges.
The calibration was carried out in several stages, using different selected sets of plant data from 2012 and 2013. Firstly, 5 periods of relatively steady operation, in which the feed rate, sludge wasting rate and operating temperature remained fairly constant, were selected for steady state calibrations at temperatures between 40°C and 50°C. Then a period was selected during which varying feed rates resulting in a fluctuating temperature for dynamic calibration.
Recorded furfural plant effluent feed rates (q0), and sludge wasting rates (qsw) were used as model inputs for the calibrations. All other input parameters were assumed constant (feed temperature, feed COD concentration, weather conditions, etc.; the final values for these parameters are listed in the Appendix). The regressed parameters were adjusted to fit the measured reactor temperature and sludge concentration, the effluent COD, and, in the final calibration stage, the reactor pH.
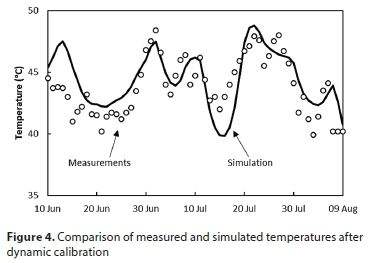
The calibration procedure was able to match the measured temperatures, sludge concentrations and effluent CODs satisfactorily, with parameter values that fell within their expected ranges. For example, the calibrated fit of the reactor temperature is shown in Fig. 4. The reasonable correspondence between simulation and measurements is an indication that the heat transfer terms that were represented by fixed parameter values, although these must have varied considerably over the time period, had relatively little influence on the energy balance.
However, the simulated pH was much less satisfactory, exhibiting much larger fluctuations than observed on the plant (Fig. 5, before re-calibration). The reason was found to be that the active biomass population in the model responded too slowly to changes in the loading rate of acetic acid, to which the reactor pH is very sensitive; i.e., the maximum growth rate µm had been set too low. This had been based on the laboratory data, together with an assumed XH to MLVSS ratio of 0.35 (see Table 7), which was clearly not appropriate for this particular system. It is a recurring problem of such biological reaction models that the growth rates are based on the concentration of live biomass: a modelling construct that is not directly measurable. When a reaction rate is represented as , µm and XH cannot both be inferred from just a measured reaction rate: all that can be inferred is the product (µm XH).
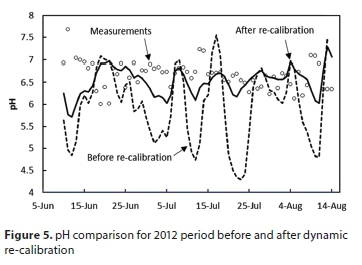
The dynamic calibration was re-run, including µm as a regression parameter. The pH simulation in Fig. 5 shows the substantial improvement between the initial and final calibrations with the root mean squared difference (RMSD) decreasing from 1.14 to 0.47. The decreased fluctuations are a direct result of the increased µm value. This higher value of µm corresponds to lower, but more rapidly varying, concentrations of active biomass (on average 2.5 g/L compared to 3.7 g/L before recalibration). The re-calibration had only marginal effects on the other variables; for example, the RMSD for the temperature decreased very slightly from the 1.66°C of Fig. 4 to 1.61°C.
Even where it is not strictly correct for the biomass being tested, an assumed value for the active biomass concentration should usually be good enough for most purposes, and indeed proved to be good enough for the steady-state calibration of the model. It was even good enough for most aspects of the dynamic calibration; its limitation was only revealed by the poor prediction of the dynamic pH behaviour. So, the dynamic re-calibration raised µm to increase the responsiveness of the reaction rate, while reducing the average XH to maintain the same average reaction rate.
Validation
The final validation of the model was carried out using plant data from 2010, a different period from that of the calibration data. Only q0 and qsw were used as variable model inputs, all other parameters were considered to be constant, and fixed at the values determined by the calibration (see Appendix).
Mesophilic-thermophilic temperature transition
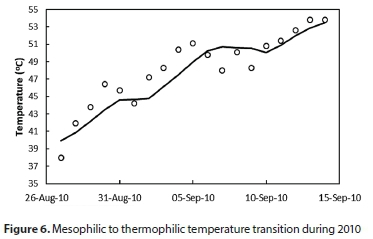
The overall objective of the model was the ability to simulate the transition from mesophilic to thermophilic temperature. To test this, a period of data was found from 2010 that showed a clear transition from under 40°C to above 50°C, with no process upsets and minimal external sludge dosing during the transition. Only qo and qsw obtained from the plant data were used as model input variables.
The model was able to describe the temperature transition between mesophilic and thermophilic regimes as shown in Fig. 6, with RMSD of 1.7°C, following the trends of the data during the transition; thus meeting the primary objective of the model.
Sensitivity analysis
A sensitivity analysis was performed on the final calibrated model to determine the parameters that had the most significant effect on the MBR temperature.
There was a small effect on the MBR temperature for the observed feed temperature range of 36 to 40°C. The effect was more significant for thermophilic operation than for mesophilic, the lowest feed temperature bringing the MBR temperature down to 45°C. The operation of blowers did not have a significant effect on the MBR temperature, with temperature changes of no more than 1°C.
A wind speed of 2 m∙s−1 increases the MBR temperature by around 5°C for mesophilic and thermophilic operation, while a wind speed of ٨ m∙s−1 reduces the temperature by around 4°C for both thermophilic and mesophilic operation. The MBR operating temperature is sensitive to changes in the ambient temperature, between 10 and 40°C. Mesophilic operation is more sensitive, with temperatures varying by ± 9°C while thermophilic temperatures vary by ± 6°C.
The assumption of an average wind speed and the ambient temperature throughout the energy balance calibration will therefore cause some error; these parameters vary considerably in reality. Rainfall by itself does not have a significant effect on the steady-state MBR temperature; however, it is the conditions that tend to come with rainfall, i.e., high wind speeds and low ambient temperatures, which affect the MBR temperature.
The aeration rate and the relative humidity have a significant effect on the evaporation rate from the MBR. As expected, the evaporation rate increases with an increase in aeration, and increases with a decrease in relative humidity. The evaporation rate is always greater at a higher temperature. However, a greater amount of water is evaporated per volume of feed for mesophilic temperatures, approximately double that for thermophilic operation. This is due to the longer hydraulic residence time (HRT) experienced for mesophilic operation.
DISCUSSION AND APPLICATION OF THE MODEL
The model has been shown to be capable of steady-state and dynamic prediction of temperature and pH within the required range for the design and operational model predictions.
The temperature can be accurately predicted to within ٢°C during a dynamic simulation over an extended period of time (over 60 days), with only the feed rate (q0) and the sludge wasting rate (qsw) required as inputs. The model is also capable of pH predictions to within 0.5 pH units.
Both temperature regimes are adequately represented by a single biomass population with temperature-dependent kinetic parameters. This does not necessarily mean that microorganism population does not change, merely that it was not necessary for the model to represent a change to match the available experimental data.
The heat generated by reaction is the largest energy term for both modes of operation, constituting 25% and 36% for mesophilic and thermophilic regimes, respectively. There is a significant difference between the heats of reaction for the regimes, as at thermophilic operation higher microorganism death rates occur, leading to higher heat generation from the exothermic biomass decay.
After final calibration of the model the influent flow rate at mesophilic (40°C) and thermophilic (50°C) operation was determined to be 12.9 m3∙h−1 and 29.3 m3∙h−1 each, respectively. Thus for the same furfural plant effluent feed rate to the MBR, mesophilic operation would require a reactor working volume that is 2.2 times larger than thermophilic operation.
Operational predictions
The model was used to simulate a number of process upset scenarios that the MBR would typically encounter during a season of operation.
Thermophilic-mesophilic/mesophilic-thermophilic process transitions
The feed rate to the MBR was altered following steady-state operation to cause the operating regime to shift from mesophilic to thermophilic, and from thermophilic to mesophilic.
The model was run for 100 simulated hours at the thermophilic flow rate of 29.3 m3∙h−1 to ensure steady conditions, then the feed rate was reduced to 12.9 m3∙h−1 or vice versa, corresponding to HRTs of 5.8 and 13.1 days, respectively. The sludge wasting flow rate was simultaneously switched between the corresponding values of 3.1 and 1.6 m3∙h−1, with corresponding SRTs of 105.7 and 54.6 days, respectively.
Feed flow decrease
The temperature, pH and biomass responses caused by this transition are shown in Figs 7 and 8. As the feed rate is cut the pH of the MBR initially rises rapidly as a result of the rapid depletion of acetic acid at the lower feed rate. The lower XH leads to lower XH growth rates and to an initial decrease in XH. However, as the temperature in the MBR decreases, the XH death rate decreases, which leads to an increase in XH above that observed for thermophilic operation.
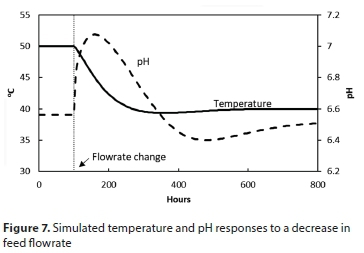

A trial and error search was performed on the model to determine the heating required to maintain the temperature at 50°C at the lower feed rate. The power required to maintain thermophilic operation for a mesophilic feed rate was found to be 790 kW.
Feed flow increase
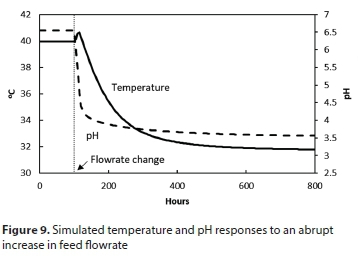
The model predicts that an abrupt increase in feed rate has an adverse effect, as the pH rapidly drops below 5, inhibiting the biological reaction as shown in Fig. 3. Figure 9 shows the modelled pH and temperature responses. The process is unable to recover from this condition without intervention.
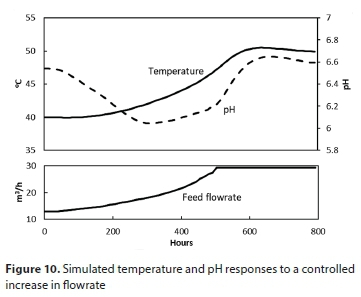
To avoid the sharp pH drop, the abrupt increases in feed and sludge wasting rates were replaced by a gradual transition. The simulated transition from mesophilic to thermophilic operation in this way takes about 400 h (17 days) as seen in Fig. 10.
XH initially increases due to an increased SS concentration, leading to increased XH growth rates. An increase in temperature leads to an increased death rate, which decreases XH, as well as an increase in µm which brings SS back to a steady-state value.
To determine the amount of cooling required to maintain mesophilic operation for a thermophilic feed rate, cooling was applied. It was found by trial that 920 kW is required to maintain a mesophilic temperature for a thermophilic feed rate.
It is time consuming to increase the operating temperature by controlling the feed only, due to its low pH. Temperature drops can occur considerably faster, as there is no pH limitation. It is critical to keep the MBR pH above 6 to maintain biomass activity. For mesophilic operation the feed rate is tightly constrained; any sudden increase results in a detrimental drop in pH.
MBR instability (feed - no feed - feed)
The transitions described in the previous sections, and illustrated in Figs 7 to 9, provide a pattern for understanding various process disturbances. If feed to the MBR is cut for a significant amount of time, the lack of substrate leads to a depletion of biomass. When the feed is subsequently increased, there is insufficient biomass to assimilate the additional acetic acid load: the pH drops, inhibiting the biological reaction and causing failure of the process if there is no intervention.
When operating in the mesophilic regime (around 40°C) the maximum time for a feed interruption without causing instability was found by trial to be 98 h (4.1 days).
If, after such an incident, the feed flow is increased under pH control (as illustrated in Fig. 10), the temperature gradually climbs back to 40°C, taking over 300 h (12.5 days) to fully recover.
When operating in the thermophilic regime (around 50°C), the situation is similar, except that the maximum duration of a feed interruption is only 30 h before instability will ensue. During the recovery, the temperature drops to below 42°C in the first ٤٤ h, then starts to increase again. The total recovery time back to a thermophilic temperature of 50°C is again approximately 300 h (12.5 days).
In order to obtain a clear answer as to which temperature regime to design for, a full technical and economic analysis in the context of the entire process design is required, which takes into account the nature and frequency of process upsets. Under steady operating conditions, thermophilic operation can handle more than double the effluent load for a given reactor size. If a method were found to reduce instability under thermophilic operation, this would be the preferred solution. The primary cause of the observed instability is frequent feed fluctuations, and the time taken to recover normal operation.
One of the possible solutions to reduce feed fluctuations to the MBR may be a buffer tank. This would increase the capital costs involved with thermophilic operation, but would likely be less than the capital costs involved with constructing the larger MBR required for mesophilic operation.
CONCLUSIONS
The dynamic mass and energy balance model is successful in predicting steady-state and unsteady-state operation of the MBR under both mesophilic and thermophilic conditions. The temperature can be predicted within 2°C, and the pH within 0.5 units over a period greater than 60 days, using only the daily furfural feeding and sludge wasting rates as model inputs. A single biomass population can be used to model the MBR by including temperature dependencies in the kinetic and stoichiometric parameters.
There are advantages and disadvantages associated with both mesophilic and thermophilic operation of the MBR. A detailed economic analysis would be required to determine which regime is optimal. Both the model simulations and plant data suggest that thermophilic operation could be advantageous, but it is less stable than mesophilic operation, and frequent feed disruptions will have serious adverse effects.
ACKNOWLEDGEMENTS
The authors express their thanks to Illovo Sugar for sponsoring this study, especially Charles Krüger of Illovo Sugar who initiated it, and the technical staff for their practical support.
REFERENCES
ABEYNAYAKA A (2009) Thermophilic aerobic membrane bioreactor for industrial wastewater treatment. Master of Engineering, Asian Institute of Technology. [ Links ]
BATSTONE DJ, AMERLINCK Y, EKAMA GA, GOEL R, GRAU P, JOHNSON B, KAYA I, STEYER JP, TAIT S, TAKACS I, VANROLLEGHEM PA, BROUCKAERT CJ and VOLKE E (2012) Towards a generalized physicochemical framework. Water Sci. Technol. 66 (6) 1147-1161. https://doi.org/10.2166/wst.2012.300 [ Links ]
BRIDGEWATER L, RICE EW, BAIRD RB, EATON AD and CLESCERI LS (eds) (2012) Standard Methods for the Examination of Water and Wastewater. APHA-AWWA-WEF, Washington D.C. [ Links ]
BROUCKAERT CJ, IKUMI D and EKAMA GA (2010) Modelling of anaerobic digestion for incorporation into a plant-wide wastewater treatment model. WISA Biennial Conference, 18-22 April 2010, Durban, South Africa. [ Links ]
CASEY TJ (2006) Unit Treatment Processes in Water and Wastewater Engineering. Aquavarra Research Limited, Blackrock, Dublin. [ Links ]
GENT RD (2012) Experimental effluent treatment at Sezela. Proceedings of the South African Sugar Technologists' Association 85 267-277. [ Links ]
GILLOT S and VANROLLEGHEM PA (2003) Equilibrium temperature in aerated basins-comparison of two prediction models. Water Res. 37 3742-3748. https://doi.org/10.1016/S0043−1354(03)00263-X [ Links ]
HENZE M, GRADY CPL (Jnr), GUJER W, MARAIS GVR and MATSUO T (1987) Activated sludge model No 1. IWA Scientific and Technical Report No 1. International Water Association, London. ISSN 1010-707X. [ Links ]
JUDD S (2001) The MBR Book: Principles and Applications of Membrane Bioreactors for Water and Wastewater Treatment. Elsevier Ltd, Oxford, UK. [ Links ]
KENNEDY S and YOUNG T (2006) Membrane bioreactors for water re-use in Southern Africa. URL: http://www.kubotafreeair.com/files/S_%20Kennedy%20&%20T_%20Young%20(2007)_%20Membrane%20Bioreactors%20for%20Water%20ReUse%20in%20Southern%20Africa.pdf (Accessed 22 March 2013). [ Links ]
LAPARA TM and ALLEMAN JE (1999) Thermophilic aerobic biological wastewater treatment. Water Res. 33 895-908. https://doi.org/10.1016/S0043−1354(98)00282-6 [ Links ]
LIZARRALDE I, FERNANDEZ-AREVALO T, BROUCKAERT CJ, VANROLLEGHEM PA, IKUMI DS, EKAMA GA, AYESA E and GRAU P (2015) A new general methodology for incorporating physico-chemical transformations into multiphase wastewater treatment process models. Water Res. 74 239-256. https://doi.org/10.1016/j.watres.2015.01.031 [ Links ]
MAKINIA J, WELLS SA and JIMA P (2005) Temperature modeling in activated sludge systems: A case study. Water Environ. Res. 77 8. https://doi.org/10.2175/106143005X67449 [ Links ]
MILENKO R and VRTOVSEK J (2004) The study of nutrient balance in sequencing batch reactor wastewater treatment. Acta Chim. Slovenika 51 779-785. [ Links ]
NOVOTNY V and KRENKEL PA (1973) Simplified mathematical model of temperature changes in rivers. Water Pollut. Control Fed. 45 240-248. [ Links ]
RAPHAEL JM (1962) Prediction of temperature in rivers and reservoirs. J. Power Div. 88 157-188. [ Links ]
SEDORY PE and STENSTROM MK (1995) Dynamic prediction of wastewater aeration basin temperature. J. Environ. Eng. 121 609-618. https://doi.org/10.1061/(ASCE)0733-9372(1995)121:9(609) [ Links ]
SOLON K, FLORES-ALSINA X, KAZADI MBAMBA C,VOLKE EIP, TAIT S, BATSTONE DJ, GERNAEY KV and JEPPSSON U (2015) Effects of ionic strength and ion pairing on (plant-wide) modelling of anaerobic digestion. Water Res. 70 235-245. https://doi.org/10.1016/j.watres.2014.11.035 [ Links ]
SURCIS SL (2019) Multifunctional respirometry systems. URL: http://www.surcis.com/en/products_362 [Accessed 8 January 2019] [ Links ]
TALATI SN (1988) Heat Loss in Aeration Tanks. MSc Civil Engineering, University of California. [ Links ]
TALATI SN and STENSTROM MK (1990) Aeration-basin heat loss. J. Environ. Eng. 116 70-86. https://doi.org/10.1061/(ASCE)0733-9372(1990)116:1(70) [ Links ]
TCHOBANAGLOUS G, BURTON FL and STENSEL HD (2003) Wastewater Engineering: Treatment and Reuse. McGraw Hill Education, New York. [ Links ]
UBISI MF, JOOD TW, WENTZEL MC and EKAMA GA (1997) Activated sludge mixed liquor heterotrophic active biomass. Water SA 23 239-248. [ Links ]
VOGELAAR JC, KLAPWIJK B, TEMINK H and VAN LIER JB (2003) Kinetic comparisons of mesophilic and thermophilic aerobic biomass. J. Ind. Microbiol. Biotechnol. 30 81-88. https://doi.org/10.1007/s10295-002-0015-z [ Links ]
Received 1 September 2017
Accepted in revised form 3 July 2019
* Corresponding author, email: brouckae@ukzn.ac.za


