


Services on Demand
Article
 English (pdf)
 Article in xml format
 Article references
Indicators

Related links
-
 Cited by Google
 -
 Similars in Google
Share

 Permalink
Water SA
On-line version ISSN 1816-7950
Print version ISSN 0378-4738
Water SA vol.45 n.2 Pretoria Apr. 2019
http://dx.doi.org/10.4314/wsa.v45i2.03
Assessment of apparent losses due to meter inaccuracy – a comparative approach
Mthokozisi NcubeI, II, *; Akpofure TaigbenuI
ISchool of Civil and Environmental Engineering, University of the Witwatersrand, Johannesburg, Private Bag 3, WITS, 2050, South Africa
IIDevelopment Bank of Southern Africa, PO Box 1234, Halfway House, Midrand, 1685, South Africa
ABSTRACT
The empirical method for the determination of apparent water losses, using the assessment of consumption patterns and the laboratory testing of water meters, is compared against alternative methods of comparative billing and meter change analyses for one of the largest water utilities in South Africa. Using the empirical method, apparent losses are estimated to have an average value of 12% of the billed volume with a range from 9.4% to 14.6% that is dependent on meter size ratios. This overlaps with the estimates, of 8%−10% for a utility with direct feed good quality water but high meter age (> 10 yr) and low accuracy, currently proposed in some studies and used by industry. The estimate from the comparative billing analysis method is 14% and it is sensitive to how the data is processed and analysed. The meter change method yielded an estimate of 4.7% for only a subset of the data. Both results of the alternative methods are in line with previous studies, with the comparative billing analysis performing better, but requiring further refinement for better accuracy and repeatability. The empirical method remains the gold standard in assessing apparent water losses but is undoubtedly very laborious, expensive and out of reach of the budget of many utilities. The development and validation of alternative methodologies therefore holds great promise but these are substantially reliant on comprehensive meter information and credible billing datasets which are rarely available in most utilities in Africa.
Keywords: apparent water losses, water metering, metering errors, water loss management, non-revenue water (NRW)
INTRODUCTION
The World Economic Forum considers water crisis, defined as a significant decline in the available quality and quantity of fresh water resulting in negative impacts on human health and/or socio-economic activities, as one of the top 10 global risks (WEF, 2017). This is against a background of increasing global freshwater withdrawals that have grown by about 1%/yr since the 1980s, mainly due to growing demand in developing countries (WWAP, 2016). To mitigate against water risks, water-use efficiency improvements are critical, particularly in addressing the projected 40% gap between demand and supply by 2030 (UNEP, 2011). The management and reduction of non-revenue water (NRW) is one key component of improving water use efficiency and the reduction of the current and future gaps in water supply and demand. Opportunities for reducing NRW are vast; current estimates indicate an average of 41% NRW in South Africa (DWS, 2017), while Kingdom et al. (2006) estimates that globally water losses cost utilities a minimum of 141 billion USD/yr.
One component of NRW is apparent water losses, which are more significant in monetary terms as they are calculated at the retail water price while other components are calculated using variable production costs (AWWA, 2009). Apparent water losses encompass metering errors, unauthorised consumption, data acquisition errors and errors in the estimation of unmetered consumption (Vermersch et al., 2016). Metering errors have been found to be the largest contributor to apparent losses (Rizzo and Cilia, 2005) and have therefore been the subject of the most research on apparent losses. Methods of assessment of apparent losses are presented in several studies that use different methodologies of apparent water loss estimation. For example, Couvelis and Van Zyl (2015) used a meter replacement database; Mbabazi et al. (2015) used a comparative analysis of a billing database; Mutikanga et. al. (2011), AWWA (2009), Criminisi et al. (2009), Thornton et al. (2008) and Arregui et al. (2006) all used the traditional empirical field and laboratory-based method; Al-Washali (2011) proposed a mass water and wastewater balance, while Seago et al. (2004) and McKenzie (2012) used a fixed percentage of water losses as an estimate for apparent water losses. To date, there are no known comparative studies that have used the different methodologies within a study area to evaluate their respective performance. This paper seeks to fill this gap by estimating apparent water losses due to metering errors within the area serviced by Johannesburg Water (JW), one of the largest water utilities in South Africa. The empirical field-based method used in Arregui et al. (2006) is compared against alternative methods that rely on existing data as proposed in Arregui et al. (2003). These are the comparative analysis of a billing database as described in Mbabazi et al. (2015) and the meter replacement database analysis as described in Couvelis and Van Zyl (2015).
The empirical method is a tried and tested method of estimating apparent water losses within utilities. It involves the sampling of water meters and consumers to determine the weighted metering accuracy and has been used by researchers such as Noss et al (1987), Yee (1999), Arregui et al. (2006), Mutikanga (2012), and Arregui et al. (2013). The main drawback of this method is that it is labour-intensive and expensive to implement although its results are regarded as the best estimate of apparent water losses. The methodology and process of estimating these losses are illustrated in Fig. 1.

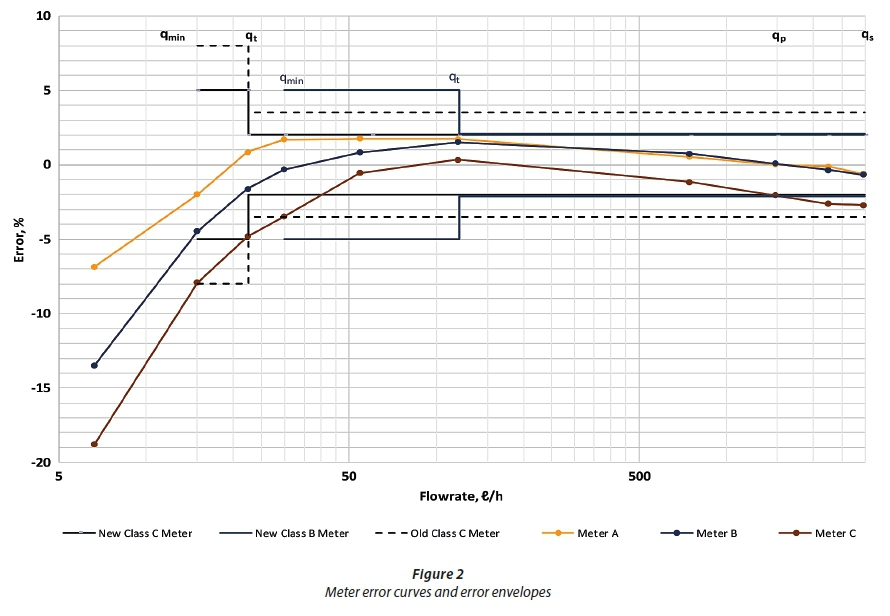
Figure 2 illustrates the error curves of 3 meters (tested as part of this study) and the error envelopes for Class B and Class C meters as required by the South African SANS 1529-1:2006 standard. This standard, as is the case with most standards, only specifies the minimum flow rate (qmin), transitional flowrate (qt), and the overload flowrate (qs) which are all a function of the permanent flow rate (qp) for the evaluation of the accuracy of a meter. Typically, meters of the same size (e.g. 15 mm), irrespective of meter class, have the same qp and qs, but different qmin and qt, as shown in Fig. 2. Accuracy requirements also differ for new meters and meters in use (old meters) as illustrated in Fig. 2 for the Class C meters, with the requirement applicable to all meter classes. For all flowrates leading up to qt, the required accuracy tolerance is 5% for new meters and 8% for used meters, while for flows higher than qt the tolerance is lower at 2% and 3.5% for new and used meters, respectively. In the example, Meter C does not meet the requirements for a used Class C or a new Class B meter as a portion of its curve falls outside the error envelopes. It would therefore only comply with the requirements of a used Class B meter.
The objective of determining the weighted meter error is to obtain the variation of the accuracy of a meter at more points than the mandatory qmin, qt, qp, and qs, in order to better represent its error curve, as is the case with the meters in Fig. 2. The curves obtained by only considering the 4 points would be very different to the curves of Meters A to C and would not be representative of reality. Unfortunately, several studies such as Allender (1996), Yee (1999) and Mutikanga et al. (2011a) had reconstructed error curves from only 3 flow rates of the minimum, intermediate and maximum flows. Related to this objective, is the determination of the proportion of flow to total flow that occurs within the various ranges of flowrates, typically coinciding with the selected flowrates when tests of meters are carried out for homogeneous consumer groupings. Achieving these outcomes involves extensive field and laboratory work. The weighted meter accuracy for each homogeneous consumer grouping is given by Yee (1999):

Where PTC is the percentage of consumption and GAALq is meter group average accuracy test results at the selected meter test flowrates q = 1 to n. It is assumed that the meter curve follows a linear path between successive test results. GAAL is taken as the accuracy of the meter at the upper range of the flowrate which does not take cognisance of the fact that the flow does not occur at a single point but over a range. This is clearly observed in Fig. 2, particularly at low flowrates, where there is a large variation in the accuracy between successive flowrates. The accuracy at the midpoint of the range is seen as a better representation of the accuracy of the range.
METHODOLOGY
The traditional empirical method
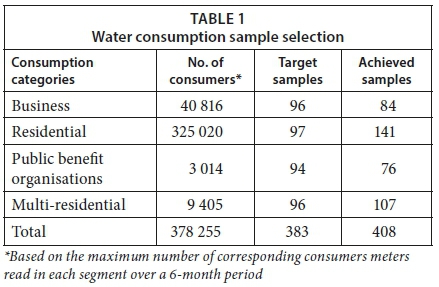
Consumption characterisation of consumers of the City of Johannesburg, including the sampling details and the process followed, is described in detail in Ncube and Taigbenu (2016). Table 1 summarises the targeted quantities of samples of logged meters to achieve a 95% confidence level with an error margin of ± 10% per consumption category and an error margin of ± 5% city-wide. Samples were extracted from all active meters of the meter database and thereafter meter logging was carried out on representative consumers and properties.
For the small connections (15 mm-25 mm), R800 electromagnetic meters with a start flow rate of 1 L/h and a qmin of 3.1 L/h were acquired, installed in series with the existing meters and utilised to obtain consumption data at 1 min intervals and a minimum resolution of 1 L. In the case of large connections (≥ 40 mm), an appropriate meter logger was installed on the existing meter for meter logging purposes. The logging results were then collated and analysed to determine the proportion of flow recorded at different flowrates. The proportion of consumption at various flowrates are reproduced in Table 2 for small connections and calculated to align with the flowrates used for meter testing (Table 3).
For meter testing purposes, the Johannesburg Water (JW) metering database had about 317 000 active meters for which information was available on the current meter reading and indicative meter sizes. The meter sizes in the database were considered indicative because they often did not reflect the reality in the field and were therefore unreliable. A random stratified sample of 400 meters, with an additional 35 meters to allow for unfavourable field conditions, was selected and targeted for removal from the field to be subsequently tested at the JW's flow laboratory, which is accredited under the South African National Accreditation System (SANAS). The sample was made up of 110 large meters (40 mm diameter) and 325 small meters (15, 20 and 25mm diameters). The sampled meters were chosen in proportion to the number of meters in the database with readings that are in 2 000 m3 interval ranges so as to achieve a global minimum of 95% confidence level. The flowrates for the meter tests were selected to cover a wide range of flows to reproduce the meter error curve as accurately as possible. This follows the recommendations of Arregui et al. (2013) with slight modifications to suit common meters in South Africa. Table 3 summarises the selected flowrates used in this study.
For each of the flowrates in Table 3, the meter test was repeated 3 times to evaluate for consistency using statistical variables. Only tests that were consistent were used to calculate the average accuracy. The average accuracy for each of the flowrates was thereafter used to estimate the meter accuracy curves for each meter, assuming a straight line between data points. The mid-point accuracy between data points was assumed to represent the accuracy of the meter for all flows occurring within successive accuracy data points. The proportion of consumption at a particular flowrate (Table 2), and the estimated average accuracy of each meter size at the respective flowrates (Table 4) were then combined to estimate the weighted meter accuracy using the formula:

Where GAAL0 would be the meter accuracy at a flowrate of zero value. Since meter accuracy data are not available for meters per category of consumers, the meter accuracy data were applied to each of the 4 different consumption categories of business, residential, public benefit properties (utility) and multi-residential dwellings. The estimates of apparent losses were calculated using the same meter error data but with the corresponding consumption profiles. Owing to budgetary and time constraints, only the small meters were eventually tested. As such, all subsequent discussions do not include bulk meters which are 40 mm and above.
The comparative billing analysis method
Mbabazi et al. (2015) estimated meter accuracy degradation rates by evaluating the evolution of the average yearly metered volume versus the age of volumetric and velocity meters in Uganda. The obtained rates were used to estimate the losses based on the consumption patterns of the utility. The analysis evaluated three 15 mm meter models with meters grouped according to model types and ranges of the total accumulated volume on each meter. A total of 503 meters were eventually used from a dataset of 128 201 meters, with 8 months of consumption data. The average metered volume for each grouping of the accumulated volume for the meters was calculated. Using the age of the meter, evolution curves of the average yearly metered volume (annual billed volume) versus age for each model were thereafter derived. The relationships for the average yearly metered volume and meter age, and the degradation rate are given as (Mbabazi et al., 2015):

Where y is the annual billed volume and x is the age of the meter and the degradation rate d is calculated as:

In this study, a database of over 600 000 meter reading records (from both the currently active meters and those no longer in use) was compiled using JW's monthly billing records from July 2003 to June 2015. Properties with only one meter and whose meter readings had not clocked over (i.e. not started again from the beginning) and that did not have abnormally high readings were selected for the analysis to minimise the impact of outliers and data cleansing requirements. The final number of records used was slightly above 106 000.
The gaps in the data were patched using the Zeileis and Grothendieck (2005) 'zoo package' within the R statistical software. The distributions of the data are shown in Fig. 3.
Two 12-month periods (in 2008 and 2012) with the greatest amount of overlapping meter reading data were selected and the average annual consumption for each of the meters was calculated. For each of the two periods, supplementary information such as the last reading and the age of the meter were collated and consolidated into one dataset with the average annual consumption. Because no reliable information on meter types, models and sizes was available, these specific variables were not considered further in the analysis.
The subsequent analysis followed the methodology described in Mbabazi et al. (2015), to which the reader is referred for more detail. The meter records were classified into meter reading ranges of 0-2 000 m3, 2 000-4 000 m3, and so forth, based on the last meter reading within the periods of interest. Only meters with a reading of up to 10 000 m3 and an age of up to 15 yr were considered in the analysis to eliminate outliers. For each of the meter reading range categories, the average annual consumption per age category was calculated to determine the variation of average annual consumption with age. The analysis was done in both the R Statistical Software and MS Excel to obtain regression curves for each of the ranges, including key statistics that could be used to estimate potential apparent water losses.
The meter change data analysis method
Couvelis and Van Zyl (2015) used a meter change database to calculate the consumption before and after a meter change, with the difference considered as an indication of the inaccuracy of the old meter. The reader is also referred to that paper for a detailed overview of the method. Ncube and Taigbenu (2015) followed the method to analyse for specific meters changed between 2010 and 2013 within JW. This paper extends this latter work by incorporating additional data obtained from the dataset developed for the comparative billing analysis and covers the period from 2003 to 2015. The main difference is that, in this case, the meter change is identified based on a change of meter number per property as opposed to previously labelled datasets. In both cases, the metering error was calculated as:

Where Q2 and Q1 are the average consumption for 12 months of meter readings prior to and after the meter replacement, respectively.
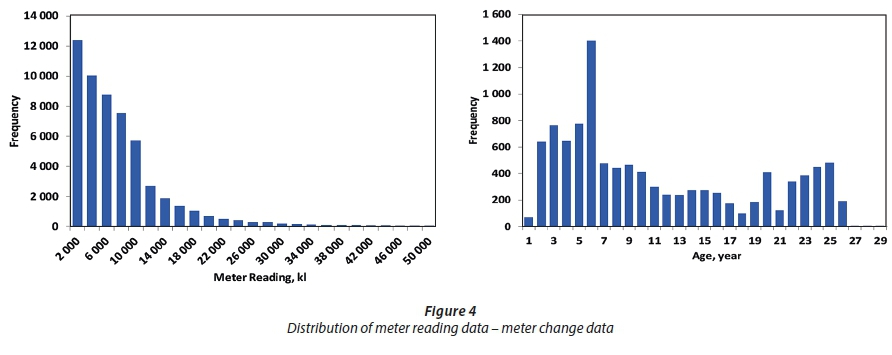
From the over 600 000 meter reading records, properties that had exactly one meter changed with at least a 1-yr record, without any clock-overs or abnormal readings, were extracted from the database. These limitations were imposed to minimise the cleansing required on the extracted data. The data were also patched using the Zeileis and Grothendieck (2005) package to give a total of 111 448 records (55 744 properties), which is almost 3 times the amount of data that was used in Ncube and Taigbenu (2015). The distributions of the data are shown in Fig. 4.
The meter error for each of the 55 744 properties was calculated using Eq. 5 and a trend analysis done for the error against the age and the meter reading of the old meter that had been replaced.
RESULTS AND DISCUSSION
The traditional empirical method
A total of 123 meters consisting of 6 different models, with 4 main types, across 3 sizes, were successfully tested. The balance of the unsuccessful tests included plastic bodied meters that developed leaks at higher flows, damaged meters, illegible meters and others that were found to have been recently changed but whose details had not been updated accordingly in the database. This highlights the fact that even the traditional approach is not without its limitations and hence the need for viable alternatives. The test results for all meters are summarised in Table 4 for all the test flowrates. For each of the test flowrates in Table 4, it is clear that there are differences between meter models, and that the meter age and reading have a bearing on its accuracy. This emphasizes the importance of paying adequate attention to meter groupings and documenting them in the database to the same level of detail as the information on the meter age and meter reading.
The weighted meter accuracy results per meter model, meter size and the respective consumer categories are presented in Table 5, excluding the 25 mm meters category, for which there were only 3 meters.
The variation of the weighted meter accuracy is subdued compared to that of the actual meter accuracy because of the dampening effect of the consumption proportions. While there are accuracy differences between meter models, these cannot be comparatively analysed conclusively due to differences in meter ages and readings, and sample sizes of the models. However, there are significant differences in the weighted accuracy for 15 mm and 20 mm meters for all consumer groupings. Utilities incur higher revenue losses when they deploy larger-sized meters than required; hence the need for better meter sizing. In view of inadequate meter model information for the City of Johannesburg, the average accuracies of both the 15 mm and 20 mm meters were used to estimate the range of apparent losses, as summarised in Table 6.

Apparent water losses due to metering errors in Johannesburg for consumers with small connections are estimated to be between 9.4% and 14.6% of the billed water volume, amounting to 2 032 192 and 3 145 573 kL/month, respectively. At the current 2018/19 water tariff rate for the first 6 kL of 8.28 ZAR/kL, this amounts to between 16.8 million ZAR/month to 26 million ZAR/month. Assuming an equal split in the number of the 15 mm and 20 mm meters, the meter under-registration can be estimated at 12% of the billed water, amounting to a monthly loss of 2 594 287 kL (21.5 million ZAR). This is higher than the default value of 10% for cities with direct supply, as suggested in Mutikanga et al. (2011), or the 8% estimated for utilities with good quality water, but poor meter age and accuracy, as in Seago et al. (2004). The latter value is actively promoted by the South African Department of Water and Sanitation as the default value of apparent water loss due to metering errors.
As expected, domestic consumers, being the most numerous and with the highest proportion of low flows through the meter, contribute the most to apparent water losses and therefore proper sizing and management of their meters has the greatest impact on these consumers and water loss in general. The results also demonstrate the need to keep and maintain comprehensive databases of meter, consumer, and consumption information, as in the absence of such information the use of global average results (as in Table 5) tends to mask salient results that can inform decision-making and deployment of resources by the water utility. Furthermore, the challenges experienced in failing to test all the meters that were scheduled underscore the fact that not only is the traditional method costly, but also intricate, and may not always yield the required outcomes. However, it is still valuable to employ the traditional empirical method to estimate apparent water losses rather than rely on the currently accepted default values that yield lower estimates.
The comparative billing analysis method
The variations of the average annual consumption with meter age for the various categories of meter reading are simplified to linear relationships and presented in Fig. 5. The actual relationship between the two variables follows an inverse power relationship starting with a rapid decline in annual volumes within the first 5 years and thereafter declining slowly with time.
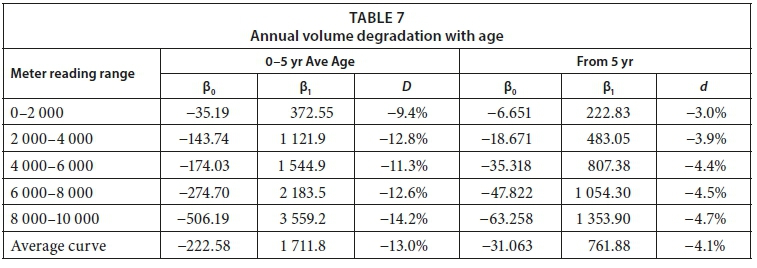
The extraction of the parameters of the linear relationships, presented in Eqs 3 and 4, is done separately for each segment of the graph, with Year 5 separating the segments of each curve. The results from the linear regression are summarised in Table 7 with all ranges having values of the coefficient of determination, R2, greater than 96%.
Higher degradation rates of 9-14% per annum are evident in the first 5 years, thereafter reducing to 3-5% per annum. The degradation rates in the first few years are excessive and can amount to an unusual and unrealistic total reduction of 39%-54% of the annual volume of water that is billed in the first 5 years. The degradation rates beyond Year 5 are the only ones within the range found by Mbabazi et al. (2015), of 1.45% to 6.67%, for different metering technologies. However, applying the average degradation rate of 4.1%, as in Table 5, to the average meter age of 11.5 yr, and assuming the same rate from Year 1 with an initial accuracy of 100%, gives a meter accuracy of only 61.8%. Such an accuracy value is very low and does not compare with even the worst-case scenario, 85.5%, of the empirical method. Both segments of the curve therefore do not yield realistic errors and they demonstrate the deficiency of the method as applied.
However, disregarding the different meter reading categories and evaluating the combined uncategorised dataset for the degradation rate of the annual consumption volumes, unlike the methodology of Mbabazi et al. (2015), gives the results shown in Fig. 6.
The degradation rate is reasonable at 1.25%, with a lower coefficient of determination (R2) of 75%. When this rate is applied to a meter fleet with an average age of 11.5 yr, it gives an accuracy level of 86%. This is comparable to the worst-case scenario of 85.5% obtained from the empirical method with only 20 mm meters, which is obviously not the case in the study area. Considering that this method does not take into consideration the initial meter error in its estimation, and has an inaccuracy higher than the average of 12% of the empirical method, it clearly overstates the actual meter under-registration. As a result, its use could therefore lead to erroneous results.
It is therefore clear from the comparative billing analysis that its results are largely dependent on how the analysis is implemented and could lead to different results for different researchers. In its current form, the method is thus unstable and its results are not reproducible because of the possible variations of incorporating the data in the analysis. The method also fails to maximally utilise the available dataset, as it considers a narrow timeframe of the consumption history, which limits it to the variety of results dependent on the window of the time series used. However, with the indicative meter error estimates obtained herein, the method holds some promise for further development that would ensure reproducibility of results and reliable accuracy for any dataset. This is the subject of related research by the authors.
The meter change data analysis method
About 50% of the records had an expected consumption increase after the meter change, while the other half recorded a consumption decrease. This was rather surprising and could be indicative of the inadequacy of the meter replacement practices of JW, as mechanical meters generally deteriorate with age and tend to under-register. An example of an anomalous practice is when an old meter is replaced by one of a larger size, as was observed by the authors to be common practice. The use of only a year of consumption records on either side of the replacement in the analysis is also a drawback of the method as it tends to mask annual variations and other possible variations in those 2 years. It is also possible that some consumers may have increasing consumption with time for varying reasons, such as on-site leakage, which is prevalent in the study area as demonstrated in Ncube and Taigbenu (2016).
Despite the increased number of meter change records used in the analysis compared with those used in Ncube and Taigbenu (2015), several variations of the analysis with the complete dataset did not uncover any credible relationships between meter error and both meter age and meter reading. Coupled with the absence of accurate information on meter particulars such as meter model and meter age, it was not possible to further disaggregate the analysis. The results of Ncube and Taigbenu (2015) that used labelled data (i.e. data from the maintenance programme that conclusively indicated the occurrence of meter replacements), showed that the degradation rate was 0.64% per 1 000 kL flow through the meter. For an average reading of 7 329 from the database of the last meter readings, the estimated error is 4.7%, which is similar to the estimated 5% error in Couvelis and Van Zyl (2015). However, both these figures are about 50% lower than the best scenario estimate of 9.4% from the empirical method, and much lower than its average error of 12%. Over and above the limitation of only using a year's consumption data on either side of the meter replacement, without factual meter details, such as meter size and meter make, it is very possible that the variation of consumption before and after meter replacement can be attributed to a range of factors and therefore cannot simply be reduced to apparent losses, or the lack thereof. It seems the ability of the method to deal with unlabelled data is also inadequate and may benefit from improved classification methodologies of identified actual meter replacements.
Similar to the comparative billing method, the meter change method, as applied in this study, does not provide a reasonable estimate of the apparent losses and its use could therefore lead to erroneous results which, in this case, underestimate the apparent water losses.
CONCLUSIONS
This study has evaluated 3 different methodologies of estimating apparent water losses using metering data from one of South Africa's largest water utilities. This is the first known attempt to compare the traditional empirical method to alternative methods for the same study area. The results indicate that the empirical method, while remaining the best method for estimating apparent losses, is not without difficulties - it is costly in terms of time, resources and labour. The laboratory testing of plastic meters obtained from the field might also be problematic, particularly if there are delays in carrying out the tests after their removal from site, due to material fatigue, as was experienced in this study.
Using the empirical method, apparent water losses due to metering error within Johannesburg Water are estimated to be, on average, about 12% of the billed consumption, and this is higher than the currently used default value of between 8 and 10%. The comparative billing analysis method, although largely dependent on how the data is packaged and analysed, found the losses to be 14%, which is similar to the worst-case scenario of the empirical method of 14.6%, and other studies. However, the result does not include initial meter under-registration and therefore the method overestimates the losses. The proximity of the comparative billing method result to that of the empirical method makes it an ideal candidate for further development as a suitable and viable alternative method. On the other hand, the meter change analysis understated by about 50% the best-case scenario losses of 9.4%, but was in line with previous studies using similar methodology. However, it is clear that it understates the meter error by a huge margin. Both alternative methods do not fully utilise the meter consumption history but focus only on a narrow window of its history to determine the metering error, thereby making them susceptible to a variety of results.
Despite their shortcomings, alternative methods of assessing apparent water losses, such as those explored in this study, remain viable potential alternatives that require enhancement for accuracy and credibility. With further development to achieve reproducible results, such methods will be considerably cheaper, while giving results that are comparable to those of the empirical method. However, both alternative methods considered in this study rely considerably on the maintenance of credible meter information and billing data - without such credible data, the results will at best be a guesstimate.
ACKNOWLEDGEMENTS
The contribution of Johannesburg Water in terms of opportunity, resources and time, has been invaluable and this study would not have been possible otherwise.
REFERENCES
AL-WASHALI T (2011) Non-revenue water management in Sana'a water distribution system. Masters Dissertation, Cologne University for Applied Sciences. [ Links ]
ARREGUI FJ, SORIANO J, GARCÍA-SERRA J and COBACHO R (2013) Proposal of a systematic methodology to estimate apparent losses due to water meter inaccuracies. Water Sci. Technol. Water Suppl. 13 (5) 1324-1330. https://doi.org/10.2166/ws.2013.138 [ Links ]
ARREGUI F, CABRERA E, COBACHO R and PALUA V (2003) Management strategies for optimum meter selection and replacement. Water Sci. Technol. Water Suppl. 3 (12) 143-152. https://doi.org/10.2166/ws.2003.0097 [ Links ]
ARREGUI FJ, CABRERA E, COBACHO R and GARCIA-SERRA J (2006a) Reducing apparent losses caused by meters inaccuracies. Water Pract. Technol. 1 (4) 1-4. https://doi.org/10.2166/wpt.2006.093 [ Links ]
ARREGUI FJ, CABRERA E and COBACHO R (2006b) Integrated Water Meter Management. International Water Association (IWA) Publishing, London, UK. [ Links ]
AWWA (American Water Works Association) (2009) Water Audits and Loss Control Programs. (3rd edn). M36 Publication Rewrite, Denver, CO. AWWA Publication, USA. [ Links ]
COUVELIS FA and VAN ZYL JE (2015) Apparent losses due to domestic water meter under-registration in South Africa. Water SA 41 (5) 698-704. https://doi.org/10.4314/wsa.v41i5.13 [ Links ]
CRIMINISI A, FONTANAZZA CM, FRENI G and LA LOGGIA G (2009) Evaluation of the apparent losses caused by water meter under-registration in intermittent water supply. Water Sci. Technol. 60 (9) 2373-2382. https://doi.org/10.2166/wst.2009.423 [ Links ]
DWS (Department of Water and Sanitation, South Africa) (2017) Benchmark of Water Losses, Water Use Efficiency and Non-Revenue Water in South African Municipalities (2004/05 − 2015/16). Department of Water and Sanitation, Pretoria. [ Links ]
KINGDOM B, LIEMBERGER R and MARIN P (2006) The challenge of reducing non-revenue (NRW) water in developing countries. How the private sector can help: a look at performance-based service. The World Bank, Washington DC. [ Links ]
MBABAZI D, BANADDA N, KIGGUNDU N, MUTIKANGA H and BABU M (2015) Determination of domestic water meter accuracy degradation rates in Uganda. J. Water Suppl. Res. Technol.-AQUA 64 (4) 486-492. https://doi.org/10.2166/aqua.2015.083 [ Links ]
MCKENZIE R, SIQALABA Z and WEGELIN W (2012) The state of non-revenue water in South Africa (2012). WRC Report No. TT 522/12. Water Research Commission, Pretoria. [ Links ]
MUTIKANGA H, SHARMA S and VAIRAVAMOORTHY K (2011) Assessment of apparent losses in urban water systems. Water Environ. J. 25 (3) 327-335. https://doi.org/10.1111/j.1747-6593.2010.00225.x [ Links ]
MUTIKANGA H (2012) Water loss management: tools and methods for developing countries. PhD Thesis. CRC Press/Balkema. [ Links ]
NCUBE M and TAIGBENU AE (2015) Meter accuracy degradation and failure probability based on meter tests and meter change data. Proceedings of the 4th YWP-ZA Biennial Conference and 1st African YWP Conference, November 2015. Pretoria, South Africa. [ Links ]
NOSS RR, NEWMAN GJ and MALE JW (1987) Optimal testing frequency for domestic water meters. J. Water Resour. Plann. Manage. 113 1-14. https://doi.org/10.1061/(ASCE)0733-9496(1987)113:1(1) [ Links ]
SEAGO C, BHAGWAN J and MCKENZIE R (2004) Benchmarking leakage from water reticulation systems in South Africa. Water SA 30 (5) 25-32. [ Links ]
THORNTON J, STURM R and KUNKEL G (2008) Water Loss Control Manual. McGraw-Hill, USA [ Links ]
UNEP (United Nations Environment Programme) (2011). Water: Investing in Natural Capital. UNEP, Towards a Green Economy: Pathways to Sustainable Development and Poverty Eradication. UNEP, Nairobi. [ Links ]
VERMERSCH M, CARTEADO F, RIZZO A, JOHNSON E, ARREGUI F and LAMBERT A (2016) Guidance notes on apparent losses and water loss reduction planning. Unpublished report. [ Links ]
WEF (World Economic Forum) (2017) The Global Risks Report 2017 (12th edn). World Economic Forum, Cologny/Geneva. [ Links ]
WWAP (United Nations World Water Assessment Programme) (2016) The United Nations World Water Development Report (2016): Water and Jobs. UNESCO, Paris. [ Links ]
YEE M (1999) Economic analysis for replacing residential meters. J. Am. Water Works Assoc. 91 72-77. https://doi.org/10.1002/j.1551-8833.1999.tb08666.x [ Links ]
ZEILEIS A and GROTHENDIECK G (2005) zoo: S3 infrastructure for regular and irregular time series. J. Stat. Softw. 14 (6) 1-27. https://doi.org/10.18637/jss.v014.i06 [ Links ]
Received 12 February 2018
Accepted in revised form 8 March 2019
* To whom all correspondence should be addressed. e-mail: mthokozisin@dbsa.org

