


Servicios Personalizados
Articulo
 Inglés (pdf)
 Articulo en XML
 Referencias del artículo
Indicadores

Links relacionados
-
 Citado por Google
 -
 Similares en Google
Compartir

 Permalink
Water SA
versión On-line ISSN 1816-7950
versión impresa ISSN 0378-4738
Water SA vol.45 no.2 Pretoria abr. 2019
http://dx.doi.org/10.4314/wsa.v45i2.02
Domestic water meter optimal replacement period to minimize water revenue loss
Aluta Moahloli; Annlizé Marnewick; JHC Pretorius
Faculty of Engineering and the Built Environment, University of Johannesburg, PO Box 524, Auckland Park, 2006, South Africa
ABSTRACT
Water meter under-registration results in apparent losses and lost revenue for municipalities. Municipalities should scientifically determine the optimal replacement periods for the meters in their particular municipality, as this would result in the formulation and implementation of appropriate meter replacement strategies and a reduction of apparent losses due to water meter inaccuracies. A water meter management database was analysed using the relative meter error method to determine if a relationship exists between domestic water meter age, total registered volume and accuracy, as well as the volume of apparent water losses caused by inaccuracies due to domestic water meter age and total registered volume. The net present value chain (NPVCn) method was used to determine the optimal domestic water meter replacement period. This study found no relation between water meter age and total registered volume. A relation was found between water meter age and accuracy and well as between total registered volume and accuracy. The median relative meter error was found to decrease with increasing water meter age and to increase from under-registration to over-registration as the total registered volume increased. The study also determined the volume of apparent water losses caused by domestic water meter inaccuracies due to age and total registered volume for this particular municipality to be 1.814 kL∙meter−1∙month−1, which translated to 2.81% of the municipality's total system input volume. The optimal water meter replacement period of the municipality was determined using the NPVCn method to be at water meter ages of 9, 12 and 16 years and total registered volumes of 3 971, 5 162 and 6 750 kL at discount rates of 10%, 8% and 6%, respectively. This means that the municipality can now proactively replace its water meters so as to minimize the impact of meter inaccuracies on non-revenue water.
Keywords: water meter age, apparent water losses, relative water meter errors
INTRODUCTION
South Africa is considered to be one of the 30 driest countries in the world and is as such defined as a semi-arid country (RSA, 2016). The second edition of the National Water Resource Strategy (DWA, 2013) states that the water demand of the domestic sector had increased from 22% to 27% of the total resource over the preceding 10 years with water demand likely to grow at about 1.2% over the next 10 years. The strategy further states that South Africa is fast approaching full utilization of available surface water yields, and is running out of suitable sites for new dams. The drought in Cape Town highlights how quickly the water resource can reach critical levels if there is sub-optimal rainfall for only a few years. The sustainability of the country's freshwater resources has therefore reached a critical point and its associated management is now at a crossroads (DWA, 2013).
McKenzie et al. (2012), in a study commissioned by the Water Research Commission (WRC), indicated that there had been a gradual increase in the South African non-revenue water (NRW) in the preceding 6 years and it stood at 36.8% in 2010, which was on par with the world average of 36.2%. They estimated the water loss component to be approximately 25%. As much as the figure might be on par with the international average, it is unacceptable for a semi-arid country with all natural water resources almost fully exploited. Water demand management and the reduction of NRW should therefore be a priority. Local government, the sphere in which the urban water usage takes place, offers the greatest opportunity for water demand management due to the expected growth in water demand.
One of the components of NRW is apparent losses, which includes water meter inaccuracies due to water meter non-registration and under-registration. If the point at which domestic water meters should be replaced is known, then meters can be replaced proactively in order to minimize the impact of water consumption non-registration and under-registration on non-revenue water. The aim of this study was, therefore, to determine the optimal point at which domestic water meters are to be replaced in order to minimize apparent water losses while ensuring efficient use of financial resources. If this is known, recommendations can be made to the municipality on how domestic water meters should be managed in terms of meter age and total registered volume.
Current research confirms that several factors can affect the accuracy of a water meter. The main ones are water meter age and total registered volume (Van Zyl, 2011; Decker, 2006; Criminisi et al., 2009; Couvelis and Van Zyl, 2015; Mukheibir et al., 2012; Fantozzi, 2009). Existing research has analysed these factors' contribution to meter accuracy in isolation. This research will determine if a relationship exists between domestic water meter age in years or total registered volume and accuracy, the volume of apparent water losses caused by inaccuracies due to domestic water meter age and total registered volume, as well as the optimal replacement period for domestic water meters in the municipality under review.
LITERATURE REVIEW
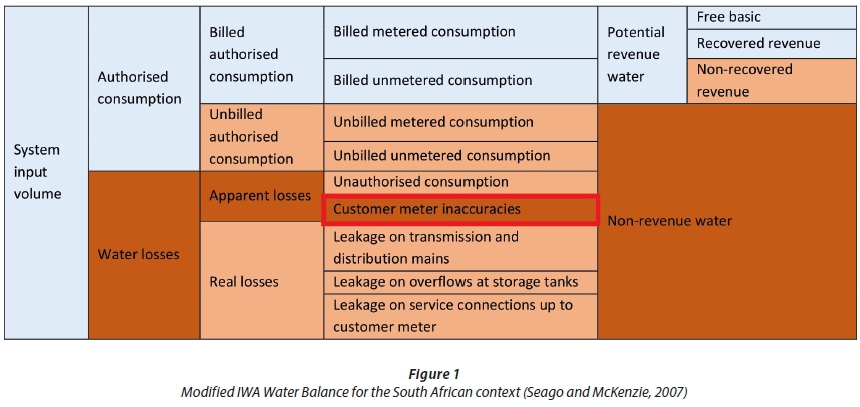
The International Water Association (IWA) developed a water balance methodology that has been adopted by many countries across the world (Farley et al., 2008). Seago and McKenzie (2007), however, modified it to the South African context by making provision for free basic water, which is unique to South Africa, and non-recovered revenue (Fig. 1). The water balance is designed so as to be able to account for all the water that enters the municipal water network, either from a bulk water supplier or from the municipality's own water treatment plant. Customer meter inaccuracies, as highlighted in Fig. 1, which are the subject of this study, have a direct impact on apparent losses, which have an impact on water losses and eventually on non-revenue water. Customer meter inaccuracies are primarily due to meter non-registration and under-registration, which is brought about by intrinsic errors in water meters, that become worse with increasing meter age and/or total registered volume (Fantozzi et al., 2009).
Water meter inaccuracies are, together with data handling errors, the main factors that affect the calculation of non-revenue water (NRW) (Farley et al., 2008). Apparent losses could form as much as 39% of water losses in some water systems (Decker, 2006). A study by Couvelis and Van Zyl (2015) concluded that apparent losses due to water meter under-registration in selected South African cities were around 5% of consumption for domestic consumers. In an Australian study, Mukheibir and Giurco (2011) found that the unregistered percentage of the volume that goes through a water meter, which is made up of both under-registration and non-registration, was in the range of −0.6% to −4.0%. They, however also state that the percentages will vary for each water utility or municipality, based on meter type, network and operating conditions and annual volumes passing through the meter.
Water meter inaccuracies due to non-registration and under-registration have been reported to increase with age and total volume through the meter (Decker, 2006; Criminisi et al., 2009; Couvelis and Van Zyl, 2015; Mukheibir et al., 2012), thereby increasing the apparent losses component of non-revenue water (Farley et al., 2008). In a country like South Africa where the available water resources are almost fully utilised, taking into consideration the environmental reserve, the reduction of non-revenue water should be a priority to ensure sustainability of water supply (DWA, 2013). It therefore follows that water meter inaccuracies in the form of meter non-registration or under-registration of volume that goes through the meter should be adequately managed due to the significant impact they have on apparent losses and NRW.
One of the key components of a meter management process is the analysis of the water meter and meter reading databases for the determination of the optimal age thresholds (either by years or volume) for the replacement of water meters. This will lead to the formulation of a pro-active water meter replacement programme. Fantozzi (2009) suggests the formulation of a replacement programme that considers the whole life cost of the meter instead of replacing the meters only when they are clogged, considerably old or have a high total registered volume. It is important that the optimal replacement period for a particular type of meter under the prevailing local conditions be determined because different operating conditions, pipe materials, the condition of the network and water quality affect water meters differently (Mukheibir et al., 2012). The premature replacement of water meters will result in a higher average life cycle cost due to the initial fixed costs. However, if a meter is replaced too late, a significant loss of revenue caused by meter non-registration and under-registration will also increase the average life-cycle cost (Fontanazza et al., 2012).
Mukheibir et al. (2012) reported that they had reviewed meter replacement policies that specify that meters should be replaced when they reach meter ages of 10 to 15 yr and total registered volumes of 3 500 to 7 000 kL. Several authors and municipalities have reported or determined different meter ages, meter lifespans and meter replacement policies that range from an age of 10 yr to over 20 yr and a total registered volume of 7 500 kL (Van Zyl, 2011; Mutikanga et al., 2011; Couvelis and Van Zyl, 2015; Fantozzi, 2009; City of Wheaton (Illinois), n.d.; Crescent Valley Water District, n.d.; City of London (Canada), 2016; Regional Municipality of Peel, 2016; Sydney Water, 2015; Mukheibir et al., 2012; Narrabri Shire Municipality, 2013). There seems to be no specific determination and/or agreement on a water meter lifespan or optimal replacement period. Water meter producers also only give a limited period warranty against manufacturing defects but do not specify the meter's lifetime.
From these previous studies, it can be derived that either the age or total registered volume as factors affect the meter's accuracy to determine its lifespan. This research will focus on determining whether a relationship exists between domestic water meter age, total registered volume and accuracy. These three factors are further used to determine the optimal domestic water meter replacement period. The studies by Couvelis and Van Zyl (2015; 2012) estimate the effect of meter age on meter accuracy, but reached no conclusion on the optimal point when water meters should be replaced.
The study by Arregui et al. (2011) used the net present value of the replacement chain (NPVC) as a method that could be used by a municipality to decide on which meter to install in their water system based on the meter's error curves as tested when new. This study used the relative meter errors determined according to Couvelis and Van Zyl (2012), in the place of the water meter error curves in Arregui's method, thereby using a combination of the two methods to determine the optimal water meter replacement period of meters already installed by the municipality. Since the relative meter error will be affected by local water quality and system conditions, this research presents a methodology that can be easily utilised by water utility practitioners to determine when to proactively replace water meters based on the conditions prevailing in their water networks.
RESEARCH METHODOLOGY
The literature review has revealed several methods that can be used to determine water meter accuracy. The most accurate form of testing is the laboratory test bench. This method requires the removal of meters from the ground to be tested in the laboratory. This method is of particular importance for the accurate determination of meter accuracy in cases such as a customer complaint about the accuracy about their particular meter. This method is however not representative of on-site conditions.
Another method would be the installation of a master meter in series to the meter on the ground. This measures the accuracy of the meter under review in relation to the master meter. This method might not be as accurate as the test bench method but is more representative of the on-site conditions of that particular meter.
The methods mentioned above do, however, tend to be expensive and time consuming and therefore only suited to small sample sizes. This would limit their representativeness for determining water meter error in a study to determine a meter replacement strategy for a municipality that has more than 300 000 water meters.
The literature has also revealed that one of the methods that can be used to determine the optimal meter replacement period, either by meter age or by total registered volume, is the net present value (NPV) analysis.
It is for the reasons mentioned above that this study combined the methods employed by Couvelis and Van Zyl (2012) and Arregui et al. (2011). Couvelisa and Van Zyl (2012) used the municipality's existing meter database to determine meter accuracy while the optimal meter replacement period was determined using the net present value of the replacement chain (NPVCn) method by Arregui et al. (2011).
Data
The water meter data that was obtained from the municipality consisted of a database extract in Microsoft Access format extracted with the data extraction periods selected so that data included water meters that were replaced during the 2014/15 financial year (July 2014 to June 2015), as well as 12 months' data before and after installation.
In order to be able to perform the required analysis it was necessary that the data set included the following minimum data:
•Water meter information, i.e., meter size
•Consumer information, i.e., user type
•Installation date of the replaced meter (to allow its age to be calculated)
•Installation date of the replacement meter
•At least 12 months of water consumption data before and after the installation date of the new meter
This resulted in a final dataset of 2 283 records for analysis. This dataset was deemed to be sufficient in line with the assumption by Couvelis and Van Zyl (2012) that, on average, the network pressures, pipe burst frequencies and consumption patterns fluctuate around a fixed average for samples over 1 000.
The municipality's chief engineer responsible for meter management provided the initial water meter acquisition cost of 480 ZAR, meter installation costs of 660 ZAR and administrative costs of 171 ZAR (Bacon, 2016). The average selling price of water for 2014/15 financial year (12.66 ZAR∙kL−1) was obtained from the municipality's finance database. The real discount rate of 10%, based on the depreciation rate for meters, was obtained from the municipality's asset register, which determined the useful life of a water meter as 10 yr and uses straight line depreciation. This data, together with the average annual water consumption and water meter error were used to determine the optimal age at which domestic water meters are to be replaced.
Relative meter error versus meter age and total registered volume
The water meter data were stratified according to water meter age in years and total registered volume. This was done to enable the determination of the effect of water meter age and total registered volume on relative meter error and determine trends over time.
The domestic (15 mm) water meters were stratified in 5-year increments for meter age and 2 000 kL increments for total registered volume. The relative water meter error was analysed for all the meters in the stratified groups for the whole municipality.
The database contained actual water meter readings and the water consumption had to be determined from the water meter readings. The 12-month average volume consumed before and after the meter was replaced was determined and used for determining the relative water meter error. The relative meter error was determined according to the formula below (Van Zyl, 2011):

Where: εi = relative meter error; Va = actual volume (consumption measured by the new meter (Couvelis and Van Zyl, 2012)); Vi = indicated volume (consumption measured by the old (replaced) meter (Couvelis and Van Zyl, 2012))
The fraction was then converted to a percentage, with a negative value representing an under-registration and a positive value an over-registration of the actual volume by the old meters.
The indicated and actual volume refer to the average 12 months' monthly water consumption registered by the old meter before it was replaced and the new meter after replacement, respectively. The following assumptions were made:
•The actual consumption 1 year before and after replacement is equal when viewed over a large number of meters replaced at random times, especially since there were no water restrictions or other factors that would affect large-scale water consumption patterns
•The new meters have negligible error compared to the replaced meters
Volume of apparent losses caused by water meter inaccuracies
The average monthly water consumption of the new water meters for the 12-month period after installation (actual water consumption) was stratified according to age in 5-yr increments and total registered volume in 2 000 kL increments. The stratified average volumes were used to determine the volume of apparent losses by taking into consideration the relative meter errors of the sample set relative to meter age and total registered volume according to the formula:

The cost of the apparent losses was determined by multiplying the volume of apparent losses by the average customer tariff, according to the formula by Farley, et al. (2008):

Where: Val = volume of apparent losses; Cal = cost of apparent losses; ∀i = average volume consumed by a user on the year i (Arregui et al., 2011); εi = relative meter error on the year i; Cw = selling price of water (tariff).
The average cost of apparent losses was then used to determine the total cost of apparent losses due to meter under-registration for the municipality by multiplying it with the number of domestic water meters in the municipal database.
Optimal domestic water meter replacement period
The optimal meter replacement period was determined using the net present value of the replacement chain (NPVCn) method by Arregui, et al. (2011) according to the formula:
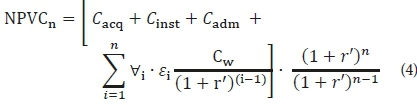
Where: n = number of years of the replacement period; Cacq = initial water meter acquisition costs; Cinst = initial water meter installation costs; Cadm = initial administrative costs; Cw = selling price of water; ∀i = average volume consumed by a user on the year i; εi = error of the meter for year i; r' = real discount rate; i = respective water meter ages (old meters).
The NPVCn was determined using the annual average water consumption of 397 kL∙yr−1 and the relative meter error of −5.48% at varying discount rates of 6, 8 and 10%. The discount rates were selected due to the inflation rate being approximately 6% and the annual increases in service costs usually being between 6 and 10%.
The meter replacement and water loss costs were also determined using the varying discount rates of 6, 8 and 10% using the formula:
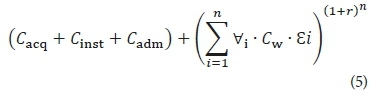
Where: n = number of years of the replacement period; Cacq = initial water meter acquisition costs; Cinst = initial water meter installation costs; Cadm = initial administrative costs; Cw = selling price of water; ∀i = average annual volume consumed on the year i; εi = error of the meter for year i; r' = real discount rate; i = meter age.
This was determined so as to be able to determine the number of years at which it will coincide with the NPVCn. This point would be point beyond which it might not be economical to keep the meter on the ground.
RESULTS AND DISCUSSION
Water meter age versus total registered volume
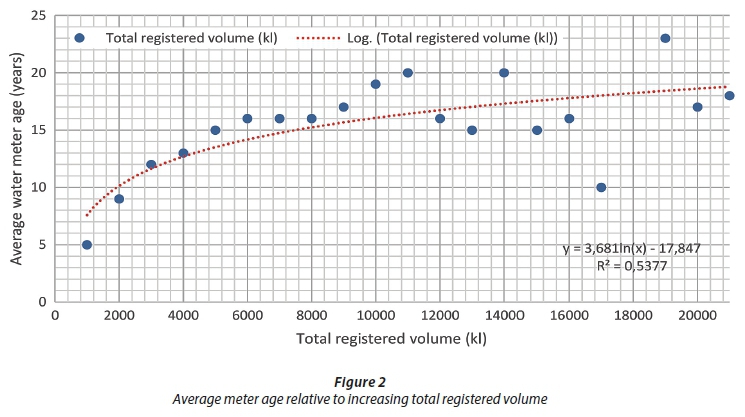
The average water meter age per total registered volume grouping was determined in 1 000 kL increments and plotted in Fig. 2. The figure shows logarithmic growth pattern with a steep increase in the meter age relative to total registered volume for the first 3 000 kL. This increase slows down from 4 000 kL onwards, peaking at 10 yr at 11 000 kL, and then shows some variations from 14 000 kL onwards.
Figure 2 shows that the correlation between meter age and total registered volume is not linear but logarithmic (y = 5.616 ln(x) − 33.488) with good correlation up to 8 000 kL, with R2 = 0.9797.. There is increased variability beyond ٨ 000 kL which could be due to the lower sample sizes with the potential for outliers to skew the data beyond this point. The R2 drops to 0.5377 if all data points are included. If a fifth order polynome is used for all data points the R2 improves to 0.6695. One can expect that the correlation might improve if consumers' information is analysed and added as input. The consumer analysis should be included in future research.
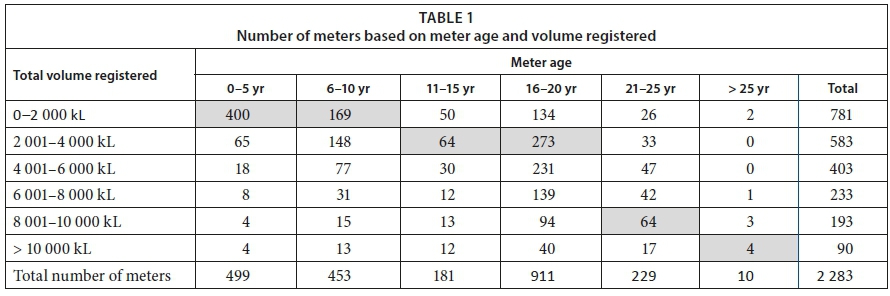
Table 1 depicts the sample size with the number of replaced meters in their respective age groups with their corresponding total registered volume groups. The cells in shaded grey highlight the highest number of replaced meters in each meter age group. For example, in the 0-5 yr meter age grouping, a total of 499 meters were replaced with 400 (highest) of these meters having a total registered volume of 0-2 000 kL. Similarly, in the 16-20 yr meter age grouping, a total of 911 meters were replaced with the 273 (highest) of these meters having a total registered volume of 2 001-4 000 kL.
Relative meter error versus meter age and total registered volume
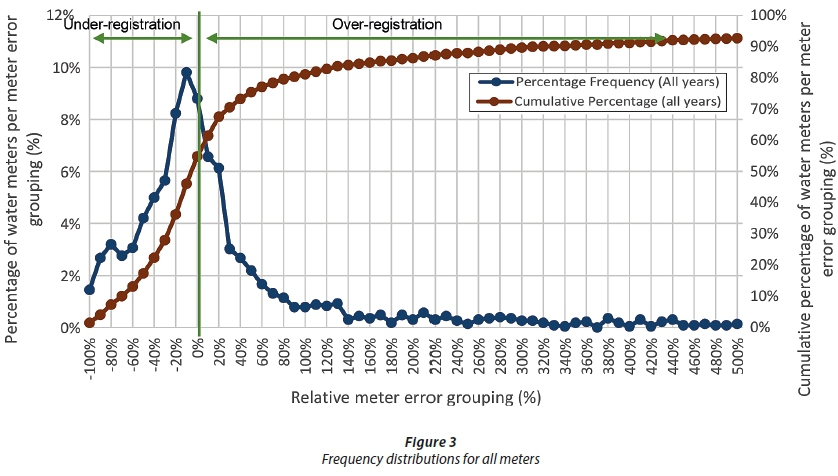
The relative meter errors (accuracy) of all the water meters were determined according to the formula of Van Zyl (2011), (εi = (Vi−Va)/Va,). The frequency distributions and cumulative frequency distributions of the relative meter errors are illustrated in Fig. 3. The figures show that the data tends towards a central location with the most meters (10%) peaking at the 0 to −10% meter error point. The plot line for the cumulative percentage of water meters per meter error shows that 55% of the water meters were under-reading and 45% were over-reading.
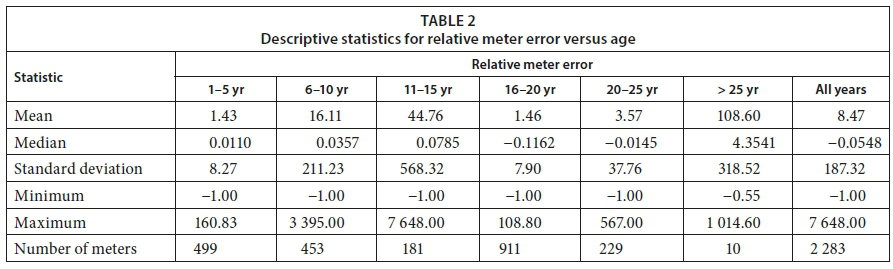
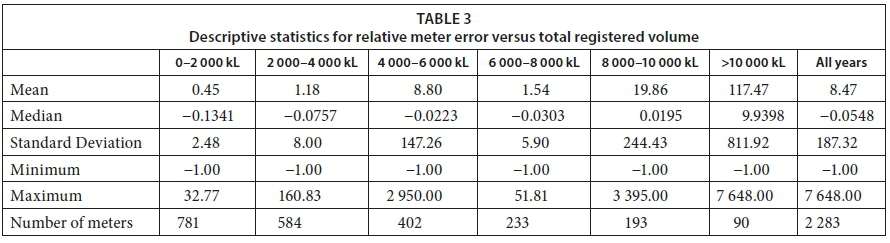
The descriptive statistics for the stratified meter data are tabulated in Table 2 and Table 3. From the descriptive statistics it is evident that the data tend to a log-normal distribution because the data are bounded to an under-registration of −100% (−1.00) and unbounded for over-registration, and the average values in Table 2 and Table 3 are significantly higher than the mean values. The median was therefore selected as the preferred measure of the central location of the mean relative meter error (Couvelis and Van Zyl, 2015).The data for the meters aged 1-5 yr and those aged 16-20 yr showed the least standard error and standard deviation. The meters aged 16-20 yr were the most replaced meters at 911 replacements, followed by those that are 1-5 yr, at 499 replacements. The high number of samples in these meter age increments could be the reason for the lower standard errors and standard deviations.
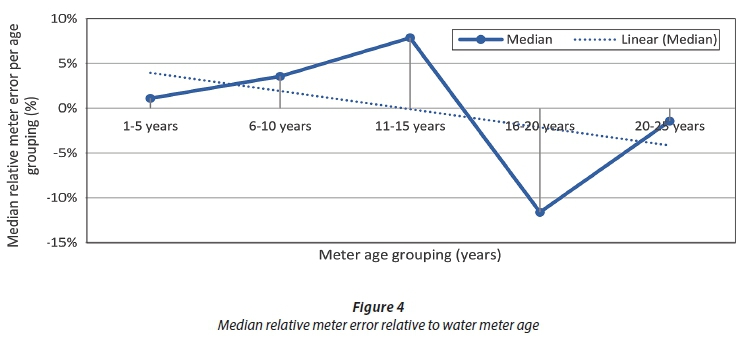
The median relative meter error was plotted against the meter age in 5-yr increments in Fig. 4. The figure shows a decreasing trend from a meter over-registration from 1.10% for the meters aged 1-5 yr to an under-registration of 1.45% for the meters 20-25 yr. The linear trend line plotted on the same graph (Fig. 3) starts at approximately +4% and ends at approximately −4%, crossing the 0% median meter error axis line at 11-15 yr. The median meter error of 43.54% for the meters that are older than 25 yr was not plotted on the graph as it greatly skewed the graph and analysis thereof, due to the very low sample number (10) and the variability of the data.
The median relative meter error was plotted against 2 000 kL increments of the total registered volume in Fig. 5. The figure shows an increasing trend from a meter under-registration from −13.41% for the meters with total registered volumes between 0 and 2 000 kL to an over-registration 1.95% for the meters with total registered volumes between 8 000 and 10 000 kL. The linear trend line plotted on the same graph (Fig. 5) starts at approximately −12% and ends at approximately +2%, crossing the 0% median meter error axis line at approximately 7 750 kL. The median meter error of 993.98% for the meters with total registered volumes above 10 000 kL was not plotted on the graph as it greatly skewed the graph and analysis thereof, due to the very low sample number (90) and the variability of the data.
The median relative meter error for all of the meters is −5.48%. This means that the median under-registration of all replaced water meters was 5.48%.
Volume of apparent losses caused by water meter inaccuracies
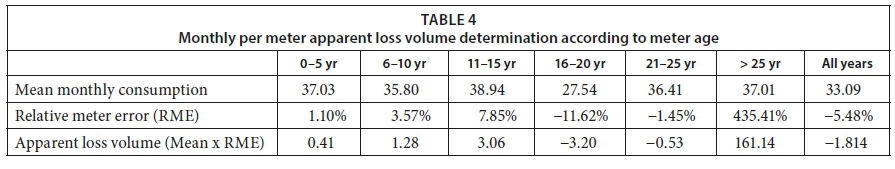
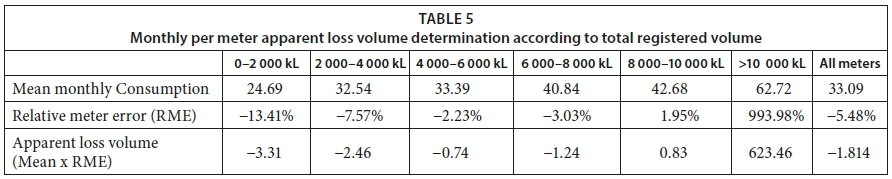
The descriptive statistics for the average monthly water consumption of the new water meters for the 12-month period after installation (actual water consumption), as stratified according to age in 5-yr increments and total registered volume in 2 000 kL increments, were determined. The average (mean) monthly consumption per stratification according to age and total registered volume, and the respective relative meter errors were used to determine the volume of apparent losses due to water meter inaccuracies and tabulated in Tables 4 and 5, respectively.
From Tables 4 and 5 it is evident that the levels of apparent losses due to meter inaccuracies vary according to meter age and total registered volume. The average volume of apparent losses due to meter inaccuracies was determined to be 1.814 kL−1∙meter−1∙month−1. The municipality, according to the water balance submitted to the Department of Water and Sanitation for the 2014/15 financial year, had 472 054 metered domestic connections. The total volume of apparent losses due to water meter under-registration for the municipality was therefore determined to be 10 275 671.47 kL∙yr−1, equating to 2.81% of the total system input volume of 364 906 484 kL∙yr−1.
Optimal domestic water meter replacement period
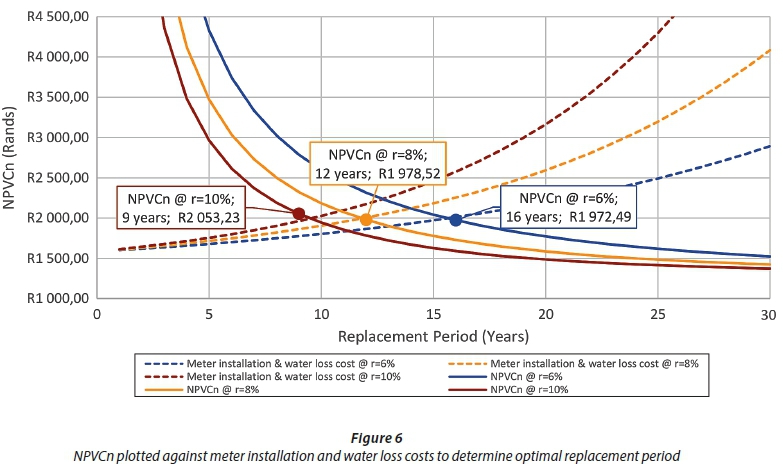
The NPVCn and the meter replacement and water loss costs were determined using the varying discount rates of 6, 8 and 10% and plotted Fig. 6. The NPVCn method was found to be limited in that it could not be used to determine the optimal meter replacement period in terms of total registered volume.
Upon analysis of Fig. 6 it is evident that the NPVCn curves and meter replacement and water loss curves intersect at 9, 12 and 16 yr replacement periods at discount rates of 10%, 8% and 6%, respectively. The total registered volumes corresponding to the 9, 12 and 16 yr replacement periods were determined using the municipality's annual average water consumption of 397 kL∙yr−1 and determined to be 3 971, 5 162 and 6 750 kL, respectively.
The optimal meter replacement period for this particular municipality can therefore be considered to be between 10 and 17 yr, depending on the prevailing discount rates.
DISCUSSION
This study found no absolute relation between water meter age and total registered volume. This is probably the reason why several authors and water boards suggest a meter lifespan either by age or total registered volume, and not both.
This study found the median relative meter error to be decreasing with increasing water meter age. This is in line with findings by Couvelis and Van Zyl (2015) and Mukheibir et al. (2012) who also observed a similar pattern. This study found the median relative meter error to increase from under-registration to over-registration as the total registered volume increased. This is in contrast to the findings by Couvelis and Van Zyl (2015), who reported strong linear trends in increasing water inaccuracy resulting in under-registrations of 0.36%∙yr−1 for meters below 25 yr and 0.9% per 1 000 kL of total registered volume.
The study has also determined the volume of apparent water losses caused by domestic water meter inaccuracies due to age and total registered volume for this particular municipality to be 1.814 kL per meter per month, which translated to apparent water losses caused by meter inaccuracies being 2.81% of the municipality's total system input volume. This is very close to the findings by Couvelis and Van Zyl (2015) of an average meter under-registration error of 2.6% of consumption estimate due to meter aging in other South African metropolitan municipalities.
The optimal water meter replacement period of the municipality was determined to be at water meter ages of 9, 12 and 16 yr and total registered volumes of 3 971, 5 162 and 6 750 kL, at discount rates of 10%, 8% and 6%, respectively. This largely coincides with the meter replacement policies reviewed by Mukheibir et al. (2012) that specify that meters should be replaced when they reach a meter age of 10 to 15 yr and a total registered volume of 3 500 to 7 000 kL.
The determination of the relative meter error, which would be specific to the municipality due to network and other conditions, and the average annual water consumption, are important for the determination of the optimal replacement period. The impact of varying relative meter errors and average annual water consumptions cannot be underestimated, as it can result in a shift in the optimal replacement period by a number of years. The discount rate used in the calculation also has a significant impact on the optimal water meter replacement period as evidenced by a 4% difference in the discount rate, resulting a 7-yr variance in the optimal replacement period.
CONCLUSION
Water meter under-registration is an important consideration for water utilities and municipalities as it amounts to significant losses in terms of apparent losses and lost revenue. Municipalities should scientifically determine the optimal replacement periods for the meters in their particular municipality, as this is likely to be different from other municipalities due to the varied factors that affect meter accuracy. This would result in the formulation and implementation of appropriate meter replacement strategies and a reduction of apparent losses due to water meter non-registration and under-registration.
The aim of this study was to determine the optimal point at which domestic water meters are to be replaced. This required that the authors determine if a relationship exists between domestic water meter age, total registered volume and accuracy; the volume of apparent water losses caused by inaccuracies due to domestic water meter age and total registered volume; and determine the optimal period at which domestic water meters are to be replaced.
The study has found that there is a relationship between water meter age and accuracy as well as between total registered volume and accuracy, with the total registered volume trend moving from under-registration to over-registration, while the meter age trend moved from over-registration to under-registration. The study has also determined the volume of apparent water losses caused by domestic water meter inaccuracies due to age and total registered volume for this particular municipality to be 1.814 kL per meter per month, which translated to 2.81% of the municipality's total system input volume. The study also determined the optimal water meter replacement period of the municipality to be at water meter ages of 9, 12 and 16 yr and total registered volumes of 3 971, 5 162 and 6 750 kL, at discount rates of 10%, 8% and 6%, respectively.
RECOMMENDATIONS
Based on the findings of this study, it is recommended that:
•The municipality should change its meter management policy to include alarms for meter inspections and replacement, where necessary, at the suggested meter replacement periods.
•Further studies should be conducted to determine the meter non-registration component of the apparent losses as it can be more significant than the meter under-registration (Mukheibir, et al., 2012).
•Further studies should be undertaken to modify the NPVCn method so as to be able to determine the optimal replacement period based on total registered volume.
REFERENCES
ARREGUI FJ, COBACHO R, CABRERA JR E and ESPERT V (2011) Graphical method to calculate the optimum replacement period for water meters. J. Water Resour. Plann. Manage. 137 (1) 143-146. https://doi.org/10.1061/(ASCE)WR.1943-5452.0000100 [ Links ]
BACON F (2016) Personal communication, 14 September 2016. Mr Francis Bacon, Chief Area Engineer, Water and Sanitation Department, Ekurhuleni Metropolitan Municipality, South Africa. [ Links ]
CITY OF LONDON (CANADA) (2016) Water Meter Replacement Program. URL: https://www.london.ca/residents/Water/Water-System/Pages/Water_Meter_Replacement_Program.aspx (Accessed 20 March 2016). [ Links ]
CITY OF WHEATON (ILLINOIS), Water Meter Replacement Program. URL: https://www.wheaton.il.us/watermeter/ (Accessed 20 March 2016). [ Links ]
COUVELIS FA and VAN ZYL JE (2015) Apparent losses due to domestic water meter under-registration in South Africa. Water SA 41 (5) 698-704. https://doi.org/10.4314/wsa.v41i5.13 [ Links ]
COUVELIS F and VAN ZYL J (2012) Apparent water losses related to municipal metering in South Africa. WRC Report No. 1998/1/12. Water Research Commission, Pretoria. [ Links ]
CRESCENT VALLEY WATER DISTRICT (2016) Meter Replacement Program.URL: http://www.cvwd.com/uploads/files/web%20page%20info%20100312%20final.pdf (Accessed 20 March 2016). [ Links ]
CRIMINISI A, FONTANAZZA CM, FRENI G and LA LOGGIA G (2009) Evaluation of the apparent losses caused by water meter under-registration in intermittent water supply. Water Sci. Technol. 60 (9) 2373-2382. https://doi.org/10.2166/wst.2009.423 [ Links ]
DECKER CW (2006) Managing water losses in Amman's renovated network: a case study. Manage. Environ. Qual.: Int. J. 17 (1) 94-108. https://doi.org/10.1108/14777830610639468 [ Links ]
DWA (Department of Water Affairs, South Africa) (2013) National Water Resource Strategy: Water for an Equitable and Sustainable Future - Second Edition. URL: https://www.dwa.gov.za/nwrs/LinkClick.aspx?fileticket=3AVrHanrkfw%3D&tabid=91&mid=496 (Accessed 6 March 2016). [ Links ]
FANTOZZI M, CRIMINISI A, FONTANAZZA CM, FRENI G and LAMBERT A (2009) Investigations of under-registration of costumer meters in Palermo (Italy) and the effect of introducing unmeasured flow reducers. In: Proceedings of Water Loss 2009 South Africa. 589-595. [ Links ]
FANTOZZI M (2009) Reduction of customer meters under-registration by optimal economic replacement based on meter accuracy testing programme and unmeasured flow reducers. In: Proceedings of the 5th IWA Water Loss Reduction Specialist Conference 2009. 233-239. [ Links ]
FARLEY M, WYETH G, GHAZALI ZBM, ISTANDAR A and SINGH S (2008) The manager's non-revenue water handbook - a guide to understanding water losses. URL: http://www.farleywaterconsulting.co.uk/images/books-and-articles/Managers-NRW-Handook-Asia.pdf (Accessed 28 February 2016). [ Links ]
FONTANAZZA CM, FRENI G, LOGGIA GL, NOTARO V and PULEO V (2012) A composite indicator for water meter replacement in an urban distribution network. Urban Water J. 9 (6) 419-428. https://doi.org/10.1080/1573062X.2012.690434 [ Links ]
MCKENZIE R, SIQALABA Z and WEGELIN W (2012) The state of non-revenue water in South Africa. WRC Report No. TT 522/12. Water Research Commission, Pretoria. [ Links ]
MUKHEIBIR P, STEWART R, GIURCO D and O'HALLORAN K (2012) Understanding non-registration in domestic water meters. AWA Water December 2012. 95-100. [ Links ]
MUKHEIBIR P and GIURCO D (2011) Understanding apparent water losses through non-registration of domestic meters: The relevance for non-revenue water and meter replacement policies. SWF 617- 002, (prepared for the Smart Water Fund), Institute for Sustainable Futures, University of Technology, Sydney, November 2011. URL: https://waterportal.com.au/swf/images/swf-files/617---002-understanding-apparent-water-losses.pdf (Accessed 28 February 2016). [ Links ]
MUTIKANGA HE, SHARMA SK and VAIRAVAMOORTHY K (2011) Investigating water meter performance in developing countries: A case study of Kampala, Uganda. Water SA 37 (4) 567-574. https://doi.org/10.4314/wsa.v37i4.18 [ Links ]
NARRABRI SHIRE MUNICIPALITY, 2013. Water Meter Policy. URL: http://www.narrabri.nsw.gov.au/files/uploaded/file/YourCouncil/Policy Register/Engineering Services/23_4 Water Meter Policy.pdf (Accessed 20 March 2016). [ Links ]
REGIONAL MUNICIPALITY OF PEEL (2016) Water Meter Replacement Program. URL: https://www.peelregion.ca/pw/water/rates/waterbills/watermeters/ (Accessed 20 March 2016). [ Links ]
RSA (Republic of South Africa) (2016). National water security. URL: http://www.gov.za/about-government/government-programmes/national-water-security-2015 (Accessed 7 March 2016). [ Links ]
SEAGO C and MCKENZIE R (2007) An assessment of non-revenue water in South Africa. WRC Report No. TT 300/07. Water Research Commission, Pretoria. [ Links ]
SYDNEY WATER (2015) Water Meters Policy. URL: http://www.sydneywater.com.au/web/groups/publicwebcontent/document s/document/zgrf/mdq3/~edisp/dd_047498.pdf (Accessed 20 March 2016). [ Links ]
VAN ZYL JE (2011) Introduction to Integrated Water Meter Management. WRC Report No. TT 490/11. Water Research Commission, Pretoria. [ Links ]
Received 1 March 2018
Accepted in revised form 6 March 2019
* To whom all correspondence should be addressed. e-mail: amarnewick@uj.ac.za

