


Servicios Personalizados
Articulo
 Inglés (pdf)
 Articulo en XML
 Referencias del artículo
Indicadores

Links relacionados
-
 Citado por Google
 -
 Similares en Google
Compartir

 Permalink
Water SA
versión On-line ISSN 1816-7950
versión impresa ISSN 0378-4738
Water SA vol.45 no.2 Pretoria abr. 2019
http://dx.doi.org/10.4314/wsa.v45i2.01
A simple calibration of Hobo 4 channel analogue dataloggers for use with Watermark 253-L soil water potential sensors
Nkosinathi D KapteinI, *; Louis W TitshallI, II
IInstitute for Commercial Forestry Research, PO Box 100281, Scottsville 3201, South Africa
IIUniversity of KwaZulu-Natal, School of Agriculture, Environment and Engineering, Private Bag X01, Scottsville, 3209, South Africa
ABSTRACT
The combination of granular matrix sensors with a Hobo 4 analogue channel datalogger provides a relatively inexpensive continuous soil water monitoring system. However, the datalogger excites all 4 channels concomitantly as it reads the sensor measurement of each channel in sequence. This results in localised electrolysis causing measurement bias error in Channels 2, 3 and 4. To evaluate this channel bias, Watermark granular matrix sensors were connected to Hobo 4 channel dataloggers to measure electrical conductance of the soil. This study formed part of a larger study aimed at understanding water use by Eucalyptus plantations at different soil depths. The measured soil conductivity was calibrated against the gravimetric method in soil derived from Natal Group Sandstone and Dwyka Tillite that occur in southern KwaZulu-Natal. The channels of a Hobo 4 channel datalogger were successfully calibrated against the gravimetric method for both soil types (R2 > 0.92). The voltage measurements of each channel increased in the order 1 < 2 < 3 < 4 for both soil types at a soil water content range of 12 to 44% and 6 to 46% for Dwyka Tillite and Natal Group Sandstone soils, respectively. Channel measurements were similar at soil water content ranges below 12 and 6% for tillite and sandstone soils, respectively. The study showed that Channels 2, 3 and 4 of the Hobo 4 channel datalogger are affected by electrolysis. If this analogue datalogger is used with these types of sensors, these channels need to be calibrated back to Channel 1.
Keywords: channel bias, electrical conductance, electrolysis, granular matrix, soil water status
INTRODUCTION
South Africa is generally classified as a water-scarce country with an average annual rainfall of 495 mm, compared to the global average of 860 mm (Schulze and Lynch, 2007). This rainfall is often not evenly distributed leading to regular and localised drought conditions (Phillips, 2016). The ever-increasing demand for water resources from different industrial sectors is a big concern for water security. The agricultural and forestry industries have not been spared the water supply challenges. It is becoming increasingly important to identify relatively inexpensive technology to monitor soil water status, fluxes and rates of change. Soil water status can be monitored as volumetric water content (VWC, cm3∙cm−3) or soil water potential (SWP, kPa), as described in detail by Smith and Mullins (2000); Kirkham (2005) and Jones (2008). The SWP is the preferred method since it is a measure of the suction energy (or matric potential) that drives water movement in the soil and gives an indication of the energy required by plants to extract water from the soil. This is considered a more direct indicator of the potential for plant water stress conditions (Jones, 2008).
Granular matrix sensors have become popular for SWP measurement due to their relatively low cost, ease of use, robustness and compatibility with a variety of dataloggers (Spaans and Baker, 1992; Thompson et al., 2006; Nolz et al., 2013). These sensors measure the resistance to flow of electricity between two electrodes encased within a porous matrix (either a stabilised matrix forming part of the electrode or the soil matrix itself). As the water content between the electrodes increases (i.e. matric potential increases toward saturation), the resistance between the electrodes decreases, thus providing a measure of change in soil water content. For a given soil, a calibration between water content and matric potential exists, which can be calibrated to sensor measurements (Whalley et al., 2013). Since most analogue logging devices can only read voltage, the resistance of the sensor needs to be converted using a half-bridge transformation (Fig. 1), as described in detail by Allen (1999; 2000). The voltage can be converted to resistance and then SWP using the calibration relationship developed by Shock et al. (1993).

An ideal datalogging device and sensor combination, particularly in remote locations, should be low-cost, robust, easy to program, independent of AC power and have a large memory for long-term remote data recording (Gebregiorgis and Savage, 2006). It is also advantageous if the above-ground components of the device can be easily hidden to minimise potential theft and vandalism. The Onset Hobo 4 channel datalogger meets most of these requirements. This datalogger has a built-in LCD screen to view measurements in near real-time and is powered by two AAA lithium batteries (providing several months of regular logging capability). The 4 MB recording memory stores up to 1.9 million measurements (Onset, 2016) and so allows the user to evaluate water status trends over time by downloading data to a notebook computer using proprietary Hobo software (HOBOware) during site visits. The 4 external channels of this logger can be wired to a variety of sensors, such as temperature, 4-20 mA and voltage input sensors (Onset, 2016). However, some limitations of this logger have been previously reported (Allen, 1999; 2000). This datalogger excites all 4 channels concurrently using direct current (DC) as it measures the voltage of each channel in succession (Allen, 1999; 2000). Whenever the DC current delays for more than 2 ms, a bias in sensor measurements occurs due to localised electrolysis of water that is in direct contact with the sensor electrodes. After initiation of excitation, electrolysis creates micro-bubbles of gas and vapour that result in increased sensor resistance measurement. Therefore, Channel 2 (CH 2), Channel 3 (CH 3) and Channel 4 (CH 4) generally have a progressively large bias in resistance measurements compared to Channel 1 (CH 1) (Allen, 1999; 2000; Jumman, 2009). The aim of the study was to measure soil water resistance using granular matrix sensors connected to a Hobo 4 channel datalogger and compare and calibrate different channels as influenced by electrolysis. To provide context for the study reported here, these sensors and logging units had been installed at several hillslope positions within two different soil types as part of a larger study investigating water and nutrient supply and movement under plantation forestry in southern KwaZulu-Natal, South Africa. To better interpret the logger measurements, it was necessary to develop simple calibrations of the sensors and logger outputs for the two soil types.
MATERIALS AND METHODS
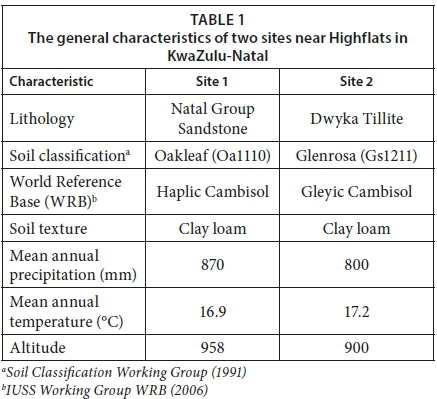
Soil samples were collected from the orthic A horizons in two KwaZulu-Natal soil types; the first derived from Natal Group Sandstone (30°16′7.72″S 30°15′35.39″E) and the second from Dwyka Tillite (30°12′12.02″S 30°16′7.28″E) at a depth of 0-20 cm (only mineral soil was collected). Basic
characteristics and classification for these sites are shown in Table 1. Each soil type was air dried and loosely ground in the laboratory and packed in a 4.5 L container (length = 33 cm, width = 22 cm and depth = 7 cm) at a bulk density of 1.1 g∙cm−3 and 1.2 g∙cm−3 for sandstone and tillite derived soils, respectively. Granular matrix sensors (Watermark model 253-L; Irrometer Co. Inc., Riverside, CA) were connected to a Hobo 4 channel analogue datalogger (model: UX120-006M) (Onset Computer Corp., Pocasset, MA) using a 2.5 mm stereo jack to measure soil voltage conductivity (mV). A soil voltage conductivity of 0 mV and 2.5 mV indicates a saturated and dry soil, respectively. Two Hobo 4 channel dataloggers were used in the experiment, each connected with 4 granular matrix sensors per soil type. An additional datalogger was wired with TMC6-HD soil temperature sensor (Onset Computer Corp) to measure soil temperature.
Calibration experiment
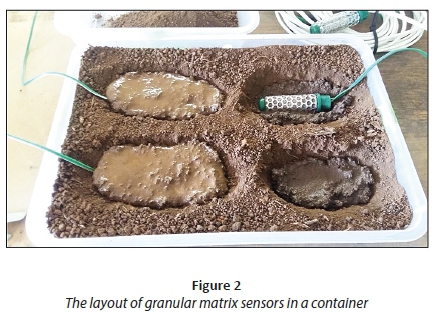
The experiment was conducted in the laboratory at the Institute for Commercial Forestry Research (ICFR) located at the University of KwaZulu-Natal, Pietermaritzburg, South Africa. Prior to the experiment, the granular matrix sensors were soaked in water for 24 h as recommended by the manufacturer. Thereafter, 4 sensors were inserted horizontally in a slurry (3 cm deep) in a uniformly spaced pattern (Fig. 2) in separate containers for each soil type to minimise the soil water gradient between the bottom and surface of the soil container. The TMC6-HD soil temperature sensor was also inserted vertically in the middle of the sandstone soil. Each soil type was then saturated with water for 24 h. Thereafter, all 4 sensors were connected one at a time to each datalogger channel and voltage measurements were recorded to determine sensor measurement bias error. This was conducted at both low voltage (wet range) and at maximum channel voltage output (dry range).
For the calibration experiment, the soil was dried by slow continuous evaporation aided by a fan. Sensor measurements were recorded hourly and commenced when all the free-flowing water had evaporated at the surface of each soil type. At the same time, each soil container was weighed 3 times a day using a mass balance to determine the gravimetric water content. This process was repeated until the sensor output reached the maximum output voltage of 2.5 mV. The gravimetric water content was converted to VWC by dividing it by the oven dry bulk density of the packed soil in the container and multiplying it by the water density (assumed as being 1 g∙cm−3). The VWC was then related to the logger measurements.
Allen (1999) recommends converting datalogger voltage output into resistance using:
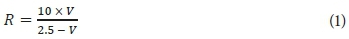
where R is the resistance of the granular matrix sensor (kOhms), 10 (in kOhms) is the fixed resistance, V the voltage that is measured by the logger (mV). The R may be converted to matric potential (kPa) using the calibration equation (Shock et al., 1993):
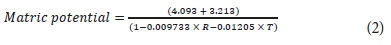
where T is the average soil temperature (°C).
Statistical analysis
Analysis of variance (ANOVA, Genstat 18, VSN international) was used to test for the effects of channel measurements on sensor output. Prior to statistical analysis, data were checked for assumptions of normality and homogeneity of variance, and no transformations were required. Where the overall F-statistic was significant (p < 0.05), treatment means were compared using Fischer's Least Significant Difference at the 5% level of significance (LSD5%). A regression analysis was used to determine the relationship between sensor output (mV) and VWC(cm3∙cm−3). Statistical parameters that were used included the co-efficient of determination (R2), root mean square error (RMSE) and standard error of a regression slope (SE slope) (Snedecor and Cochran, 1980).
RESULTS
Sensor comparison within channels
There were no significant differences (p > 0.05) between sensor measurements within each channel at both the low and high voltage range, indicating a lack of sensor bias. The relatively small differences suggested that each individual sensor is unique in construction and may also have been influenced by sensor placement within the containers as reported by Allen (2000).
Sensor output versus volumetric water content
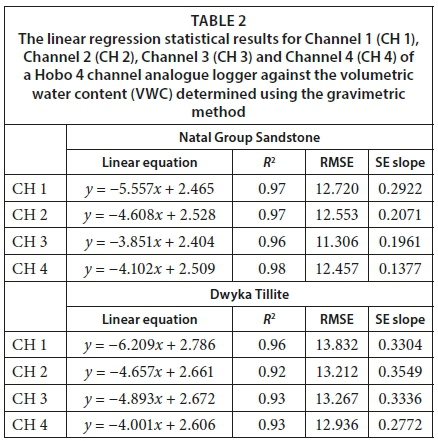
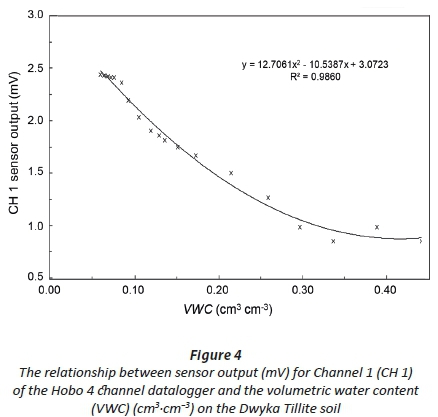
The relationship between the volumetric water content (cm3∙cm−3) and sensor output (mV) for CH 1 was linear for the soil water content range of 5 to 30% for tillite and of 2 to 30% for sandstone, with R2 values of 0.96 for both soils. A similar relationship was observed for CH 2, CH 3 and CH 4 with R2 of greater than 0.92 (Table 2). For water content above 30%, relationship was not linear, the best fit was through a 2nd order polynomial (R2 = 0.98) in both soil types (Figs 3 and 4).

Sensor comparison between channels
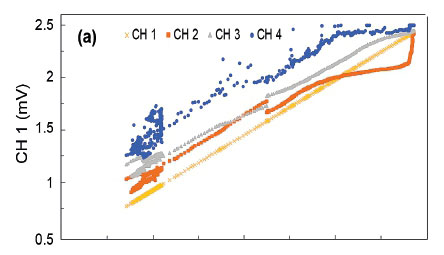
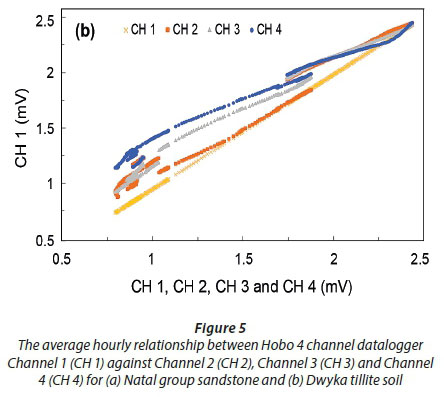
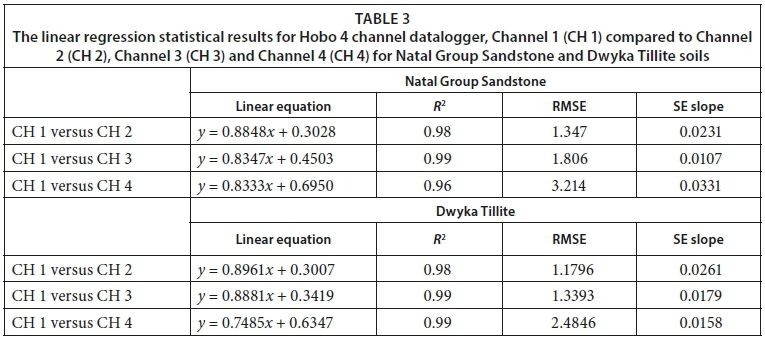
Comparison of CH 2, CH 3 and CH 4 against CH 1 showed a linear relationship with R2 greater than 0.96 for all channels on both soil types (Table 3). CH 2 had the best linear fit at 95% slope and intercept confidence limits with the least RMSE (Table 3) on both soils. The measured voltage between different channels over time followed the order: CH 1 < CH 2 < CH 3 < CH 4 (Figs 5a and b). There were no significant differences (p > 0.05) between CH 1 and CH 2 for both soil types throughout the voltage range: 0.87 to 2.45 mV. However, CH 2 consistently measured high voltage. Significant differences (p < 0.05) were found between CH 1 and CH 3 at a voltage range of 0.87 to 2.0 mV. In the case of CH 1 and CH 4, significant differences (p = 0.016) were found in the voltage range of 0.87 to 2.49 mV. There was a shift in the calibration relationship at the voltage range of 1.5 to 2.0 mV in both soil types. This was due to a power failure during the experimental period which caused the fan to switch off, reducing evaporation in both soils. A strong non-linearity was observed between CH 1 and CH 2 in sandstone soil at voltage conductivity above 2 mV (Fig. 5a). The cause of this is unclear. It may have been caused by a sensor bias; however, there were no statistical differences (p > 0.05) between channels. Of interest, channel measurement differences were larger at low voltage and decreased with increase in soil voltage conductivity (Figs 5a and b). The average soil temperature range was 18 to 23°C and did not significantly affect the sensor measurements.
DISCUSSION
The results from this study showed that there is a good linear relationship between VWC and sensor measured voltage (particularly for CH 1) at VWC less than 30%. For VWC greater than 30%, the relationship was not linear, suggesting that these sensors best estimate VWC below 30%. Van Antwerpen (1994) found that for South African soils in the clay loam textural range, this is about the equivalent of −10 kPa. This is supported by the study conducted by Shock et al. (1993), where changes in Watermark sensor resistance were highly non-linear in the saturation to field capacity (i.e., free pore water) SWP range: 0 to −10 kPa becoming nearly linear in the range: −10 to −75 kPa (free water drained). CH 1 consistently measured lower voltage, followed by CH 2, CH 3 and CH 4 at low voltage conductivity. Jumman (2009) reported similar results using granular matrix sensors coupled with a Hobo 3 channel datalogger, where voltage responses were higher for CH 3, followed by CH 2, compared to CH 1 under the same capillary pressure. According to Allen (1999; 2000) this is caused by using direct current (DC) instead of an alternating current (AC) to excite the datalogger channels. This results in electrolysis which forms micro gas bubbles, hence an increase in the resistance of the sensor. Electrolysis is more prominent at high water content and decreases with decrease in water content. Allen (2000) reported that CH 1 measurements are not affected by electrolysis and are presumed accurate. In this case, CH 2, CH 3 and CH 4 may then be calibrated to CH 1 measurements using linear equations provided in Table 3 for a specific soil type. This calibration is of utmost importance because large channel measurement differences are within the plant available water range (5-30% VWC).
According to Spaans and Baker (1992), soil temperature differences can affect granular matrix sensors SWP measurements by 1 to 3% per 1°C change in soil temperature. Under testing conditions, soil temperature did not significantly affect sensor measurements. However, significant impacts may be possible in field conditions. Evidence of this has been reported by Shock et al. (1993), with the greatest effect of soil temperature at high voltage conductivity. This means that the greatest error happens when the SWP is low and the decision to irrigate or not irrigate needs to be taken. Therefore, the importance of soil temperature correction cannot be over-emphasised.
CONCLUSIONS
The combination of Hobo 4 channel datalogger and granular matrix sensors may be used as a less expensive option for monitoring and storing SWP data for periodical evaluation of soil water status or irrigation water management throughout the growing season. This enables the grower to reflect on the impacts of the recorded SWP and conduct the necessary water management changes for the following growing season. This combination can also be used for scheduling irrigation as reported by Jumman and Lecler (2009). It is worth noting that soil-specific channel calibration is needed to correct for channel bias error.
ACKNOWLEDGEMENTS
We thank the Department of Science and Technology (DST)/Sector Innovation Fund (SIF) for financial assistance that made this study possible. Many thanks also go to several staff members of the ICFR for their constructive input on this study.
REFERENCES
ALLEN RG (1999) Instructions for attaching soil water resistance blocks to the Onset Hobo H-08 4-Channel External Soil Moisture Logger (or the single channel data Hobo logger). University of Idaho. URL: https://www.kimberly.uidaho.edu/water/swm/WM_Hobo2.htm (Accessed 19 February 2018). [ Links ]
ALLEN RG (2000) Summary of M.K. Hansen AM400 and Onset HOBO datalogger and Watermark sensor demonstration and testing near Twin Falls. University of Idaho. URL: http://www.kimberly.uidaho.edu/water/swm/ (Accessed 21 April 2018). [ Links ]
GEBREGIORGIS MF and SAVAGE MJ (2006) Field, laboratory and estimated soil-water content limits. Water SA 32 155-162. http://dx.doi.org/10.1080/02571862.2006.10634746 [ Links ]
IUSS WORKING GROUP WRB (2006) World Reference Base for Soil Resource: a framework for international classification, correlation and communication. World Soil Resources Report No. 103. Food and Agriculture Organisation, Rome, Italy. 130 pp. [ Links ]
JONES HG (2008) Irrigation scheduling-comparison of soil, plant and atmosphere monitoring approaches. Acta Hortic. 792 391-403. https://doi.org/10.17660/ActaHortic.2008.792.46 [ Links ]
JUMMAN A (2009) A framework to improve irrigation design and operating strategies in the South African sugarcane industry. MSc dissertation, University of KwaZulu-Natal, Pietermaritzburg. 157 pp. [ Links ]
JUMMAN A and LECLER NL (2009) A continuous soil water potential measurement system for irrigation scheduling assessment. Proc. S. Afr. Sug. Technol. Ass. 82 608-612. [ Links ]
KIRKHAM MB (2005) Principles of Soil and Plant Water Relations. Academic Press, Netherlands. 500 pp. [ Links ]
NOLZ R, KAMMERER P and CEPUDER P (2013) Calibrating of soil water potential sensors integrated into a wireless monitoring network. Agric. Water. Manage. 116 12-20. https://doi.org/10.1016/j.agwat.2012.10.002 [ Links ]
ONSET (2016) Hobo 4-Channel analogue datalogger (UX120-006M): Instruction manual. URL: http://www.onsetcomp.com/files/manual_pdfs/17384-E%20UX120-06M%20Manual.pdf (Accessed 10 April 2018). [ Links ]
PHILLIPS L (2016) Super-efficient irrigation: tips for crop farmers. URL: https://www.farmersweekly.co.za/agri-technology/farming-for-tomorrow/super-efficient-irrigation-tips-crop-farmers/ (Accessed 10 April 2018). [ Links ]
SCHULZE RE and LYNCH SD (2007) Monthly rainfall and its inter-annual variability. In: Schulze RE (ed.) South African Atlas of Climatology and Agrohydrology. WRC Report No. 1489/1/06. Water Research Commission, Pretoria. [ Links ]
SHOCK CC, BARNUM JM and SEDDIGH M (1993) Calibration of granular matrix sensors for irrigation management. Agron. J. 85 1228-1232. https://doi.org/10.2134/agronj1993.00021962008500060025x [ Links ]
SMITH KA and MULLINS CE (2000) Soil and Environmental Analysis: Physical Methods. Marcel Dekker, New York. 656 pp. [ Links ]
SNEDECOR GW and COCHRAN WG (1980) Statistical Methods. Iowa State University Press, Iowa. 593 pp. [ Links ]
SOIL CLASSIFICATION WORKING GROUP (1991) Soil Classification - a Taxonomic System for South Africa. Department of Agricultural Development, Pretoria. 257 pp. [ Links ]
SPAANS JA and BAKER JM (1992) Calibration of watermark soil moisture sensors for soil matric potential and temperature. Plant and Soil 143 213-217. https://doi.org/10.1007/BF00007875. [ Links ]
THOMPSON RB, GALLARDO M, AGUERA T, VALDEZ LC and FERNANDEZ MD (2006) Evaluation of the Watermark sensor for use with drip irrigated vegetable crops. Irrig. Sci. 24 185 - 202.. https://doi.org/10.1007/s00271-005-0009-5. [ Links ]
VAN ANTWERPEN R, MEYER JH and JOHNSTON MA (1994) Estimating water retention of some Natal sugar belt soils in relation to clay content. Proc. S. Afr. Sug. Technol. Ass. 68 75-79. [ Links ]
WHALLEY WR, OBER ES and JENKINS M (2013) Measurement of the matric potential of soil water in the rhizosphere. J. Exp. Bot. 64 3951-3963. https://doi.org/10.1093/jxb/ert044. [ Links ]
Received 26 June 2018
Accepted in revised form 6 March 2019
* To whom all correspondence should be addressed. e-mail: nkosinathi.kaptein@icfr.ukzn.ac.za

