


Services on Demand
Article
 English (pdf)
 Article in xml format
 Article references
Indicators

Related links
-
 Cited by Google
 -
 Similars in Google
Share

 Permalink
Water SA
On-line version ISSN 1816-7950
Print version ISSN 0378-4738
Water SA vol.45 n.1 Pretoria Jan. 2019
http://dx.doi.org/10.4314/wsa.v45i1.13
ORIGINAL ARTICLES
Water use of selected grain legumes in response to varying irrigation regimes
Tendai P Chibarabada*; Albert T Modi; Tafadzwanashe Mabhaudhi
Centre for Transformative Agricultural and Food Systems, School of Agricultural, Earth and Environmental Sciences, College of Agriculture, Engineering and Science, University of KwaZulu-Natal, Pietermaritzburg, South Africa
ABSTRACT
Grain legumes have potential to contribute to food and nutritional security in water-scarce areas. Information on their yield, water use and water productivity (WP) would be useful for their promotion. The aim of the study was to make a comparative assessment of adaptation, yield, water use and WP of an African indigenous grain legume (bambara groundnut) and two major grain legumes (dry bean and groundnut) under rainfed, deficit and optimum irrigation conditions. Field trials were conducted during the 2015/16 and 2016/17 summer seasons in KwaZulu-Natal, South Africa, using a split-plot design arranged in completely randomised blocks with three replications. Data collected included stomatal conductance, leaf area index, timing of key phenological stages and yield. Water use was calculated as a residual of the soil water balance. Water productivity was obtained as the quotient of grain yield and water use. Crops adapted to limited soil water availability through stomatal regulation and reduction in canopy size and duration. Yield, yield components and WP varied significantly (P < 0.05) among crop species. During 2015/16, groundnut had the highest yield and WP (10 540 kg·ha−1 and 0.99 kg·m−3, respectively). During 2016/17, the highest yield and WP were observed in dry bean, 2 911 kg·ha−1 and 0.75 kg·m−3, respectively. For both seasons, dry bean had the lowest water use (143-268 mm) across all water treatments. Dry bean and groundnut out-performed bambara groundnut with respect to yield, harvest index and WP. For any promotion of bambara groundnut as an alternative crop, there is need for crop improvement to improve yield and WP.
Keywords: bambara groundnut, dry bean, groundnut, yield, water productivity
INTRODUCTION
Grain legumes play an integral role in the 2030 agenda for sustainable development due to their high nutritional value and various environmental and sustainability benefits (FAO, 2016). Their promotion could alleviate the high prevalence of malnutrition reported in regions such as sub-Saharan African and South Asia where 23.2% and 34.5% of the population, respectively, is malnourished (FAO, IFAD, WFP, 2015). In addition to the existing burden of malnutrition, these regions are expected to carry more than 70% of the world's expected 2 billion population growth by 2050 (Population Reference Bureau, 2014). This necessitates the need for more nutritious food to feed the growing population and alleviate malnutrition. Grain legumes are rich sources of protein and micronutrients hence increasing their production could contribute to the regions' food and nutritional requirements (Foyer et al., 2016).
Sub-Saharan Africa (SSA) and South Asia (SA) are also faced with increasing aridity and water scarcity, which hinders agricultural production (Falkenmark et al., 1989; Seckler et al., 1999). Current strategies on increasing food production under water-limited conditions emanate from the 'more crop per drop' notion which describes the need to produce more food with the current water resources or using less water for the current food production (Passioura, 2006; Zoebl, 2006; Molden et al., 2010). This has also been referred to as 'improving water productivity'. The greatest improvements in water productivity (WP) under water-scarce regions will derive from better agronomic practices, improved irrigation management and growing appropriate crops and genotypes (Passioura, 2006; Molden et al., 2010; Descheemaeker et al., 2013).
Currently, the major grain legumes dominating cropping systems in SSA and SA are soybean, groundnut and dry bean (Chibarabada et al., 2017). Major grain legumes are species that are recognized internationally regardless of their centres of diversity, occupy significant crop area, and have been subject to formal crop improvement (Chibarabada et al., 2017). These major crops have replaced indigenous grain legumes in rural cropping systems (Pasquet, 1999). Indigenous grain legumes are defined as those that have originated from the semi- and arid tropics and are neglected or underutilised in any dimension (geographic, social, and economic) (Padulosi et al., 2002). Indigenous crops are reported to be well-adapted to water-limited conditions (Chivenge et al., 2015; Massawe et al., 2015; Mayes et al., 2012). There is talk of re-introducing them as part of diverse efforts to improve productivity of semi-arid and arid cropping systems (Chivenge et al., 2015; Massawe et al., 2015; Mayes et al., 2012). Separate studies have determined yield, water use and water use efficiency of grain legumes under different environments with varying outcomes (Abayomi et al., 2008; Mabhaudhi et al., 2013; Munoz-Perea et al., 2007; Obalum et al., 2011; Patel et al., 2008). A limitation to these studies was that results were not comparable and robust to allow for comparative analyses of yield and water use of grain legumes.
This study is the first, to our knowledge, to provide a comparison of major legumes and indigenous legumes to benchmark indigenous grain legumes to major grain legumes. This will allow for a robust comparison between indigenous grain legumes and major grain legumes. It was hypothesised that indigenous grain legumes and major grain legumes perform the same under field conditions. The objective of this study was to conduct a comparative analysis of adaptation, yield, water use and WP of a selected indigenous grain legume (bambara groundnut - Vigna subterranea) and selected major grain legumes [dry bean (Phaseolus vulgaris) and groundnut (Arachis hypogaea)] under rainfed, deficit and optimum irrigation conditions in a semi-arid environment.
MATERIAL AND METHODS
Site, climate and soil
Experiments were conducted during the 2015/16 and 2016/17 summer season at the University of KwaZulu-Natal's (UKZN) Ukulinga Research Farm in Pietermaritzburg, KwaZulu-Natal, South Africa (29°37'S; 30°16'E; 750 m amsl). Ukulinga is classified as a subtropical climate with low risk of frost occurrence. Average annual rainfall is 694 mm, which is received mainly during the summer months (mid-October to mid-February). Winter rain (April to August) is below 75 mm, hence summer is the predominant cropping season under rainfed conditions. During the summer months, average maximum temperatures are between 26°C and 28°C while minimum temperatures can be as low as 10°C. The soil was characterised as Cleveland with an effective rooting depth of 0.40 m.
Plant material, experimental design and management practices
Major grain legumes selected for the study were groundnut and dry bean (common bean). Groundnut, cultivar Kwarts, was sourced from Agricultural Research Council Grain Crops Institute, Potchefstroom. Dry bean, cultivar Ukulinga, was sourced from McDonald seeds, Pietermaritzburg. The selected indigenous grain legume was a bambara groundnut landrace that was sourced from the rural area of Jozini in KwaZulu-Natal, South Africa.
During 2015/16, trials were planted on 17 November 2015. During 2016/17, planting was on 16 January 2017. The experimental design was a split-plot design arranged in randomised complete blocks with 3 replications. The main plots were water regimes [(optimum irrigation (OI), deficit irrigation (DI) and rainfed] while the subplots were the 3 grain legume crops (dry bean, groundnut and bambara groundnut). Subplot size was 5 m × 3.75 m.
Irrigation was applied through a sprinkler system with a distribution uniformity of ≈ 85%. The sprinkler nozzles had a throw distance (radius) of 8 m. The distance between the water treatments was 12 m to avoid sprinkler overspray. Irrigation scheduling was based on management allowable depletion (MAD). Management allowable depletion was the maximum amount of total available water (TAW) allowed to be depleted from the root zone before irrigation occurs. In the OI treatment, MAD was 20% TAW. Management allowable depletion of 20% TAW is ≈ 40% MAD of plant available water (PAW). This was based on the Alberta Irrigation Management Manual (2016), recommended management allowable depletion (MAD) for grain legumes. The approach to DI was to apply irrigation (MAD: 20% TAW) at the growth stages that were most sensitive to water stress (Geerts and Raes, 2009). The most water stress sensitive growth stages of the grain legume crop species were the flowering and pod-filling stages (Ahmed and Suliman, 2010; Vurayai et al., 2011). All the water treatments were fully irrigated up to the point where 90% of the sown seed had emerged to ensure establishment of all trials. In the rainfed trial, irrigation was withdrawn after emergence and the trial relied entirely on rainfall thereafter.
Department of Agriculture, Forestry and Fisheries recommended plant populations of 66 667 plants·ha−1 for bambara groundnut and 88 889 plants·ha−1 for dry bean and groundnut were used. The trials were planted on ploughed and rotovated land which had been left fallow for 1 year after a sorghum and cowpea intercrop had been harvested. Groundnut and dry bean were planted on furrows while bambara groundnut was planted on mounted ridges. Groundnut was ridged 4 weeks after planting. Seeds were treated with an insecticide (chlorpyrifos at the rate of 0.6 g of active ingredient per kg of seed) and a fungicide (Mancozeb at the rate of 0.0015 g active ingredient per mL per 1 kg of seed) before planting. Based on results of soil analyses, an organic fertiliser, Gromor accelerator (0.3% N, 0.15% P and 0.15% K), was applied at planting at a rate of 4 000 kg·ha−1 to meet the nutrient requirements for the grain legume crops. The trials were kept weed free through monthly routine hand weeding using hand hoes. During weeding, bambara groundnut and groundnut were re-ridged to maintain the ridges. Kemprin 200 EC (3 g a.i per 15 L water) was sprayed in all plots 7 weeks after planting to control cutworm and leafhopper. Chlorpyrifos 480 EC (7.2 g active ingredient per 15 L water) was applied in all plots 12 weeks after planting to control black aphids.
Measurements
Climate data
Daily weather data (maximum (Tmax) and minimum (Tmin) air temperature (°C), rainfall (mm) and reference evapotranspiration (ETo) (mm)) were obtained from an automatic weather station located at the Research Farm. The automatic weather station is part of the Agricultural Research Council - Institute for Soil, Climate and Water (ARC-ISCW) network of automatic weather stations. Crop coefficients (Kc) were obtained from Allen et al. (1998).
Irrigation
The sprinkler irrigation system had an approximate application rate of 7 mm·hr−1. This was used to estimate irrigation run time. The actual amount of irrigation after each irrigation event was measured using rain gauges randomly placed in the experimental plots.
Soil water content
Soil water content (SWC) was measured using a PR2/6 profile probe connected to an HH2 handheld moisture meter (Delta-T, UK). To measure soil water content the PR2/6 is inserted in pre-installed access tubes that are 1 m long. One access tube was installed in each sub-plot. The soil profile at the experiment site was shallow with an effective rooting depth of 0.40 m; hence access tubes were installed up to a depth of 0.40 m. The sensors of the PR2/6 profile probe are positioned to measure volumetric water content at 6 depths (0.10, 0.20, 0.30, 0.40, 0.60 and 1.00 m along the probe). Since access tubes were installed up to 0.40 m deep the last two sensors of the PR2/6 positioned at 0.60 and 1.00 m were used to measure soil water content in the field at 0.10 m and 0.40 m, respectively.
Plant canopy and development
Emergence was recorded when the hypocotyl protruded 20 mm above the soil. Leaf area index (LAI), which is the one-sided green leaf area per unit ground surface area occupied by the plant was measured weekly using the LAI-2200C Plant Canopy Analyzer (LICOR, USA). Timing of key phenological stages (emergence, flowering, podding, senescence and maturity) was done through weekly visual observations. Time to emergence was when 90% of the experimental plants had the coleoptile piercing through the soil. Time to flowering, podding, senescence and maturity was defined by 50% of the experimental plants showing visual signs. A plant was defined to be flowering when the flower fully opens. A plant was defined as podding when the first pod appears on the plant. For groundnut and bambara groundnut, podding was observed through destructive sampling. Senescence was defined when at least 10% of leaves had senesced without new leaves being formed to replace them. A plant matured when at least 50% of leaves had senesced. Phenology data was then converted to thermal time (growing degree days (GDD)) using the equation by McMaster and Wilhem (1997); where,

where Tmax = maximum temperature (°C), Tmin = minimum temperature (°C), Tbase = generic base temperature for warm season grain legumes (8°C).
If Tmax < Tbase then Tmax = Tbase, and if Tmin < Tbase, then Tmin = Tbase.
Physiology
Stomatal conductance was measured weekly using a Steady State Leaf Porometer Model SC−1 (Decagon Devices, USA) on the abaxial surface of a new fully expanded and fully exposed leaf.
Yield and yield components
At harvest, 6 experimental plants from each subplot were randomly harvested. Thereafter the plants were air dried in a controlled environment situated at the UKZN Phytosanitary Unit for 11 days, until there were no changes in total biomass observed. Thereafter yield components were determined (total biomass, pod number, pod mass, grain number and grain mass). In the case of dry bean, total biomass referred to the above-ground biomass while for groundnut and bambara groundnut total biomass referred to the below- and above-ground biomass. Thereafter, harvest index (HI) was determined as:

where: HI = harvest index (%), Yg = economic yield based on grain yield (kg), and B = total biomass (groundnut and bambara groundnut)/above-ground biomass (dry bean) (kg).
Determination of water use
Water use (WU) for each treatment was calculated as the residual of a soil water balance (Allen et al., 1998):

where: WU = water use = evapotranspiration (ET) (mm), P = precipitation (mm), I = irrigation (mm), D = drainage (mm), R = runoff (mm), and ΔSWC = changes in soil water content (mm).
Drainage was considered as negligible since the observed impeding layer at 0.4 m restricted downward movement of water beyond the root zone. Runoff (R) was not quantified directly; however, the United States Department of Agriculture - Soil Conservation Service (USDA-SCS) procedure (USDA-SCS, 1967) was used to estimate the monthly effective rainfall that is stored in the root zone after subtracting the amount of rainfall lost to runoff. Monthly effective rainfall was estimated using mean monthly rainfall obtained from 30-year rainfall data of Ukulinga Research Station and monthly crop evapotranspiration for the different crops estimated using the crop coefficient approach ETo × Kc. The soil water balance was therefore simplified to;

where: WU = water use = evapotranspiration (mm), ER = effective rainfall (mm), I = irrigation (mm), and ΔSWC = changes in soil water content (mm).
Values of water use in mm (depth) were then converted to m3 (volume) using the formula;

Determination of WP
Water productivity (WP) was then calculated as;

where: WP is water productivity (kg·m−3), Ya is the grain yield (kg) and ET is the evapotranspiration (m3).
Data analyses
Data of the two seasons (2015/16 and 2016/17) were subjected to Bartlett's and Levene's tests for homogeneity of variance in GenStat 18th Edition (VSN International, UK). Results showed evidence of non-homogeneity of variance between the two seasons; hence the seasons were analysed separately. Analysis of variance (ANOVA) was performed using GenStat 18th Edition (VSN International, UK) at a probability level of 0.05. Least significant differences (LSD) were used to separate means. Path coefficients on the dependent variable (grain yield) were calculated separately for the two seasons in Microsoft Excel 2016 using the method by Dewey and Lu (1959), partitioning the correlations into components' direct and indirect effects.
RESULTS
Weather data and irrigation
During 2015/16, average maximum and minimum temperatures were 28°C and 16°C, respectively. During 2016/17 maximum temperatures ranged from 12-38°C (Fig 1). Minimum temperatures ranged between 10°C and 21°C during 2015/16, while they went as low as 7°C during 2016/17. Total rainfall during 2015/16 was 445 mm, while 2016/17 received 235 mm (52% of 2015/16). During 2015/16, total supplementary irrigation added to the OI and DI trials was 101 mm and 40 mm, respectively, while only 18 mm supplementary irrigation was added to the rainfed trial to support emergence. During 2016/17, total supplementary irrigation was higher compared to the previous season with 160 mm, 86 mm and 28 mm being added to the OI, DI and rainfed trials, respectively.
Plant physiology
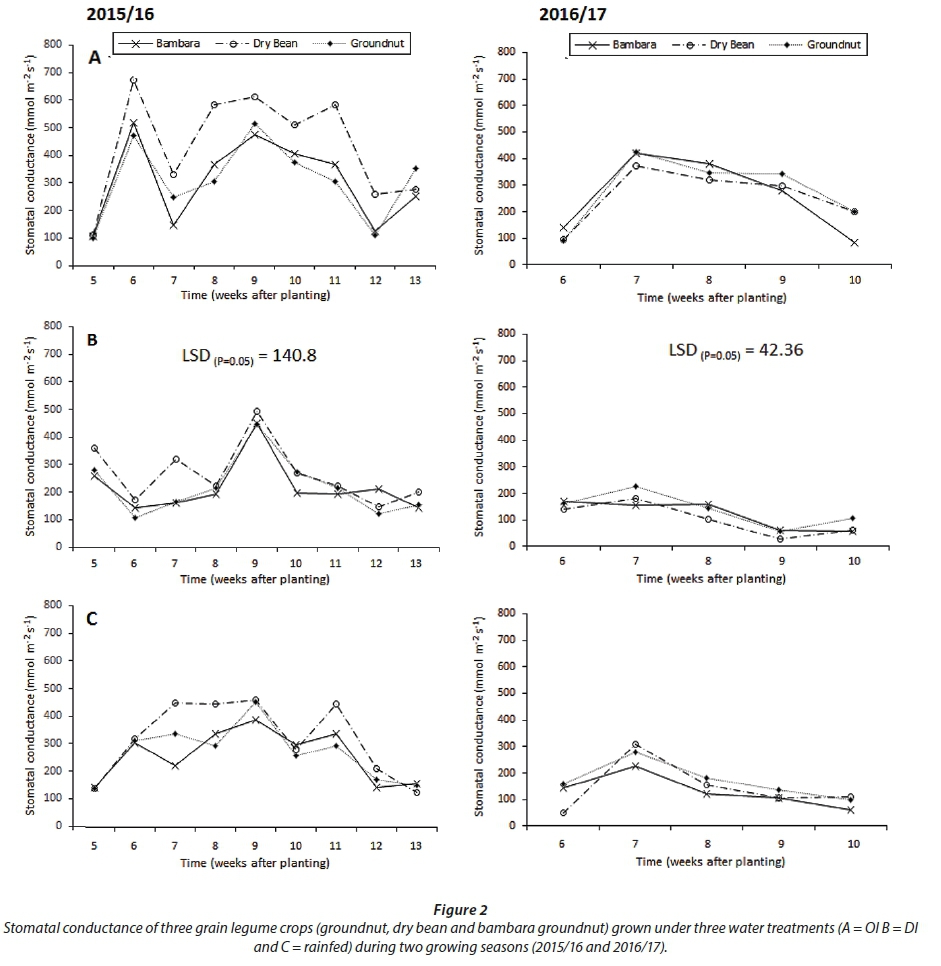
During both seasons, stomatal conductance responded significantly to the water treatments, crops and time (degree days) (P < 0.05) (Fig. 2). Stomatal conductance also fluctuated over time in response to fluctuating environmental conditions (soil water availability, air temperatures and ETo; Fig. 2). The OI trial had minimum water stress compared to the other water treatments. Consequently, stomatal conductance was higher in the OI trial compared to the others during both seasons (Fig. 2). Weather data showed that average temperatures and rainfall were higher during 2015/16 compared to 2016/17. Stomatal conductance responded to this with higher mean stomatal conductance in all the water treatments during 2015/16 (264.5 mmol·m−2·s−1) compared to 2016/17 (168.7 mmol·m−2·s−1). The crops responded differently to varying environmental conditions with dry bean showing the highest mean conductance (316.7 mmol·m−2·s−1) while bambara had the lowest mean conductance (234.6 mmol·m−2·s−1) during 2015/16. Results of 2016/17 were contradictory with dry bean showing the lowest mean conductance (150.7 mmol·m−2·s−1) and groundnut the highest mean conductance (180 mmol·m−2·s−1).
Plant canopy and development
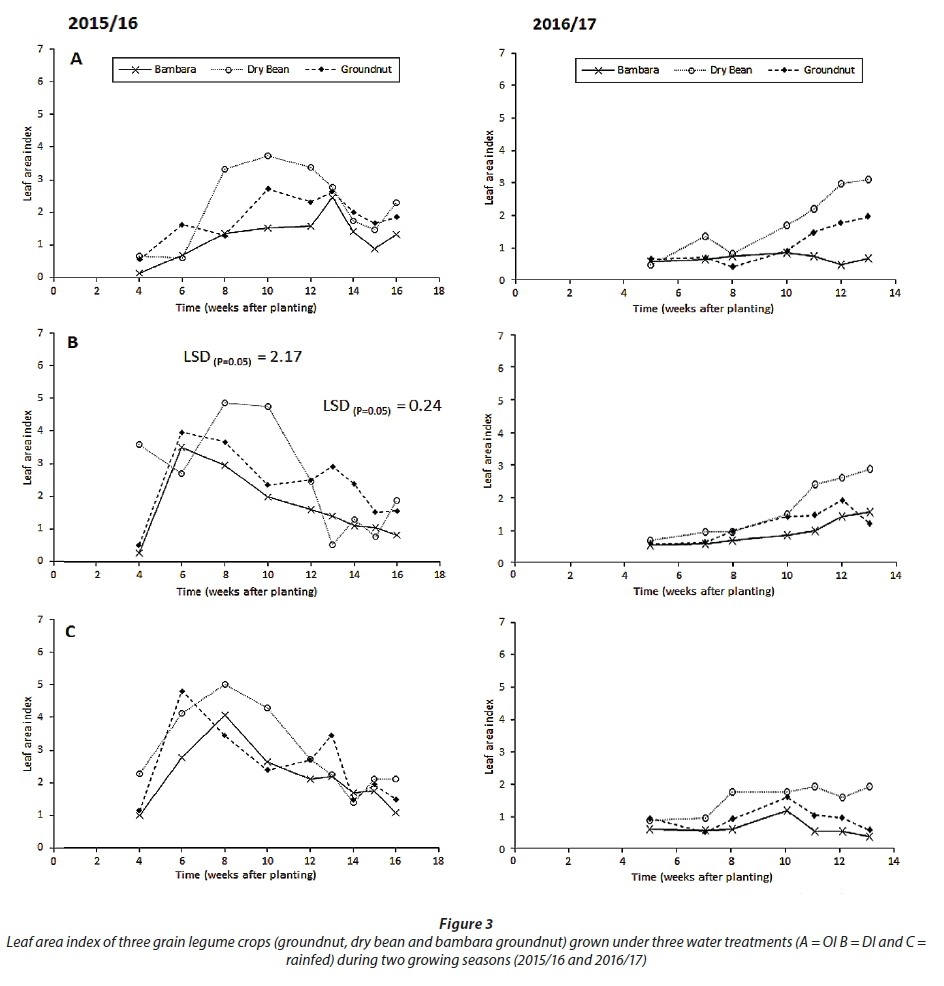
During 2015/16 LAI showed no significant differences (P > 0.05) among the crops (Fig. 3). Water treatments were also not significantly different (Fig 3). Although LAI fluctuated the trend was that it increased from planting up to 992 and 1 206 degree days, which coincided with podding in dry bean and both flowering and podding in groundnut and bambara groundnut. Thereafter, LAI declined as the crops started to senesce towards maturity (Fig. 3). During 2016/17, LAI showed a different trend with results of crops, water treatments and their interaction being significantly different at P < 0.001. A comparison of canopy size between seasons showed that 2016/17 had a smaller canopy size relative to 2015/16.
Time to all key phenological stages observed during the study (time to emergence, time to flowering, duration of flowering, time to podding, time to senescence and time to maturity) showed significant differences (P < 0.001) among the grain legume crops. This was consistent for both seasons. During 2015/16, the water treatments influenced time to flowering, time to podding and time to maturity (P < 0.05), while during 2016/17 water treatments only influenced duration of flowering. Consistent for both seasons, dry bean was the fastest to emerge (< 120 degree days) while bambara groundnut was the slowest (> 205 degree days). This supports the results of LAI where the dry bean canopy developed faster and the bambara groundnut canopy developed slower. Groundnut tended to flower and pod early (386 and 553 degree days, respectively). Bambara groundnut also had a long flowering period but time to flowering was later in the season (840 degree days) when compared to the other crops (< 642 degree days). Unlike bambara groundnut and groundnut, dry bean had distinct vegetative, flowering and podding stages, and consequently senesced and matured earlier. Groundnut and bambara groundnut were indeterminate and took up to 2 043 degree days. This was evident during the 2015/16 season where the canopy of groundnut and bambara showed much fluctuation due to replacement of senescing leaves with new ones (Fig 3).
Yield components, water use and water productivity
During 2015/16, results of yield components (total biomass, pod number, pod mass, grain number, grain yield, HI) and WP showed significant differences (P < 0.001) among the crop species. Yield components did not show any significant difference among the water treatments (P > 0.05). The interaction between the crops and the water regimes was only significantly different (P < 0.05) for pod mass, grain mass and WP (Table 1).
Groundnut had the longest season duration and the highest stomatal conductance, which translated to the highest total biomass (10 540 kg·ha−1). Dry bean matured earlier compared to the other crops and consequently accumulated the lowest total biomass (4 220 kg·ha−1). Early and prolonged flowering and podding in groundnut resulted in more pods (> 53 per plant) (Table 1). This translated to high pod yield (3 460-4 950 kg·ha−1). Although bambara groundnut was also indeterminate, it podded late in the season (≈ 77 DAP), resulting in the second highest number of pods (40-55 per plant); however, this did not translate to gains in pod yield. Bambara groundnut had the lowest pod yield (1 650-2 200 kg·ha−1), which was less than the major legumes (dry bean and groundnut). With respect to grain yields, the major legumes were also superior to bambara groundnut. Groundnut had the highest grain yield under DI, which was 100% more than bambara groundnut (Table 1). With respect to HI, dry bean exhibited a HI that was ≈ 45-50% higher than that of groundnut and bambara groundnut. Bambara groundnut, podded late into the season limiting the duration of pod filling, resulting in the lowest HI (21%) which was observed under rainfed conditions (Table 1).
As groundnut matured late and had the highest biomass it was expected that it would have the highest water use. Results were true to expectation with observed groundnut water use values of 319, 292 and 283 mm under OI, DI and rainfed conditions, respectively (Table 1). The inverse was also true as dry bean had the lowest water use, of 268, 238 and 238 mm under OI, DI and rainfed conditions, respectively. Groundnut, with the highest water use, also produced more grain yield, resulting in high WP (0.61-0.99 kg of grain per m−3 of water consumed). Poor grain yields for bambara groundnut resulted in the crop having the least WP (0.39-0.53 kg m−3) (Table 1). Based on mean values of water treatments, WP improved by ≈ 12% under rainfed and DI conditions compared to the OI.
Statistical trends of yield components during 2016/17 followed that of the 2015/16 season. Crop species showed significant differences (P < 0.05) while water treatments were not significantly different (P > 0.05) (Table 2). The interaction between the crops and the water regimes were only significantly different (P < 0.05) for pod yield and grain number (Table 2).
During 2016/17, dry bean outperformed the other crops with respect to biomass, pod yield, grain yield and HI (2 911 kg·ha−1, 1 872 kg·ha−1, 1 296 ha−1 and 49.2%, respectively). Although groundnut produced the highest number of pods across all treatments (> 17), this did not translate to high pod yield as observed during 2015/16. Bambara groundnut continued to trail the major legumes with respect to biomass and pod yield, with the least biomass and pod yield (1 346 kg ha−1 and 447 kg ha−1, respectively). During 2016/17, groundnut flowered and set pods late and matured earlier; consequently, it produced the lowest grain yield under DI and rainfed conditions (362 kg·ha−1 and 267 kg·ha−1, respectively). This translated to low HI, ranging between (10.5 and 24.2%), which was ≈ 50 to 300% less than dry bean. Despite dry bean producing the highest biomass, it had the lowest water use (143-195 mm) compared to the other crops; this accounted for high WP (0.66-0.75 kg·m−3). Consistent with the results of 2015/16, groundnut had the highest water use across all the water treatments (249-345 mm). A combination of low grain yield and high water use observed in groundnut led to the lowest WP (0.08-0.16 kg·m−3). (Table 2).
Path coefficient analysis for grain yield
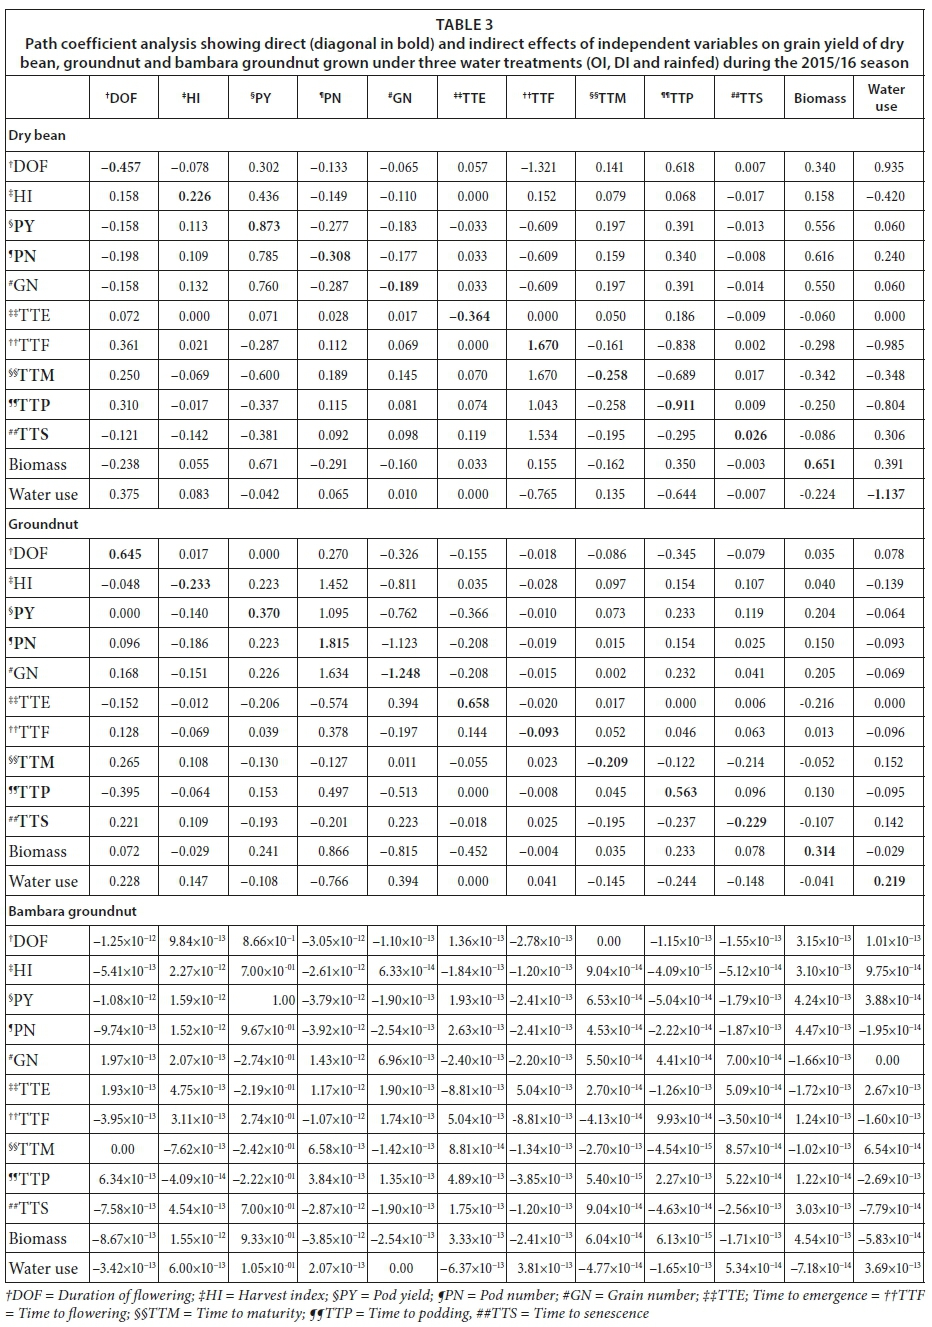
During 2015/16, groundnut had the highest grain yield. Based on results of path coefficient analysis, the high pod number of groundnut had highest contribution to the high grain yield. Early flowering and longer flowering duration observed in groundnut also contributed to grain yield (0.658 and 0.563, respectively). Bambara groundnut had the lowest yield and results of path analysis showed that grain number had the highest contribution to the observed grain yield. Path coefficient analysis also showed that for bambara groundnut the lengthy time to emergence and podding contributed negatively to grain yield (−8.81×10⁻¹³). For dry bean, path coefficient analysis for 2015/16 showed that time to flowering had the highest direct contribution to grain yield (1.670) (Table 3). During 2016/17, results of path coefficient analysis suggested the same relationships as those of the 2015/16 season.
DISCUSSION
In response to low soil water availability the crops regulated stomatal conductance to minimize water loss through transpiration. Canopy expansion was also regulated under limited soil water availability as a strategy to minimize surface area for transpiration and minimize water loss. The grain legumes under study also exhibited drought escape through hastening of key phenological stages (flowering, podding and maturity) under rainfed and DI conditions.
Under DI and rainfed conditions, plants regulated stomatal conductance to minimize water loss through transpiration. Consequently, carbon dioxide entering the plant was lowered and this had negative effects on photosynthesis and biomass accumulation. In this study, yield and yield components were not significantly affected by water treatments. This is contrary to results of several studies that have shown water treatments to significantly affect yield of grain legumes (Acosta Gallegos and Kohashi Shibata, 1989; Mabhaudhi et al., 2013). A possible explanation to these contradictory findings could be due to the cultivars used in the study and how water stress was imposed relative to this study. The cultivars used in the study showed suitability for rainfed conditions implying that with proper cultivar selection, grain legumes can be successfully grown under dryland conditions.
Water productivity improved by ≈ 12% under rainfed and DI conditions during 2015/16. Improvement in WP was achieved through reduction in water use (denominator) as yield was relatively similar (numerator). This supports the recommendations by several authors to apply DI to maximise crop WP (Hirich et al., 2011; Rodrigues and Pereira, 2009; Sarwar and Perry, 2002). During 2016/17, despite conserved water use under limited soil water availability and no significant differences in yield among water treatments, WP did not improve. During that season, there was poor canopy development that led to significant unproductive water loss through soil evaporation (Es). Water use comprised significant Es, hence there was no gain in WP despite the crop's attempt to conserve water use under limited soil water availability. Under these circumstances strategies to minimize soil evaporation such as mulching, intercropping, and increasing plant density should be considered.
Among the three crops, dry bean was determinate while groundnut and bambara groundnut were indeterminate. Determinacy was based on cessation of vegetative growth when the terminal flower of the main stem started to develop (Sablowski, 2007). This explains the observed differences in timing of phenological stages. Groundnut and bambara groundnut took more than 132 days to mature while dry bean took less than 116 days to mature. The differences in maturation time can be explored in situations where length of the season has a significant effect on growth of yield of crops. This was observed during 2016/17 where dry bean was able to produce reasonable yield under late planting. Dry bean would be a more suitable crop for short seasons, late planting or crop rotation within the same season. Groundnut and bambara groundnut were late maturing, and during 2016/17 where planting was late, yield was poor. This could be due to unfavourable reproductive growth caused by the observed low temperatures in autumn (March to May) that went below the base temperatures for the grain legumes.
Time to maturity also influences total water use with late maturing crops using more water than early maturing crops (Parker, 2009). This was the case in this study - water use was higher in groundnut and bambara groundnut which matured late. Canopy characteristics also influenced crop water use. A bigger canopy with a longer season had higher water use and biomass. This was the case for groundnut during 2016/17. Water use in bambara groundnut was also high but this was not matched by a large canopy and high biomass. Bambara groundnut showed a positive attribute for water-limited conditions - it had the lowest stomatal conductance under all the water regimes compared to the other crops. Although this may have negative implications on biomass production, it is a favourable attribute as it results in conserved water use. Conserved water use through low stomatal conductance was masked by the smaller canopy and long duration that could have led to significant unproductive water loss through Es. This implies that high water use observed in bambara groundnut included significant Es.
The hypothesis of the study was rejected as the major grain legumes had higher yield and WP compared to bambara groundnut. For successful promotion of indigenous grain legumes there is need for crop improvement to improve yield and WP. Results of path coefficient analysis revealed the need for continuous selection in landraces as bambara groundnut showed no clear pattern of attributes that contributed to high grain yield. For the same crop, path coefficient analysis showed that the lengthy time the crop took to emerge, flower and pod negatively contributed to grain yield. Comparing bambara groundnut with groundnut, a similar crop with the same indeterminate characteristic, bambara groundnut started flowering ≈ 35 days after groundnut. Bambara groundnut had less time for yield formation and this could be the reason for the observed yield inferiority. This could also be the reason for the low HI in bambara groundnut. Chibarabada et al. (2015) and Mabhaudhi et al. (2013) also reported poor yield and low HI in bambara groundnut. They attributed this to the use of landraces. This study showed that poor canopy development and lengthy time to reproductive stages contributed to the observed poor yield and low HI of bambara groundnut.
Compared to the other crops under study, dry bean had a significantly higher HI - a favourable trait indicating the plants' ability to convert biomass to economic yield more efficiently than groundnut and bambara groundnut. This could be due to the determinate behaviour of the variety, hence the crop focused on yield formation and not vegetative growth after flowering. Determinant varieties have generally higher harvest indices as most crop resources are diverted to grain once flowering commences (De Costa et al., 1997; Unkovich et al., 2010). This was, in part, supported by results of path coefficient analysis where time to flowering and biomass had the highest positive contribution on grain yield of dry bean.
During 2015/16, the highest WP values were observed for groundnut and the lowest WP values were observed for bambara groundnut. This contradicts Chibarabada et al. (2015) who reported that bambara groundnut was more water-use efficient than groundnut. This was based on WUE values that had been obtained in separate studies under different environmental and management conditions. This justifies the need for comparative studies under the same environment and management as WUE is greatly influenced by environment and management practices. During 2016/17, dry bean was more productive while groundnut was less productive. The decrease in WP observed in groundnut during 2016/17 was as a result of poor grain yield and not water use, as relative water use did not change compared to the previous season. This highlights the importance of proper management decisions such as planting date and crop choice as these have implications for food security and crop productivity.
CONCLUSION
Despite the two cropping seasons being heterogenous, the trend in plant adaptation to irrigation regimes was similar for both seasons. Water use was lower under limited soil water availability relative to OI. Despite this, the crops produced reasonable yields under DI and rainfed conditions. This led to improvements in WP under DI and rainfed conditions. This implies suitability of grain legumes for production in water-scarce areas. Results from this study suggest that there is scope to increase food production under rainfed systems. For bambara groundnut, despite low stomatal conductance, water use was high. This was because of poor canopy development that led to significant unproductive water use through Es. Consistent to both seasons, major legumes outperformed bambara groundnut with respect to yield, HI and WP, hence the hypothesis of the study was rejected. This highlights the need for crop improvement in bambara groundnut to make it attractive for farming. The grain legume crops exhibited different characteristics that contributed to yield and water use. For groundnut, late maturity led to high water use which translated to high biomass; early flowering and podding also contributed to high yield. For dry bean, early maturity led to low water use. Dry bean also had high grain yield, which translated to high HI and WP. The poor performance of bambara groundnut is evidence of lack of crop improvement relative to the major legumes as landraces are a mixture of genotypes with highly diverse populations both between and within them, making it challenging to assess their performance. This study showed that despite the semi-arid and arid tropics being the centre of diversity for indigenous grain legumes, this does not necessarily translate to high yield and WP. There is need for breeding efforts to improve indigenous grain legumes and make them more attractive for farming.
ACKNOWLEDGEMENTS
The Water Research Commission (WRC) of South Africa is acknowledged for funding and managing the research through WRC Projects No. (K5/2493//4) 'Water use and nutritional water productivity of food crops for improved nutrition and health in poor rural households' (WRC, 2016).
REFERENCES
ABAYOMI YA, AJIBADE TV, SAMUEL OF and SAADUDEEN BF (2008) Growth and yield responses of cowpea (Vigna unguiculata (L.) Walp) genotypes to nitrogen fertilizer (NPK) application in the Southern Guinea Savanna zone of Nigeria. Asian J. Plant Sci. 7 170-176. https://doi.org/10.3923/ajps.2008.170.176 [ Links ]
GALLEGOS JAA and SHIBATA JK (1989) Effect of water stress on growth and yield of indeterminate dry-bean (Phaseolus vulgaris) cultivars. Field Crops Res. 20 81-93. https://doi.org/10.1016/0378-4290(89)90054−3 [ Links ]
AHMED FE and SULIMAN ASH (2010) Effect of water stress applied at different stages of growth on seed yield and water-use efficiency of cowpea. Agric. Biol. J. N. Am. 1 534-540. [ Links ]
ALBERTA AGRICULTURE AND FORESTRY (2016) Alberta Irrigation Management Manual. URL: http://www1.agric.gov.ab.ca/$Department/deptdocs.nsf/all/irr14310/$FILE/2016_irr_manag_manual.pdf. (Accessed 21 December 2016). [ Links ]
ALLEN RG, PEREIRA LS, RAES D and SMITH M (1998) Crop evapotranspiration - Guidelines for computing crop water requirements. FAO Irrigation and Drainage Paper No. 56. URL: http://academic.uprm.edu/abe/backup2/tomas/fao%2056.pdf (Accessed 21 December 2016). [ Links ]
CHIBARABADA TP, MODI AT and MABHAUDHI T (2015) Bambara groundnut (Vigna subterranea) seed quality in response to water stress on maternal plants. Acta Agric. Scand. B Soil Plant Sci. 65 364-373. [ Links ]
CHIBARABADA TP, MODI AT and MABHAUDHI T (2017) Expounding the value of grain legumes in the semi- and arid tropics. Sustainability 9 60. https://doi.org/10.3390/su9010060 [ Links ]
CHIVENGE P, MABHAUDHI T, MODI AT, AND MAFONGOYA P (2015) The potential role of neglected and underutilised crop species as future crops under water scarce conditions in Sub-Saharan Africa. Int. J. Environ. Res. Public Health 12 5685-711. https://doi.org/10.3390/ijerph120605685 [ Links ]
DE COSTA W, DENNETT MD, RATNAWEERA U and NYALEMEGBE K (1997) Effects of different water regimes on field-grown determinate and indeterminate faba bean (Vicia faba L.). I. Canopy growth and biomass production. Field Crops Res. 49 83-93. https://doi.org/10.1016/S0378-4290(96)01059−3 [ Links ]
DESCHEEMAEKER K, BUNTING SW, BINDRABAN P, MUTHURI C, MOLDEN D, BEVERIDGE M, VAN BRAKEL M, HERRERO M, CLEMENT F and BOELEE E (2013). Increasing Water Productivity in Agriculture. Managing Water Agroecosyst. Food Secur. 10 104. https://doi.org/10.1079/9781780640884.0104 [ Links ]
DEWEY DR and LU K (1959) A correlation and path-coefficient analysis of components of crested wheatgrass seed production. Agron. J. 51 515-518. https://doi.org/10.2134/agronj1959.00021962005100090002x [ Links ]
FALKENMARK M, LUNDQVIST J and WIDSTRAND C (1989) Macro‐scale water scarcity requires micro‐scale approaches. In: Natural Resources Forum. Wiley Online Library. 258-267. https://doi.org/10.1111/j.1477-8947.1989.tb00348.x [ Links ]
FAO (2016) Pulses: Nutritious seeds for a sustainable future. URL: http://www.fao.org/3/a-bb029e.pdf (Accessed 21 December 2016). [ Links ]
FAO, IFAD and WFP (2015) The State of Food Insecurity in the World: Meeting the 2015 international hunger targets: taking stock of uneven progress. FAO, Rome. [ Links ]
FOYER CH, LAM HM, NGUYEN HT, SIDDIQUE KHM, VARSHNEY RK, COLMER TD, W. COWLING W, BRAMLEY H, MORI TA and HODGSON JM (2016) Neglecting legumes has compromised human health and sustainable food production. Nat. Plants 2 16112. https://doi.org/10.1038/nplants.2016.112 [ Links ]
GEERTS S and RAES D (2009) Deficit irrigation as an on-farm strategy to maximize crop water productivity in dry areas. Agric. Water Manage. 96 1275-1284. https://doi.org/10.1016/j.agwat.2009.04.009 [ Links ]
HIRICH A, CHOUKR-ALLAH R, JACOBSEN SE and HAMDY A (2011) Improving water productivity of chickpea by the use of deficit irrigation with treated domestic wastewater. Int. J. Vet. Sci. Med. 5 811-816. [ Links ]
MABHAUDHI T, MODI AT, and BELETSE YG (2013) Growth, phenological and yield responses of a bambara groundnut (Vigna subterranea L. Verdc) landrace to imposed water stress: II. Rain shelter conditions. Water SA 39 191-198. https://doi.org/10.4314/wsa.v39i2.2 [ Links ]
MASSAWE FJ, MAYES S, CHENG A, CHAI HH, CLEASBY P, SYMONDS R, HO WK, SIISE A, WONG QN and KENDABIE P (2015) The potential for underutilised crops to improve food security in the face of climate change. Proc. Environ. Sci. 29 140-141. https://doi.org/10.1016/j.proenv.2015.07.228 [ Links ]
MAYES S, MASSAWE FJ, ALDERSON PG, ROBERTS JA, AZAM-ALI SN and HERMANN M (2012) The potential for underutilized crops to improve security of food production. J. Exp. Bot. 63 1075-1079. https://doi.org/10.1093/jxb/err396 [ Links ]
MCMASTER GS and WILHELM WW (1997) Growing degree-days: one equation, two interpretations. Agric. Meteorol. 87 291-300. https://doi.org/10.1016/S0168-1923(97)00027-0 [ Links ]
MOLDEN D, OWEIS T, STEDUTOB P, BINDRABAN P, HANJRA MA and KIJNE J (2010) Improving agricultural water productivity: between optimism and caution. Agric. Water Manage. 97 528-535. https://doi.org/10.1016/j.agwat.2009.03.023 [ Links ]
MUNOZ-PEREA CG, ALLEN RG, WESTERMANN DT, WRIGHT JL and SINGH SP (2007) Water use efficiency among dry bean landraces and cultivars in drought-stressed and non-stressed environments. Euphytica 155 393-402. https://doi.org/10.1007/s10681-006-9340-z [ Links ]
OBALUM SE, IGWE CA and OBI ME (2011) Water use and grain yield response of rainfed soybean to tillage- mulch practices in south-eastern Nigeria. Sci. Agric. 68 554-561. https://doi.org/10.1590/S0103-90162011000500007 [ Links ]
PADULOSI S, HODGKIN T, WILLIAMS JT, HAQ N, ENGLES JMM, RAO VR, BROWN AHD and JACKSON MT (2002) 30 Underutilized Crops: Trends, Challenges and Opportunities in the 21st Century. CABI, New York. [ Links ]
PARKER R (2009) Plant & Soil Science: Fundamentals & Applications. Cengage Learning, Boston. [ Links ]
PASQUET RS (1999) Genetic relationships among subspecies of Vigna unguiculata (L.) Walp. based on allozyme variation. Theor. Appl. Genet. 98 1104-1119. https://doi.org/10.1007/s001220051174 [ Links ]
PASSIOURA J (2006) Increasing crop productivity when water is scarce-from breeding to field management. Agric. Water Manage. 80 176-196. https://doi.org/10.1016/j.agwat.2005.07.012 [ Links ]
PATEL GN, PATEL PT and PATEL PH (2008) Yield, water use efficiency and moisture extraction pattern of summer groundnut as influenced by irrigation schedules, sulfur levels and sources. J. SAT Agric. Res. 6 1-4. [ Links ]
POPULATION REFERENCE BUREAU (2014) 2014 World Population Data Sheet. URL: http://www.prb.org/pdf14/2014-world-population-data-sheet_eng.pdf/ (Accessed 10 February 2017). [ Links ]
RODRIGUES GC and PEREIRA LS (2009) Assessing economic impacts of deficit irrigation as related to water productivity and water costs. Biosyst. Eng. 103 536-551. https://doi.org/10.1016/j.biosystemseng.2009.05.002 [ Links ]
SABLOWSKI R (2007) Flowering and determinacy in Arabidopsis. J. Exp. Bot. 58 899-907. https://doi.org/10.1093/jxb/erm002 [ Links ]
SARWAR A and PERRY C (2002) Increasing water productivity through deficit irrigation: evidence from the Indus plains of Pakistan. Irrig. Drain. 51 87-92. https://doi.org/10.1002/ird.39 [ Links ]
SECKLER D, BARKER R and AMARASINGHE U (1999) Water scarcity in the twenty-first century. Int. J. Water Resour. Dev. 15 29-42. https://doi.org/10.1080/07900629948916 [ Links ]
SOIL CLASSIFICATION WORKING GROUP (1991) Soil Classification: A Taxonomic System for South Africa. Department of Agricultural Development, Pretoria, South Africa. [ Links ]
UNITED STATES DEPARTMENT AGRICULTURE - SOIL CONSERVATION SERVICES (1967) Irrigation water requirements, Technical Release 21. USDA SCS, Washington DC. [ Links ]
UNKOVICH M, BALDOCK J and FORBES M (2010) Variability in harvest index of grain crops and potential significance for carbon accounting: examples from Australian agriculture. Adv. Agron. 105 173-219. https://doi.org/10.1016/S0065-2113(10)05005-4 [ Links ]
VURAYAI R, EMONGOR V and MOSEKI B (2011) Effect of water stress imposed at different growth and development stages on morphological traits and yield of Bambara Groundnut (Vigna subterranea L. Verdc). Am. J. Plant Physiol. 6 17-27. https://doi.org/10.3923/ajpp.2011.17.27 [ Links ]
WRC (Water Research Commission) (2016) WRC Knowledge Review 2015/16: Research and Development for a Sustainable Future. Water Research Commission, Pretoria. [ Links ]
ZOEBL D (2006) Is water productivity a useful concept in agricultural water management? Agric. Water Manage. 84 265-273. https://doi.org/10.1016/j.agwat.2006.03.002 [ Links ]
Received 9 March 2018
Accepted in revised form 12 December 2018
* To whom all correspondence should be addressed. e-mail: tendaipolite@gmail.com

