


Services on Demand
Article
 English (pdf)
 Article in xml format
 Article references
Indicators

Related links
-
 Cited by Google
 -
 Similars in Google
Share

 Permalink
Water SA
On-line version ISSN 1816-7950
Print version ISSN 0378-4738
Water SA vol.45 n.1 Pretoria Jan. 2019
http://dx.doi.org/10.4314/wsa.v45i1.10
ORIGINAL ARTICLES
Deterioration in the water quality of an urbanised estuary with recommendations for improvement
JB AdamsI, II, *; L PretoriusI; GC SnowI, III
IDepartment of Botany, Nelson Mandela University, Port Elizabeth, South Africa
IIDST/NRF Research Chair in Shallow Water Ecosystems, Nelson Mandela University, Port Elizabeth, South Africa
IIISchool of Animal, Plant and Environmental Sciences, University of the Witwatersrand, Johannesburg, South Africa
ABSTRACT
Water quality characteristics of the heavily urbanised and industrialised Swartkops River and Estuary in the Eastern Cape have been the focus of several studies since the 1970s. Overloaded and poorly maintained wastewater treatment works (WWTWs), polluted stormwater runoff and solid waste have all contributed to the deterioration in the water quality of the river and estuary. The objective of this study was to determine the current water quality status of the Swartkops Estuary, by investigating spatial and temporal variability in physico-chemical parameters and phytoplankton biomass and where possible relate this to historical water quality data. The present study found evidence suggesting that water is not flushed as efficiently from the upper reaches of the estuary as was previously recorded. Reduced vertical mixing results in strong stratification and persistent eutrophic conditions with phytoplankton blooms (> 20 µg chl a·L−1), extending from the middle reaches to the tidal head of the estuary. The Motherwell Canal was and still is a major source of nitrogen (particularly ammonium) to the estuary, but the Swartkops River is the primary source of phosphorus with excessive inputs from the cumulative effect of three WWTWs upstream. An analysis of historical water quality data in the Swartkops Estuary (1995 to 2013) shows that all recorded dissolved inorganic phosphorus measurements were classified as hypertrophic (> 0.1 mg P·L−1), whereas 41% of dissolved inorganic nitrogen measurements were either mesotrophic or eutrophic. If nutrient removal methods at the three WWTWs were improved and urban runoff into the Motherwell Canal better managed, it is likely that persistent phytoplankton blooms and health risks associated with eutrophication could be reduced.
Keywords: Swartkops Estuary, nutrients, salinity, eutrophication, microalgae
INTRODUCTION
A threat facing many developing countries is the improper management of waste generated through various anthropogenic activities, combined with old and inadequate infrastructure, unskilled wastewater plant operators and financial constraints (WRC, 2013). Furthermore, urbanisation leads to increased stormwater volumes running off paved areas. Consequently, runoff that would previously have infiltrated the soil discharges directly into aquatic ecosystems, potentially harming the water quality and ecosystem health status more rapidly than diffuse sources (US EPA, 2003). Poor or inadequate stormwater management systems have also led to stormwater infiltrating the sewer system resulting in pump station overflows and overloading of sewage treatment plants not designed to cope with these loads.
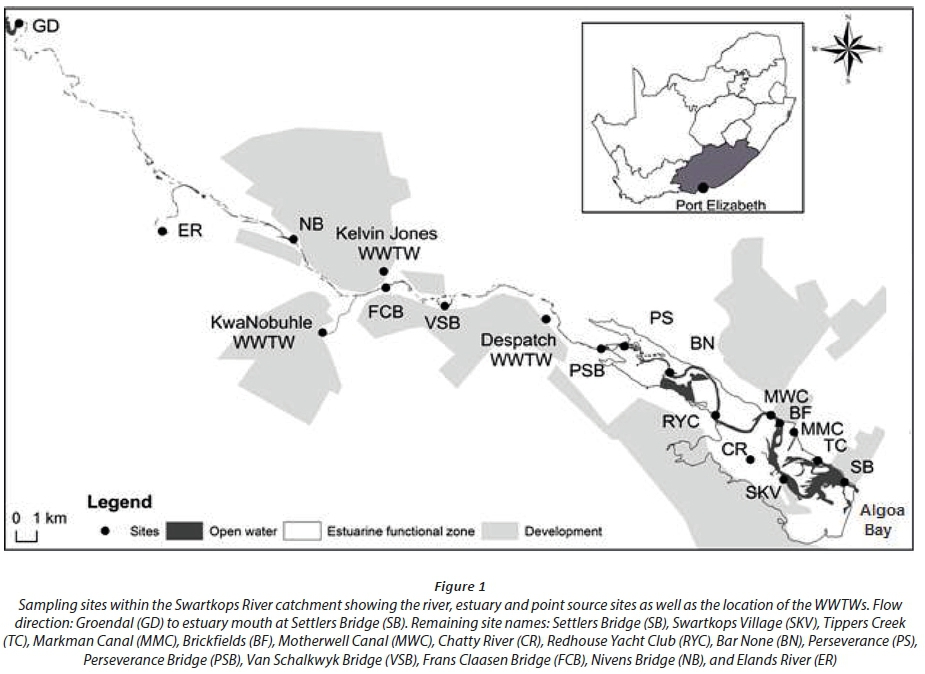
All these issues are relevant to the urbanised Swartkops Estuary (33.8604° S, 25.6221° E) in the Eastern Cape, where land use activities have measurably changed the water quality and health of the system (Enviro-Fish Africa, 2011; Lemley et al., 2017). The estuary, located 15 km north of the Port Elizabeth Central Business District, opens into Algoa Bay in the Indian Ocean. The estuary is 16.4 km long and the total length of the river is 155 km from the mouth to its origin (Baird et al., 1986). Swartkops is a nationally important estuary as it is one of the few systems that remain permanently open to the sea. The river and estuary meander through a highly urbanised and industrialised region of the Nelson Mandela Bay Municipality (NMBM). Anthropogenic activities affecting the estuary include wastewater treatment works (WWTW), saltpans, sand/clay mining, brickworks, tanneries, the motor industry, wool industry, extractive/beneficiation processes as well as marshalling railway yards and depots (Baird et al., 1986). In the 60 years from 1939 to 1998, industrial and residential developments removed 35 ha of supratidal salt marsh, leaving only 5 ha (Colloty et al., 2000). The deterioration in water quality has affected recreation, for example the relocation of the Redhouse River Mile swimming event elsewhere, because of high faecal coliform bacteria counts in the water. Furthermore, a number of sites above the tidal limit are used for cultural ceremonies by traditional healers, but the water quality is now so poor that participants mentioned during an informal interview that they cannot drink from the river during their cleansing ceremonies and depend on tap water carried to the sites.
Thus, the Swartkops Estuary is largely modified, with a Present Ecological State (PES) of Category D. A Recommended Ecological Category (REC) of a C is expected of this estuary (Van Niekerk et al., 2014) because of its national conservation importance. The estuary is ranked 11th out of over 280 estuaries nationwide, mainly as a result of its size, habitats and biodiversity (Turpie et al., 2002). Improvement to a C category can only be achieved through appropriate management interventions which require an understanding of the key drivers. Past studies have been of too short a duration to gather the long-term datasets needed for assessing historical patterns of change within the estuary. Our study in 2012-2013 measured water quality parameters to provide an assessment of the status of the estuary and to identify management actions and recommend monitoring requirements. River, sea and estuary sites were sampled as well as points of entry into the estuary (Chatty River, Markman Canal and Motherwell Canal) to identify pollutant inputs. New data were important because outdated water quality information had been used in the Swartkops Integrated Environmental Management Plan (Enviro-Fish Africa, 2011).
Bacterial measurements showed high Escherichia coli and enterococci levels, especially in the summer months, rendering the estuary unsafe for recreation. Faecal bacteria, originating from the Motherwell Canal, contaminated the middle reaches of the estuary, whereas the Swartkops River has intermediate effects because bacteria die off between the point of release from the WWTWs and the riverine reaches and the tidal limit of the estuary. Trace metal data for the water column suggested that copper, zinc, iron and cadmium concentrations have increased by at least 90% in the estuary, at the tidal limit of the estuary and in the Markman and Motherwell canals (Pretorius, 2015). Other recent studies have shown that macrophytes (Phragmites australis, Typha capensis and Spartina maritima) and sediments from the Markman and Motherwell canals had significantly higher concentrations of lead and zinc than those measured in the main channel of the estuary (Phillips et al., 2015). Biomagnification has resulted in high concentrations of arsenic, lead, mercury and cadmium in the juvenile stages of popular angling fishes, exceeding international food quality guidelines (Nel et al., 2015). These results show the necessity for management interventions with the main objective being to protect the estuary's ecological, recreational and economic functions.
MATERIALS AND METHODS
Sampling sites
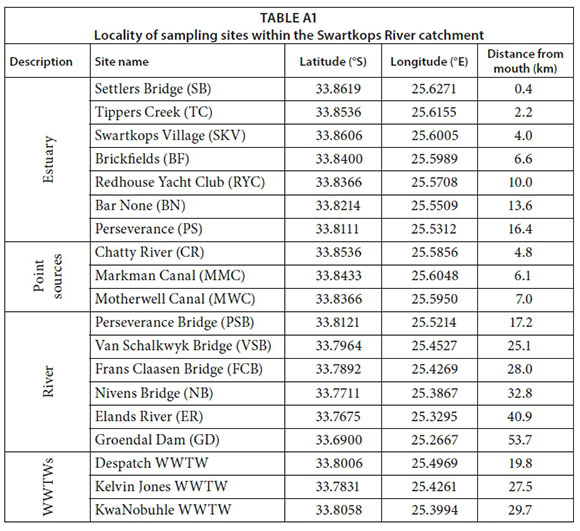
River, estuary and point source sites were measured, as well as the sea. Nineteen sites, which form part of the long-term monitoring stations of the South African Department of Water and Sanitation (DWS), were selected for spatial and temporal analyses of water quality data (Fig. 1 and Table A1). Water samples were collected at 3 point-sources into the estuary, namely Chatty River, Markman Canal and Motherwell Canal, and then assessed for their impact on 7 sites within the estuary, namely Settlers Bridge, Tippers Creek, Swartkops Village, Brickfields, Redhouse Yacht Club, Bar None and Perseverance.
The Chatty River (CR) flows through the highly populated townships of Zwide, Veeplaas, New Brighton, Bethelsdorp and Missionvale, from where the river receives polluted stormwater runoff and the discharge of raw sewage and litter. The Markman Canal (MMC) enters the Swartkops Estuary approximately 6.1 km from the estuary mouth. An industrial area is located on its northern bank from where numerous stormwater drains discharge effluent into the canal. The canal passes through a small peri-urban village before entering the Swartkops Estuary near a road bridge. The quality of the water in the canal is also affected by two sewage pump stations that regularly malfunction and divert untreated domestic sewage and industrial wastewater into the canal (Rump, 2012). The Motherwell Township is located along the length of the 4.2 km long Motherwell Canal (MWC) that is serviced by a network of 14 stormwater drains that transport litter, debris and raw sewage into the canal. During moderate and high flows, litter and human waste are carried to the estuary via the canal. Even during dry weather, a steady flow of polluted water is observed in the canal. Although litter traps are located at regular intervals in the canal they are frequently full or subject to vandalism. Illegal dumping takes place in this canal as well as in the canals of the Uitenhage area upstream. February 2010 marked the opening of the innovative Motherwell Canal Artificial Wetland System (SRK Consulting (Pty) Ltd, 2011). The wetland was designed to divert and filter 20% of polluted urban runoff from the stormwater canal through a series of ponds prior to release into the estuary.
Perseverance (PS), at the tidal head of the estuary, is characterised by shallow waters. It is downstream of Deranco Blocks, manufacturers of pre-cast concrete products, and the Perseverance and Karoo Ochse abattoirs. An abandoned gravel quarry is located close to the site. Free-floating invasive aquatic plants occur from the tidal limit to the lower reaches of the Bar None area of the estuary. Dominant species were Eichhornia crassipes (water hyacinth), Azolla filiculoides (water fern) and Salvinia molesta (Kariba weed). Pulses in river flow transport these floating macrophytes into the estuary. However, they cannot survive the saline estuary conditions.
The Perseverance Bridge (PSB) is situated approximately 2.6 km downstream of the Despatch WWTW and is positioned alongside a gravel quarry. The Van Schalkwyk Bridge (VSB) is located within the residential area of Despatch and downstream of the Kelvin Jones WWTW. The Frans Claasen Bridge (FCB) is located downstream of the Brak River confluence, near the Volkswagen manufacturing plant. The KwaNobuhle WWTW discharges via maturation ponds into the Brak River, which also collects stormwater runoff from surrounding townships (MacKay, 1994). The Nivens Bridge (NB) is situated approximately 300 m downstream from where the Kat Canal joins the river, carrying stormwater from Rosedale and McNaughton Townships. The Swartkops River flow is gauged by DWS Weir M1H012 at this site, and historical data from this site were used in this study. Approximately 56% of the treated sewage from the three WWTWs enters the river, contributing about 50% of the flow in the Swartkops Estuary (DWAF, 1999).
Flow, rainfall, tides
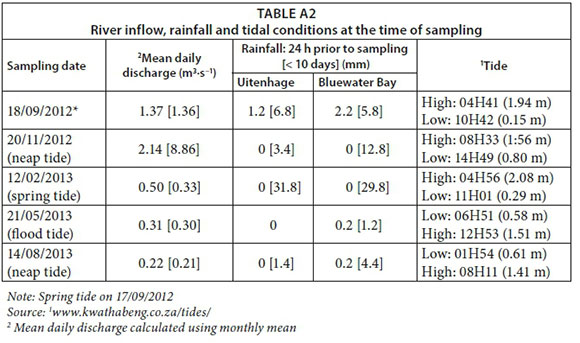
Sampling dates, river inflow, rainfall and tidal conditions are shown in Table A2. Swartkops River flow data were obtained from DWS and mean rainfall for the area was collated from the South African Weather Service daily data recorded at a rain gauge in Uitenhage (33.7140°S, 25.4350°E). The ecological health of estuaries is strongly influenced by the quality and quantity of freshwater inflow, so flow gauging closer to the head of an estuary would better quantify inflow. The nearest flow gauge is the abovementioned weir at Nivens Bridge, nearly 10 km from the head of the estuary. There is little correlation between measured flow and variables in the Swartkops Estuary, as a result of urban wastewater and runoff entering the river downstream of Nivens Bridge via tributaries, stormwater canals and the three WWTWs.
This study used river flow data to investigate the relationship between flow and inorganic nutrient levels of the river. Historical nutrient data recorded at Nivens Bridge by the DWS during the period 1995 to 2013 were related to river inflow data, also recorded at Nivens Bridge. Data were obtained from DWS (DWA, 2012). In addition to this, nutrient loads from WWTWs were assessed in terms of daily nutrient loads (kgd−1) discharged from each sewage plant, including the minimum and maximum ranges recorded from 2009 to 2013, and thereafter related to nutrient concentrations recorded in the river and estuary. Historical water quality data for the WWTWs were obtained from the DWS.
Sampling and analyses
Historical data on physico-chemical parameters were collated from Emmerson (1985), Scharler et al. (1997), DWAF (1999) and SRK Consulting (Pty) Ltd (2011). Subsequently, the river and estuary were sampled in September and November 2012, February, May and August 2013, to understand the spatial and temporal characteristics of the system and to identify sources of nutrients and other inputs to the estuary. Temperature (°C), salinity and dissolved oxygen (DO, mg·L−1) were measured in situ at each estuarine and point-source site at 0.5 m depth intervals until the bottom was reached, using a 650 MDS YSI Multiprobe. Water samples for nutrient and phytoplankton analyses were collected from the surface and bottom at sites using a weighted pop-bottle where depth exceeded 0.5 m. Samples were kept frozen until analyses commenced at the Nelson Mandela University. Water column chlorophyll a was determined as an indicator of phytoplankton biomass using the spectrophotometric methods of Nusch (1980) and Hilmer (1990). Phytoplankton chlorophyll a concentration that exceeds 20 μg chl a·L−1 is used as a threshold of potential concern in this study, indicating the presence of a phytoplankton bloom (Snow, 2016). Ammonium (NH4+-N) and soluble reactive phosphorus (SRP-P) were measured using standard spectrophotometric methods (Parsons et al., 1984). Oxidised nitrogen (NOx-N; NO2- + NO3-) was determined using the reduced copper-cadmium method (Bate and Heelas, 1975). Dissolved inorganic nitrogen (DIN; oxidised nitrogen and ammonium) and dissolved inorganic phosphorus (DIP; soluble reactive phosphorus) were expressed as mg N·L−1 and mg P·L−1, respectively, for comparison with river and historical data.
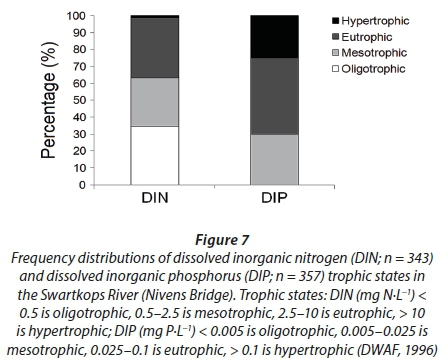
To determine the suitability of the water for a particular use, the water quality parameters were compared against the target water quality ranges (TWQR) in the South African Water Quality Guidelines (DWAF, 1996). These TWQRs provide thresholds of potential concern that are suitable for the management of the Swartkops River and Estuary. Additionally, the pelagic component (i.e. DO, DIN, DIP and phytoplankton biomass) of a recently proposed estuarine eutrophic condition index (Lemley et al., 2015) was applied to assess the state of the Swartkops Estuary on each sampling occasion. Finally, historical nutrient data for the freshwater site located in the Swartkops River (i.e. Nivens Bridge) were used to determine the frequency distributions of DIN and DIP concentrations, and presented as the percentage of values representing the various trophic levels, as described by DWAF (1996), throughout the monitoring period.
Statistical analysis
Water quality data from the different sites were collated and analysed for spatial and temporal trends. Data were tested for normality using the Kolmogorov-Smirnov test for normality. If the test result was negative, then a Johnson Transformation was performed to normalise the data. Levene's test for homogeneity of variance, with a confidence interval of 95%, was used to test the equality of variance across variables. Analysis of variance (ANOVA) was used to test the null hypothesis (H0) that there were no significant differences between estuary sampling sessions, sites and depths. Spearman rank correlation was used to determine relationships between all physico-chemical parameters. To assess the association of the different variables with the sampled sites, Simple Correspondence Analysis was conducted. These analyses were conducted using the Minitab Version 16 statistical package (Minitab Inc., PA).
RESULTS
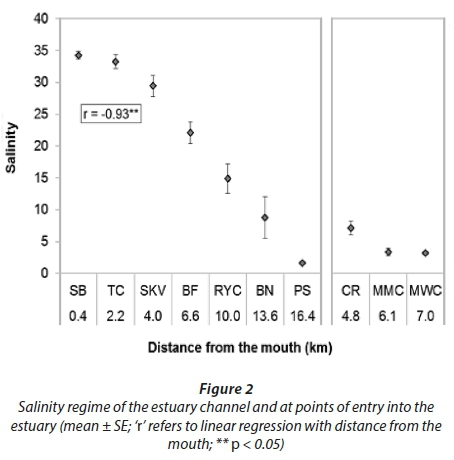
In 2012/2013 the salinity distribution in the estuary was typical of a permanently open estuary that receives a consistent base flow of river water; strong longitudinal salinity gradient from near-marine salinity at the mouth of the estuary (Settlers Bridge) to fresh at the head of the estuary (Perseverance). The salinity ranged from 35.5 at the mouth to 1.2 at the tidal limit, with marine intrusion occurring 13.6 km upstream (Fig. 2). The highest average salinities in the estuary were measured in August and May 2013 and the lowest in November 2012. The vertical salinity gradient, the difference in salinity between surface and bottom water, never exceeded 10 at any site. There were significant differences between estuary main channel sites and point sources which were fresher (F = 38.31; p < 0.05; n = 50). However, these inputs from the Motherwell and Markman canals and the Chatty River to the middle reaches of the estuary were not large enough to cause localised decreases in water column salinity. Surface and bottom differences in salinity were greater (0-7.9) than previously reported (1-2) (Emmerson, 1985; Scharler et al., 1997).
The lowest mean monthly temperature for the estuary water was recorded in August (14.4 ± 0.20°C) and the highest in February 2013 (25.2 ± 0.54°C). There was significant spatial (F = 3.17; p < 0.05; n = 35) and temporal (F = 115.03; p < 0.05; n = 35) variability, with an inverse relationship with salinity (r = −0.39; n = 60; p < 0.05). Dissolved oxygen (DO) concentrations ranged from 1.3 to 18.2 mg·L−1 (7.2 ± 0.43 mg·L−1; n = 60), with notable vertical patterns. The supersaturated DO conditions (18.2 mg·L−1) were recorded in the middle of a dense phytoplankton bloom. Mean DO levels were highest in November 2012 (9.4 ± 1.26 mg·L−1) and lowest in May 2013 (5.4 ± 0.57 mg·L−1), and were generally elevated between Redhouse Yacht Club and Perseverance but were lower at Tippers Creek. Hypoxic conditions (DO < 3.0 mg·L−1) were observed in February 2013 at Brickfields (2.7 mg·L−1) and Bar None (1.3 mg·L−1), and in May 2013 at Bar None (1.9 mg·L−1). Historically the water in the Swartkops Estuary has been well oxygenated with very few instances of hypoxic conditions being measured in bottom water.
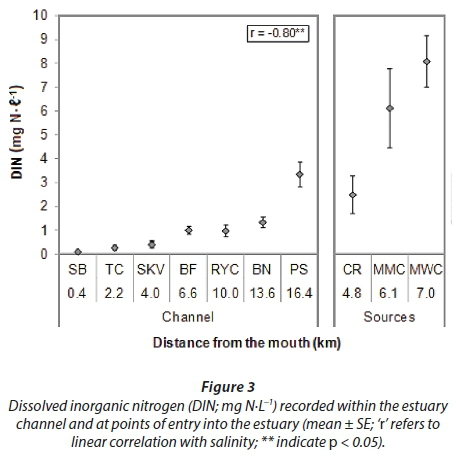
There were temporal and spatial variations in DIN concentrations, with a persistent longitudinal gradient (r = 0.81; p < 0.05; n = 59) from the mouth to the tidal limit at Perseverance (Fig. 3). Average surface DIN concentrations ranged from 0.11 mg N·L−1 at Settlers Bridge to 3.35 mg N·L−1 at Perseverance. Concentrations were highest in the Motherwell Canal (8.09 ± 1.09 mg N·L−1), followed by the Markman Canal (6.13 ± 1.67 mg N·L−1), Perseverance (3.35 ± 0.53 mg N·L−1) and Chatty River (2.50 ± 0.79 mg N·L−1). Water quality was generally mesotrophic or eutrophic (Table 1), 0.5-10 mg N·L−1, from the middle to upper reaches of the estuary (i.e. from Brickfields to Perseverance), although in September 2012 and May 2013, DIN levels downstream of Brickfields also exceeded DIN guidelines.
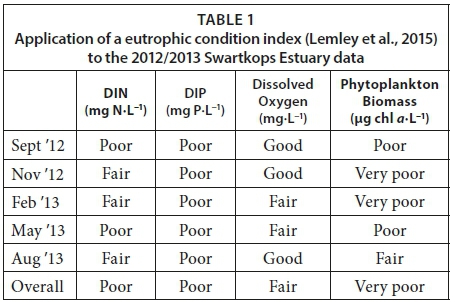
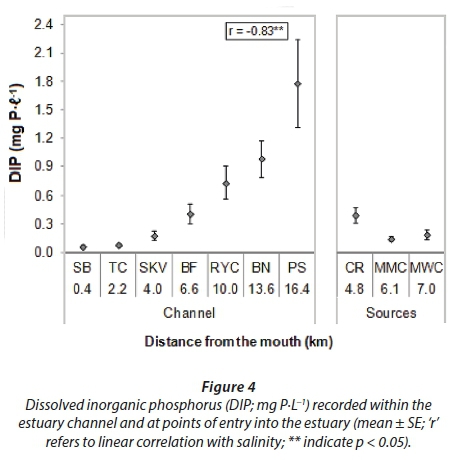
Past studies have indicated that soluble reactive phosphorus (SRP), also referred to as dissolved inorganic phosphorus (DIP), increased in concentration from the mouth to the upper reaches (Table 2). During the present study, the average concentrations ranged from 0.06 mg P·L−1 at Settlers Bridge to 1.25 mg P·L−1 at Perseverance (Fig. 4). DIP increased significantly (r = 0.89; p < 0.05) with distance from the mouth. Average concentrations in the Chatty River (0.40 mg P·L−1), Markman (0.14 mg P·L−1) and Motherwell canals (0.19 mg P·L−1) indicate the Swartkops River to be the primary source of SRP to the estuary. Historical data as well as that from this study (Table 1) show that all mean DIP levels measured along the longitudinal axis of the estuary from the lower to the upper reaches of the estuary were characteristic of eutrophic conditions; > 0.1 mg P·L−1 (Lemley et al., 2015).
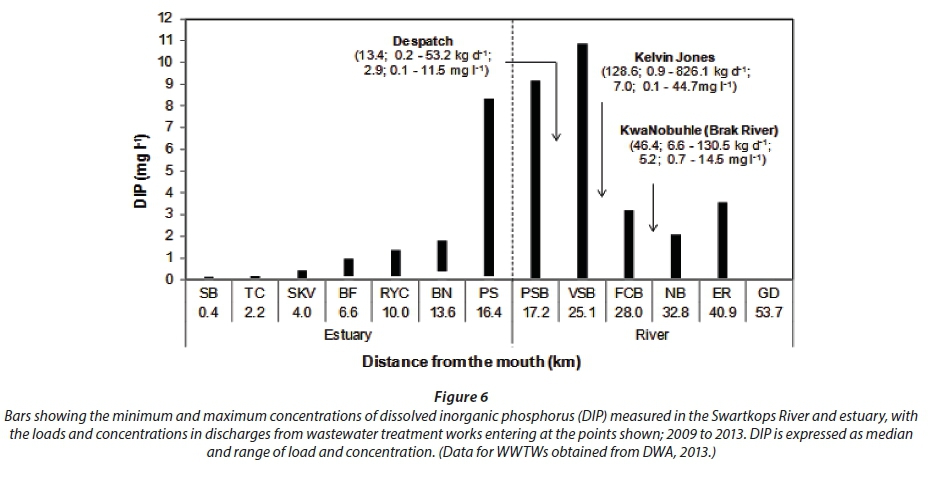
To identify the source of inorganic nutrients in the Swartkops Estuary, DIN (Fig. 5) and DIP (Fig. 6) loads discharged from WWTWs, calculated according to Lemley et al. (2014), between 2009 and 2013 were examined and related to concentrations measured in the river and estuary. DIN concentrations increased steadily from the mouth of the estuary to the tidal limit. DIN ranges at the fresh river sites were higher than those recorded within the estuary. The results indicated that DIN was elevated at sites near WWTWs. The highest DIN concentrations were measured at Van Schalkwyk Bridge, which is located downstream of the Kelvin Jones WWTW discharge site. Using the median DIN concentrations measured from 2009 to 2013, the estimated daily load for each of the WWTWs ranged from 35.5 to 170.0 kg N·d−1. The highest median daily load was discharged from the KwaNobuhle WWTW (170.0 kg N·d−1; 16.0-622.4 kg N·d−1), followed by Kelvin Jones (152.6 kg N·d−1; 28.5-1 167.9 kg N·d−1) and then Despatch (35.5 kg N·d−1; 7.4-81.1 kg N·d−1).
At the freshwater monitoring sites DIP ranges were highest at the Van Schalkwyk Bridge followed by Perseverance Bridge and Elands River. Furthermore, data showed that the daily DIP load determined for each of the WWTWs ranged from 13.4 to 128.6 kg P·d−1 and that the highest median daily load was discharged from the Kelvin Jones WWTW (128.6 kg P·d−1; .9-826.1 kg P·d−1), followed by KwaNobuhle (46.4; 6.6-130.5 kg P·d−1), and then Despatch (13.4 kg P·d−1; 0.2-53.2 kg P·d−1).
Historical data (Fig. 7) recorded by the Department of Water Affairs at Nivens Bridge from 1995 to 2013 showed that 47% of the 343 DIN measurements were classified as oligotrophic (< 0.5 kg N·d−1), 39% mesotrophic (0.5-2.5 kg N·d−1), 14% eutrophic (2.5-10 kg N·d−1) and 0.6% hypertrophic (> 10 kg N·d−1). None of the 357 DIP measurements were oligotrophic (< 0.005 kg P·d−1), 30% were mesotrophic (0.005-0.025 kg P·d−1), 45% were eutrophic (0.025-0.1 kg P·d−1), and 25% were hypertrophic (> 0.1 kg P·d−1).
There were no apparent effects of tidal stage and flow regime on chlorophyll a in the estuary, since the highest concentrations were recorded on a neap flood tide and also on a spring ebb tide, with flow discharges of 2.14 and 0.50 m3·s−1, respectively. Phytoplankton chlorophyll a increased with distance from the mouth of the estuary in 2012-2013 (Fig. 8). Average chlorophyll a was 31.8 ± 6.56 µg chl a·L−1, ranging from 0 to 248.7 µg chl a·L−1. Chlorophyll a levels were highest in November 2012 (58.3 ± 25.23 µg chl a·L−1) on a neap tide, and lowest in August 2013 (9.2 ± 4.10 µg chl a·L−1), also on a neap tide.
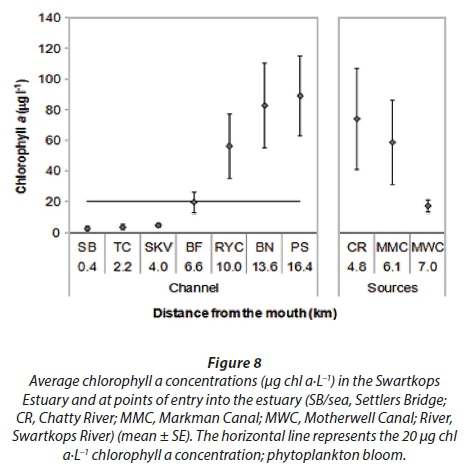
For the point-source sites the highest mean chlorophyll a concentration was measured in the river inflow water at Perseverance and the lowest concentrations were measured at the mouth of the estuary. The present study has shown that the high nutrient concentrations are consistently supporting a phytoplankton biomass of bloom concentrations (> 20 µg chl a·L−1) from the middle to upper reaches of the estuary. Chlorophyll a concentration showed a positive correlation with DIN (r = 0.57; p < 0.05) and DIP (r = 0.67; p < 0.05), and a negative correlation with salinity (r = -0.83; p < 0.05; n = 60).
DISCUSSION
This study investigated the spatial and temporal variability of physico-chemical parameters and phytoplankton biomass of the Swartkops Estuary and compared these data with past studies. The results show deterioration of water quality in this urbanised estuary, and an ecosystem under long-term stress from anthropogenic inputs. Evidence suggests that water is not flushed as efficiently from the upper estuary as was previously the case, and that the natural hydrology of the estuary has been modified. There is reduced vertical mixing and stratification occurs with a persistent salt wedge structure in the estuary. A possible cause is the increase in low-salinity water from the WWTWs. The discharge exceeds design capacity at the Kelvin Jones, Despatch and KwaNobuhle WWTWs (75 ML·d−1, 77 ML·d−1 and 79 ML·d−1 respectively; DWA, 2009). Increased stratification, water retention and high nutrient loads favour phytoplankton blooms (Lemley et al., 2015), thus encouraging eutrophic conditions that are now persistent in the estuary.
Eutrophication is 'the enrichment of water by nutrients causing an accelerated growth of algae and higher forms of plant life to produce an undesirable disturbance to the balance of organisms present in the water and to the quality of the water concerned' (OSPAR, 2003 p. 28). It is accompanied by increased phytoplankton biomass, changes in community composition, de-oxygenation of the water column and the possible proliferation of harmful or toxic species (Officer and Ryther, 1980; Smayda, 1990). The latter requires further investigation in the Swartkops Estuary. However, the propensity for reduced dissolved oxygen concentrations (i.e. hypoxia) in the middle to upper reaches of the Swartkops Estuary is thus further evidence of eutrophication. Furthermore, strong longitudinal gradients of nutrients exist, with DIN and DIP concentrations increasing with distance from the estuary mouth. Such distribution profiles are indicative of anthropogenic nutrient loading from the catchment as the primary nutrient source. These findings were consistent with those of De Villiers and Thiart (2007), where a pronounced increase in DIN and DIP in the Swartkops River was reported, leading the authors to describing it as one of the most threatened freshwater systems in South Africa.
The middle to upper reaches of the estuary are persistently eutrophic, with blooms of phytoplankton (using chlorophyll a as an index of biomass of > 20 µg chl a·L−1) occurring in response to nutrient input. Elevated concentrations of inorganic nutrients caused high phytoplankton biomass; ranging from 0 to 248 µg chl a·L−1 (31.8 ± 6.56 µg chl a·L−1). This is consistent with findings of several authors who have shown that nutrients enhance phytoplankton and algal production in general (Fong et al., 1993; Anderson et al., 2002; Borja et al., 2012). This is particularly true of estuaries subject to daily WWTW inputs, as observed by Thomas et al. (2005) in two South African temporarily open/closed estuaries. The nutrient-driven 'bloom-decay' cycle of algae will result in increased DO production during the growth phase of phytoplankton blooms and a decline during the decay phase (Biswas et al., 2009; O'Boyle et al., 2016; Lemley et al., 2018). This was consistent with findings for the Swartkops Estuary, where hypoxic conditions were recorded in the upper reaches of the estuary on two occasions.
The eutrophication of estuaries caused by human-induced nutrient enrichment is a global environmental concern because of the ecological and economic value of these ecosystems (Cloern et al., 2016). Eutrophication in South Africa appears to be increasing with persistent phytoplankton blooms being reported in a number of other estuaries (Snow et al., 2000; Kotsedi et al., 2012; Kaselowski and Adams, 2013; Lemley et al., 2018). By applying the pelagic component of a eutrophic condition index, proposed by Lemley et al. (2015), the eutrophic condition of the Swartkops Estuary could be assessed (Table 1). Except for dissolved oxygen levels, all the parameters (DIN, DIP and phytoplankton biomass) were classified as being in an overall 'Poor' or 'Very Poor' state, thus indicating the eutrophic or hypertrophic nature of the system. With regards to dissolved oxygen, localised hypoxic conditions were frequently measured in bottom waters in the upper reaches of the estuary. However, the eutrophic condition index rated the entire estuary as 'Good' or 'Fair'. This is most likely because surface waters were super-saturated with oxygen produced by blooms of phytoplankton at the time of sampling and the lower reaches of the estuary were well oxygenated via tidal flushing. The temporal scale at which in-situ estuary monitoring was undertaken in this study is appropriate for achieving a reliable assessment of eutrophic condition using this method. With regards to effective management, this further emphasises the value of continuous monitoring.
Water quality data (1995 to 2013) for the river showed that 52% of DIN measurements were classified as either mesotrophic or eutrophic and all DIP measurements exceeded the guideline value of 0.05 mg P·L−1 (DWAF, 1996). WWTWs within the Swartkops catchment are a major source of nutrients, which have promoted the growth of water hyacinth (Eichhornia crassipes) and other invasive aquatic plants in the river between Uitenhage and Perseverance. High levels of DIP in the river are attributed to the sewage discharges from KwaNobuhle, Uitenhage and Despatch, which are major residential and industrial areas. The released effluent is poorly monitored for acceptable nutrient levels and has been shown to exceed standards (DWAF, 2009), which results in the transport of high loads of nutrients into the estuary. Another concern is the possible future occurrence of harmful algal bloom (HAB) species in the estuary which would likely cause further ecological changes and influence human health. The toxic dinoflagellate, Lingulodinium polyedra, was recorded in Algoa Bay and the Swartkops Estuary when it formed extensive red tides in the summer of 2013/2014. Although in this instance the HAB was allochthonous in nature, not proliferating from within the estuary, the possibility of future autochthonous HABs is a concern because they pose a health risk and are difficult/expensive to control.
In addition to nutrient inputs from the WWTWs, nutrient inputs from the Motherwell and Markman canals and the Chatty River are also significant. The Motherwell Canal has been a major source of nitrogen (generally in the form of ammonium) to the estuary, while the Swartkops River is the primary source of phosphorus to the estuary because of the upstream WWTWs. The DIN:DIP ratio averaged 56.8 ± ١٤.٨ (± SE) in the Motherwell Canal for the study period, compared to 2.3 ± ٠.٤ measured near the head of the estuary at Perseverance. Elevated nutrient concentrations were observed during both high and low flow conditions so cannot be linked to freshwater input from the Swartkops River alone. This is consistent with findings from previous studies which showed that these canals contributed nutrients to the estuary (Hilmer, 1984; Emmerson, 1985; MacKay, 1993; Scharler et al., 1997). Furthermore, DIN concentrations recorded in both canals were higher than all other sites measured.
These results provide valuable information for management of the Swartkops catchment and estuary. Given the economic, ecological and recreational importance of the Swartkops River and estuary, Van Niekerk et al. (2014) envisaged a recommended ecological category of 'C' for the estuary. However, the current results show that estuary health will continue to deteriorate if a 'business as usual' scenario continues. Changes in the estuary and catchment have caused an extensive loss of natural habitat, biota and ecosystem functioning. Management interventions are needed to improve estuary health so that the system can continue to provide important ecosystem services (Table 3). This can be done through better management of sewage systems; use of artificial wetlands prior to wastewater discharge, reduction in the use and discharge of phosphates, and improvement of stormwater systems so that they do not divert into sewers. The pilot artificial wetland that was constructed to divert and filter 20% of the run-off from the Motherwell Canal is operational but requires continual maintenance, such as cutting back the wetland plants in order to maintain optimum functionality.
CONCLUSION
Continuous data are important for understanding changes in water quality in estuaries. Ideally water quality monitoring should be aligned with the objectives of simple mass balance models, or more complex ecosystem modelling. A mass balance approach will identify the sources, sinks and export of variables (N, P and heavy metals). From the results, predictions can be made to help managers take the most cost-effective action. A numerical model can be used for investigating mitigation scenarios, to improve conditions in the system (i.e. how much do we need to reduce waste loading to meet environmental objectives; Prof. S Taljaard, pers. comm. 2015). A comprehensive Department of Water and Sanitation (DWS) ecological water requirement study is needed for the Swartkops Estuary so that Water Resource Quality Objectives can be identified. The detailed water quality data for 2012/2013 reported here have contributed to the required assessment by illustrating the persistently eutrophic condition in which the Swartkops Estuary currently resides. A comprehensive Reserve study can only proceed once there are flow data available for river inflow to the estuary at Perseverance. For this reason, a flow gauge must be installed. This could be a low-flow weir with a fishway and could also be used as a DWS water quality monitoring site.
Improved wastewater treatment at the three WWTWs and management of urban runoff into the Motherwell Canal are likely to reduce the intensity and frequency of phytoplankton blooms and the health risks. When the Nelson Mandela Bay Municipality finishes implementing the applicable management plans, such as the Water Services Development Plan, the Water Management Systems Plan, Sewer Management Systems, Water Master Plan and the Sewer Master plan, we expect a measurable reduction in the pollution of the Swartkops Estuary. Furthermore, a healthy estuary state can only be attained and maintained if management decisions are based on up-to-date, reliable and quantitative data. For this reason, a long-term monitoring programme is necessary to continuously evaluate the effectiveness of management actions in improving the health of the estuary.
ACKNOWLEDGEMENTS
This study was funded by the Department of Water and Sanitation (DWS) through the Nelson Mandela Bay Municipality. We thank the project steering committee for their inputs. The study compared present-day conditions with historical water quality data collated from DWS and also from environmental consultancy reports, and past academic research studies. These data sources are acknowledged.
Prof Guy Bate, Prof Susan Taljaard, Dr Pascal Tabot and Dr Daniel Lemley are thanked for their insightful comments and valuable input. Mrs Jenny Rump from the Zwartkops Conservancy is thanked for the time spent in the field and the informative discussions. We also thank Dr Mike Silberbauer from the DWS for his assistance with the historical water quality data and Marica Erasmus and Cobus Ferreira, also from the DWS, for providing us with data.
REFERENCES
ANDERSON DM, GILBERT PM and BURKHOLDER JM (2002) Harmful algal blooms and eutrophication nutrient sources, composition, and consequences. Estuaries 25 704-726. https://doi.org/10.1007/BF02804901 [ Links ]
BAIRD D, HANEKOM NM and GRINDLEY JR (1986) Estuaries of the Cape. Part II. Synopses of available information on individual systems - Report No. 23 Report Swartkops (CSE3). CSIR Research Report No. 422. CSIR, Stellenbosch. [ Links ]
BATE GC and HEELAS BV (1975) Studies on the nitrate nutrition of two indigenous Rhodesian grasses. J. Appl. Ecol. 12 941-952. https://doi.org/10.2307/2402100 [ Links ]
BISWAS H, DEY M, GANGULY D, DE TK, GHOSH S and JANA TP (2009) Comparative analysis of phytoplankton composition and abundance over a two-decade period at the land-ocean boundary of a tropical mangrove ecosystem. Estuar. Coasts 33 384-394. https://doi.org/10.1007/s12237-009-9193-5 [ Links ]
BORJA A, BASSET A, BRICKER S, DAUVIN J, ELLIOT M, HARRISON T, MARQUES J, WEISBERG S and WEST R (2012) Classifying ecological quality and integrity of estuaries. In: Wolanski E and McLusky D (eds) Treatise on Estuarine and Coastal Science. Academic Press, Waltham. [ Links ]
COLLOTY BM, ADAMS JB and BATE GC (2000) The use of a botanical importance rating to assess changes in the flora of the Swartkops Estuary over time. Water SA 26 (2) 171-180. [ Links ]
CLOERN JE, ABREU PC, CARSTENSEN J, CHAUVAUD L, ELMGREN R, GRALL J, GREENING H, JOHANSSON JOR, KAHRU M, SHERWOOD ET, XU J and YIN K (2016). Human activities and climate variability drive fast-paced change across the world's estuarine-coastal ecosystems. Glob. Change Biol. 22 513-529. https://doi.org/10.1111/gcb.13059 [ Links ]
DE VILLIERS S and THIART C (2007) The nutrient status of South African rivers: concentrations, trends and fluxes from the 1970s to 2005. S. Afr. J. Sci. 103 343-351. [ Links ]
DWA (Department of Water Affairs, South Africa) (2009) Municipal wastewater treatment base information for targeted risk-based regulations. Executive summary. Eastern Cape. DWA, Pretoria. [ Links ]
DWA (Department of Water Affairs, South Africa) (2012) Water quality sites in the "M" drainage region. URL: http://www.dwa.gov.za/iwqs/wms/data/M_reg_WMS_nobor.htm (Accessed 4 April 2016) [ Links ]
DWAF (Department of Water Affairs and Forestry, South Africa) (1996) South African Water Quality Guidelines. Volume 7: Aquatic Ecosystems. DWAF, Pretoria. [ Links ]
DWAF (Department of Water Affairs and Forestry, South Africa) (1999) Zwartkops River water resources management plan: Situation assessment and development of a catchment water quality monitoring programme. DWAF Draft Report No. N/M100/REQ/0896. DWAF, Pretoria. [ Links ]
DWAF (Department of Water Affairs and Forestry, South Africa) (2009) Municipal wastewater treatment base information for targeted risk-based regulations. Executive summary. Eastern Cape, Status at June 2009. DWAF, Pretoria. [ Links ]
EMMERSON WD (1985) The nutrient status of the Swartkops River estuary, Eastern Cape. Water SA 11 189-198. [ Links ]
ENVIRO-FISH AFRICA (Pty) Ltd (2011) Integrated Management Plan: Swartkops Estuary and the Swartkops River Valley and Aloes Nature Reserves, Volume II, Final Report. Report prepared for the C.A.P.E. Estuaries Management Programme. Enviro-Fish Africa, Grahamstown. [ Links ]
FONG P, ZEDLER JB and DONOHOE RM (1993) Nitrogen vs. phosphorus limitation of algal biomass in shallow coastal lagoons. Limnol. Oceanogr. 38 906-923. https://doi.org/10.4319/lo.1993.38.5.0906 [ Links ]
HILMER T (1984) The primary production of different phytoplankton size fractions in the Swartkops Estuary. MSc thesis, University of Port Elizabeth, South Africa. [ Links ]
HILMER T (1990) Factors influencing the estimation of primary production in small estuaries. PhD thesis, University of Port Elizabeth, South Africa. [ Links ]
KASELOWSKI T and ADAMS JB (2013) Not so pristine - characterising the physico-chemical conditions of an undescribed temporarily open/closed estuary. Water SA 39 (5) 627-636. https://doi.org/10.4314/wsa.v39i5.6 [ Links ]
KOTSEDI D, ADAMS JB and SNOW GC (2012) The response of microalgal biomass and community composition to environmental factors in the Sundays Estuary. Water SA 38 (2) 177-189. https://doi.org/10.4314/wsa.v38i2.3 [ Links ]
LEMLEY DA, TALJAARD S, ADAMS JB, and STRYDOM N (2014) Nutrient characterisation of river inflow into the estuaries of the Gouritz Water Management Area, South Africa. Water SA 40 687-698. https://doi.org/10.4314/wsa.v40i4.14 [ Links ]
LEMLEY DA, ADAMS JB, TALJAARD S and STRYDOM NA (2015) Towards the classification of eutrophic conditions in estuaries. Estuar. Coast. Shelf Sci. 164 221-232. https://doi.org/10.1016/j.ecss.2015.07.033 [ Links ]
LEMLEY DA, ADAMS JB and STRYDOM NA (2017) Testing the efficacy of an estuarine eutrophic condition index: Does it account for shifts in flow conditions? Ecol. Indic. 74 357-370. https://doi.org/10.1016/j.ecolind.2016.11.034 [ Links ]
LEMLEY DA, ADAMS JB and STRYDOM NA (2018) Triggers of phytoplankton bloom dynamics in permanently eutrophic waters of a South African estuary. Afr. J. Aquat. Sci. 43 229-240. https://doi.org/10.2989/16085914.2018.1478794 [ Links ]
MACKAY HM (1993) The impact of urban runoff on the water quality of the Swartkops estuary: Implications for water quality management. WRC Report No. 324/1/93. Water Research Commission, Pretoria. [ Links ]
MACKAY HM (1994) Management of water quality in an urban estuary. PhD thesis, University of Port Elizabeth, South Africa. [ Links ]
NEL L, STRYDOM NA and BOUWMAN H (2015) Preliminary assessment of contaminants in the sediment and organisms of the Swartkops Estuary, South Africa. Mar. Pollut. Bull. 101 878-885. https://doi.org/10.1016/j.marpolbul.2015.11.015 [ Links ]
NUSCH EA (1980) Comparison of different methods for chlorophyll and phaeopigment determination. Arch. Hydrobiol. Beiheft Ergebnise Limnol. 14 14-36. [ Links ]
O'BOYLE S, MCDERMOTT G, SILKE J and CUSACK C (2016) Potential impact of an exceptional bloom of Karenia mikimotoi on dissolved oxygen levels in waters off western Ireland. Harmful Algae 53 77-85. https://doi.org/10.1016/j.hal.2015.11.014 [ Links ]
OFFICER CB and RYTHER JH (1980) The possible importance of silicon in marine eutrophication. Mar. Ecol. Prog. Ser. 3 83-91. https://doi.org/10.3354/meps003083 [ Links ]
OSPAR (2003) Strategies of the OSPAR commission for the protection of the marine environment of the north-east Atlantic (reference number: 2003e21). In: OSPAR Convention for the Protection of the Marine Environment of the Northeast Atlantic: Ministerial Meeting of the OSPAR Commission, Bremen, 25 June 2003, vol. Annex 31 (Ref. B-4.2). [ Links ]
PARSONS TR, MAITA Y and LALLI CM (1984) A Manual of Chemical and Biological Methods for Seawater Analysis. Pergamon Press, New York. [ Links ]
PHILLIPS DP, HUMAN LDR and ADAMS JB (2015) Wetland plants as indicators of heavy metal contamination. Mar. Pollut. Bull. 92 227-232. https://doi.org/10.1016/j.marpolbul.2014.12.038 [ Links ]
PRETORIUS LM (2015) Spatial and temporal variability in water quality characteristics of the Swartkops Estuary. MSc thesis, Nelson Mandela Metropolitan University, South Africa. [ Links ]
RUMP J (2012) Personal communication, 21 February 2012. Jenny Rump, Environmental Manager, Zwartkops Conservancy, P.O. Box 75, Swartkops, Eastern Cape Province, 6209, South Africa. [ Links ]
SCHARLER UM, BAIRD D and WINTER PED (1997) Diversity and productivity of biotic communities in relation to freshwater inputs in three Eastern Cape estuaries. WRC Report No. 463/1/98. Water Research Commission, Pretoria. [ Links ]
SMAYDA TJ (1990) Novel and nuisance phytoplankton blooms in the sea: evidence for a global epidemic. In: Granéli E, Sundstrom B, Edler L and Anderson DM (eds) Toxic Marine Phytoplankton. Elsevier, New York. 29-40. [ Links ]
SNOW GC (2016) Determining the health of river-dominated estuaries using microalgal biomass and community composition. S, Afr, J, Bot, 107 21-30. https://doi.org/10.1016/j.sajb.2016.02.201 [ Links ]
SRK CONSULTING (Pty) Ltd (2010) Design, construction, operation and effectiveness of a pilot artificial wetland system to remove stormwater and sewage pollutants entering the Swartkops River Estuary via the Motherwell Canal, Nelson Mandela Bay, South Africa. URL: http://www.srk.co.za/files/File/Southafrica/pressreleases/2013/March_2013/infrastructure_news_pilot_artificial_wetland_system_18_mar_2013.mht_.pdf (Accessed 11 September 2013). [ Links ]
SRK CONSULTING (Pty) Ltd (2011) Swartkops River full suite monitoring: draft monitoring report. Report prepared by SRK Consulting for the Nelson Mandela Bay Municipality, Report No. 428442. SRK Consulting, Port Elizabeth. [ Links ]
TALJAARD S (2015) Personal communication, 20 November 2015. Prof S Taljaard, CSIR, Stellenbosch, South Africa. [ Links ]
THOMAS CM, PERISSINOTTO R and KIBIRIGE I (2005) Phytoplankton biomass and size structure in two South African eutrophic, temporarily open/closed estuaries. Estuar. Coast. Shelf Sci.65 223-238. https://doi.org/10.1016/j.ecss.2005.05.015 [ Links ]
TURPIE JK, ADAMS JB, JOUBERT A, HARRISON TD, COLLOTY BM, MAREE RC, WHITFIELD AK, WOOLDRDIGE TH, LAMBERTH SJ, TALJAARD S and VAN NIEKERK L (2002) Assessment of the conservation priority status of South African estuaries for use in management and water allocation. Water SA 28 (2) 191-206. https://doi.org/10.4314/wsa.v28i2.4885 [ Links ]
UNEP/NAIROBI CONVENTION SECRETARIAT and CSIR (2009) Guidelines for the Establishment of Environmental Quality Objectives and Targets in the Coastal Zone of the Western Indian Ocean (WIO) Region. UNEP, Nairobi. 169 pp. [ Links ]
US EPA (United States Environmental Protection Agency) (2003) Protecting Water Quality from Urban Runoff. EPA Publication No. EPA 841-F-03-003. US EPA, Washington DC. [ Links ]
VAN NIEKERK L, TALJAARD S, ADAMS JB, FUNDISI D, HUIZINGA P, LAMBERTH SJ, MALLORY S, SNOW GC, TURPIE JK, WHITFIELD AK and WOOLDRIDGE TH (2014) Desktop Estuary EcoClassification and recommended health status of the temperate estuaries of South Africa. Draft CSIR Report to the Water Research Commission, WRC Project No. K5/2187. [ Links ]
WRC (Water Research Commission) (2013) Wastewater treatment: Drivers for wastewater technology selection. WRC Technical Brief. URL: http://www.wrc.org.za/Knowledge%20Hub%20Documents/Briefs/Briefs2013/TB_K8-952_Drivers%20for%20wastewater%20technology%20selection.pdf (Accessed 22 September 2013). [ Links ]
Received 22 January 2016
Accepted in revised form 12 December 2018
* To whom all correspondence should be addressed. e-mail: Janine.Adams@mandela.ac.za
APPENDIX

