


Servicios Personalizados
Articulo
 Inglés (pdf)
 Articulo en XML
 Referencias del artículo
Indicadores

Links relacionados
-
 Citado por Google
 -
 Similares en Google
Compartir

 Permalink
Water SA
versión On-line ISSN 1816-7950
versión impresa ISSN 0378-4738
Water SA vol.45 no.1 Pretoria ene. 2019
http://dx.doi.org/10.4314/wsa.v45i1.02
ORIGINAL ARTICLES
Influence of litter source on soil splash rates and organic carbon loss in different soil horizons
Cosmas ParwadaI, *; Johan Van TolI, II
IDepartment of Agronomy, University of Fort Hare, Alice, South Africa
IIDepartment of Soil-and Crop-and Climate Sciences, University of the Free State, Bloemfontein, South Africa
ABSTRACT
Organic litter stabilizes soil particles against the raindrop splash effect. To date, limited research has critically examined the effects of litter quality on soil aggregate detachment and soil organic carbon loss by raindrop splash impact. A study was conducted to determine the effects of different litter sources on quantity of splashed sediments and soil organic carbon (SOC) loss under simulated rainstorm patterns. Soils from seven sieved (< 0.25 mm) horizons mixed with either high-quality Vachellia karroo leaf (C/N = 23.8) and/or low-quality Zea mays stover litter (C/N = 37.4) were incubated in a laboratory for 30 weeks. Splashed sediments and SOC were measured at 1, 3, 8, 14, 23 and 30 weeks of incubation for each soil at 360 mm/h simulated rainfall intensity applied as either single 8-min rainstorm (SR) or 4 × 2-min intermittent rainstorms (IR) separated by a 72-h drying period. Organic litter significantly (P < 0.05) reduced the splashed sediments up to 8 and 14 weeks under IR and SR storms, respectively, and thereafter gradually lost its stabilizing effect on soil aggregates. In order to maintain low quantities of splashed sediments, fresh litter has to be re-applied after this stage. Generally, 13% and 25% more sediments were splashed under IR than SR at 1, 3 and 30, and 8, 14 and 23 weeks after incubation, respectively. Litter quality effect on splash sediments varied across soil horizons but were the same within a soil horizon. Soil horizons with more clay than sand particles had lower quantities of sediments. The SOC loss was influenced by the initial SOC content and primary particle size distribution. Rainstorm pattern and initial SOC content were the main factors that influenced SOC loss. However, more rainstorm patterns should be investigated for these soils.
Keywords: erosion, litter, particle, rainfall patterns, resistance, sediments
INTRODUCTION
Soil loss is a serious problem worldwide (Wolancho, 2012). Soil loss by water is the major form of soil erosion and consists of sequential events of particle detachment, entrainment, transport and deposition (Stern et al., 1991). Raindrops are erosive agents that initiate the movement of soil particles (Cheng et al., 2008). Soil splash by raindrop impact is the first event of soil erosion by water and supplies materials for subsequent transportation and entrainment (Nciizah and Wakindiki, 2014). Movement of weakly aggregated soil particles is influenced by splash process, and soil characteristics such as texture and organic matter (Wuddivira et al., 2009). One of the conservation methods against soil erosion is the use of soil conditioners such as organic matter (OM). Yu and Meng (2000) noted that soil properties, such as soil structure and OM content, affect soil erodibility. Addition of OM to soil can be very effective in preventing soil erosion (Center for Watershed Protection, 2001) because the OM improves soil surface aggregation, and hence can resist raindrop splash effects (Sur and Ghuman, 1994). Studies related to rain splash erosion have focused mostly on the relationships between soil surface cover and rainfall characteristics and less on the relationship between intrinsic soil properties and the rainfall characteristics (Ezeabasili et al., 2014). Cheng et al. (2008) noted that intensity is the most important rain factor and has tremendous effects on rain splash while Nciizah and Wakindiki (2014) observed that rainstorm pattern had pronounced effects on splash erosion. A soil that resists raindrop splash effects is considered to be more stable against erosion by water (Hozl et al., 2015).
Gao and Bao (2001) found linear relationships between amount of splashed sediments and the kinetic energy of rainfall, and also that the splashed sediment amount decreased with rainfall time. Rainfall of maximum intensity over a short period has the most significant effects on splash erosion (Jiang and Liu, 1989), though splash erosion also relates to soil properties. Gao and Bao (2001) found that the extent of soil particle detachment from the surface was associated with physical and chemical properties. Fan and Li (1993) concluded that soil particle distribution has a strong relation with splash erosion. However, the relationship between rain splash and soil properties was still unclear.
Splash erosion is a function of raindrop energy and the stability of aggregates which enables them to withstand the raindrop impact energy (Kukal and Sarkar, 2011). Therefore, the most effective conservative measures against splash erosion are the use of soil conditioners such as OM that enhance soil particle aggregation and physical barriers against raindrop impact (Sur and Ghuman, 1994). Organic matter has a significant effect on chemical and physical characteristics of soil and it is one of the essential components of soil quality assessment (Gregorich et al., 1994; Lal et al., 2004). Therefore, to preserve the quality of the soil, it is necessary to maintain a neutral or positive balance between the reduction of SOM by the addition of litter and dead animal material, and SOM loss by mineralization or by erosion (Lal et al., 2004). In many natural landscapes, erosion by water is the main agent redistributing SOM (Jacinthe et al., 2004) and, apart from mineralization, the depletion of SOM in soils has been related to the degree of soil erosion (Li et al., 2006). The loss of SOM as a result of water erosion reduces soil aggregation and stability. Many studies clearly report on the role of SOM in soil erodibility (Lal et al., 2004; Li et al., 2006) but are unclear on the effects of SOM quality on rain splash erosion in soils with different textures. Our study focused on splash erosion by collecting, in splash cups, the amount of splash generated after simulated rainfall events. The objectives of our study were to investigate the effects of rain splash in soils of contrasting texture amended with high quality Vachellia karroo leaf (C/N = 23.8) and low-quality Zea mays stover litter (C/N = 37.4) and to determine the organic carbon (OC) concentration in the splashed sediments.
METHODOLOGY
Description of the study area
A laboratory study was conducted at the University of Fort Hare, South Africa, using soils collected from the Ntabelanga area in the Eastern Cape Province of South Africa. Ntabelanga is located about 380 km south-east of the University of Fort Hare, between 31° 7′ 35.9″ S and 28° 40′ 30.6″ E. The Ntabelanga area falls in the sub-escarpment Grassland, and sub-escarpment Savanna Bioregions, South Eastern Uplands Aquatic Ecoregion and the Mzimvubu to Kieskamma Water Management Area (Mucina and Rutherford, 2006). The Ntabelanga area receives an annual rainfall of about 749 mm, with most of it failing in December and January. The lowest (15 mm) average rainfall is received in June and the highest (108 mm) in January. The area is underlain by sedimentary rocks (Tarkastad and Karoo subgroups) and post-Karoo doleritic intrusions. There are also traces of mudflake conglomerates (Van Tol et al., 2014). The sub-humid grasslands in the Ntabelanga area suffer from severe gully erosion, even in areas covered by dense grass (Sonneveld et al., 2005; Van Tol et al., 2014). The soils in the study area had wide variations in soil texture and clay mineralogy of the Eastern Cape Province, and were generally shown to be quartz > mica > kaolinite > Chl-verm > haematite, in order of dominance (Mandiringana et al., 2005). The area is characterized by highly unstable soils that are prone to erosion, as evidenced by extensive areas of severe gully erosion on the inter-fluvial areas adjacent to stream channels. The erosional and piping characteristics in Ntabelanga suggest the presence of dispersive agents in soils (DWA, 2013).
Soil sampling and laboratory analyses
Twenty-one soil samples were randomly selected from global positioning system (GPS) generated coordinates mapped on the area and representing existing areas of soil associations. The soil samples were taken according to naturally occurring soil horizons of the soil associations. Some of the sampling point were severely eroded and lacked the A-horizon and others were rocky just below the A- horizon. The sampled soils were then composited into 7 samples according to the existing areas of soil associations in the Ntabelanga area (Table 1). The naturally occurring soil horizons were orthic A, melanic A, pedocutanic B, red apedal B, prismacutanic B, G-horizon and saprolite (Table 1).
The soils were analysed for primary particle size distribution by the hydrometer method as described by Okalebo et al. (2000) and total SOC was determined through the wet acid digestion Walkley-Black method (Nelson and Sommers, 1996). Soil structural index (SI) was estimated according to Reynolds et al. (2007) as:
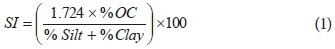
where OC is organic carbon.
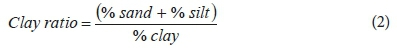
Clay ratio was calculated according to Singh and Khera (2008) using percentages of the particle sizes obtained per horizon as follows:
Laboratory soil incubation
To determine the effects of litter quality on soil loss by splash erosion, we conducted a soil incubation experiment with organic litter of different qualities. Soil from the seven horizons collected in the Ntabelanga area was air dried and passed through a 2 mm sieve. The soil was then pestled to destroy all macroaggregates (> 0.25 mm). After macroaggregate destruction, the samples were sieved (0.25 mm) and the bigger fractions (> 0.25 mm) were discarded. V. karroo leaf (C/N = 23.8) and low-quality Z. mays stover litter (C/N = 37.4) were used in the incubation. The plant materials were shredded and oven dried at 60°C. After drying, the litter was ground to pass through a 2-mm sieve. Subsamples of each ground litter type were taken and measured for total C and N contents. The N was determined by an automated wet chemistry analyzer, after a digestion with H2SO4 and Cu-KSO4 which converts all the organic nitrogen into NH4+-N.
The plant litters were then mixed with 600 g of soil at a rate of 2.28 g OM/100 g soil and 2.43 g OM/100 g soil for V. karroo leaves and Z. mays stover, respectively. The mixtures constituted at least 2% SOC (the threshold SOC content for aggregate stability) (Kay and Angers, 2000) since the average SOC of the seven horizons was 0.83% (Table 1). A control treatment with no litter amendment was included. The treatments were arranged as a 7 × 3 factorial laid in a completely randomized design (CRD) and triplicated. The amended soil was then put in 1 000-mL jars and incubated at 60% water-holding capacity and a temperature of 25°C for 30 weeks. The soil moisture levels in the jars were adjusted to 30% water-holding capacity for 2 days per week to create a dry condition during soil incubation.
A subsample (90 g) was taken from each jar and analysed for soil loss by splash erosion. The measurements were done at 1, 3, 8, 14, 23 and 30 weeks after incubation.
Measurement of splash erosion
Soil losses were measured by a rainfall simulator following a modified procedure by Nciizah and Wakindiki (2014). Briefly, rainfall was applied either as an 8-min single rainstorm (SR) or 4 × 2-min intermittent rainstorms (IR) separated by a 72-h drying period. The rainstorm patterns and drying period were chosen to mimic the natural climatic conditions (Allen et al., 2011). Three runs of rainfall simulations were conducted per soil sample. A rainfall simulator (LUW, Eijelkamp Equipment, 6897 ZG Giesbeck, Netherlands) was used. The simulator consists of 49 capillary tubes that applies raindrops of 5.9 mm in diameter. Splash cups filled with soil were saturated with distilled water. The samples were then subjected to simulated rainfall at an intensity of 360 mm/h (≈ 60 mm/h natural rainstorm with time-specific energy of 1 440 J/(m2·h) (Martin et al., 2010). The high intensity was to compensate for the short falling distance (0.4 m) used when calibrating the rainfall simulator. After each rainstorm, the splashed sediments collected in the splash plate were washed into a jar, oven dried at 105°C for 24 h and weighed. The splashed sediment weights from the IR per sample were summed up and soil loss in tonnes per hectare calculated as follows:
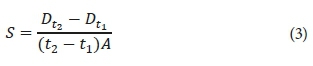
where S is the splash rate of a given rainfall period (g/(min·m2)); Dt1, Dt2 represent the total detachment after time t1, t2, respectively (g); t1, t2, represent the rainfall duration (min); A represents the area of splash plate (0.07 m2).
Measurement of soil organic carbon (SOC) loss
The loss of SOC by splash erosion was obtained from the concentration of OC in the splashed sediments. The OC concentration was analysed by the dry combustion method using a LECO RC-612 multiphase carbon analyser designed to differentiate forms of carbon by oxidation temperature (Nelson and Sommers, 1996). A sub-sample of the < 2 mm fraction was inserted into a quartz tube, heated to 550°C and the OC oxidized to CO2, which is selectively detected by an infrared gas analyser. The OC of the soil surface prior to splash was determined using the same procedure for each soil type and grain size fraction (silt-clay and fine sand) at the beginning of the experiment. OC concentration in the sediments was expressed as the enrichment ratio of organic carbon (ERoc):
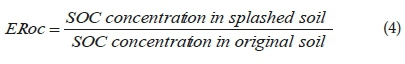
Values of ERoc above 1 indicated higher OC concentration in sediments than in the original soils.
Statistical analyses
A repeated measure analysis of variance (ANOVA) test was run to compare soil loss (collected sediments) and ERoc concentration means in sediments under the two rainstorms. Means were separated using the Tukey test (p < 0.05). All data were analysed using JMP version 11.0.0 statistical software (SAS Institute, 2010).
RESULTS AND DISCUSSION
Soil organic carbon for the seven horizons ranged from 0.39 to 1.61%. The saprolite was found on the surface and this could be the reason for the higher SOC content noted (Table 1). The Orthic A and Red Apedal B had most particles in the > 0.002 mm size range. Melanic A and the Pedocutanic B had the most clay content and least sand particles, as shown by the low clay ratio values (Table 1).
Considering that a structural index (SI) > 9% indicates a stable soil structure, 7% < SI < 9% a low degrading risk, 5% < SI < 7% a high degrading risk, and SI < 5% structurally degraded soils (Reynolds et al., 2009), six out of the seven soil horizons indicated structurally degraded soils, having SI values < 5% (Table 1). This situation is a consequence of the sub-optimal levels of SOC observed in all seven soil horizons.
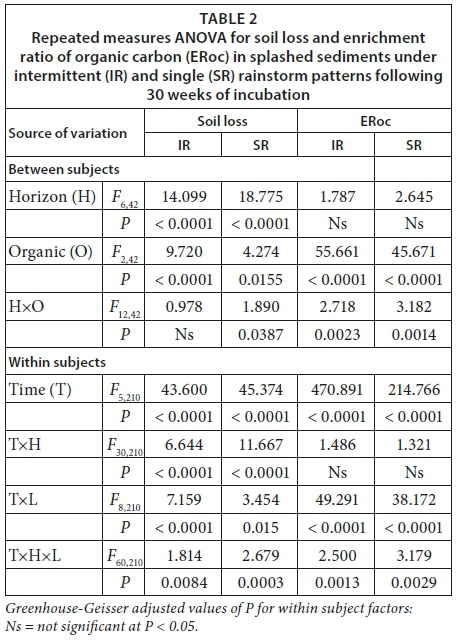
Soil loss and ERoc loss under the intermittent rainstorm (IR) and single rainstorm (SR) were significantly (P < 0.05) influenced by time × soil horizon × litter quality interactions (Table 2).
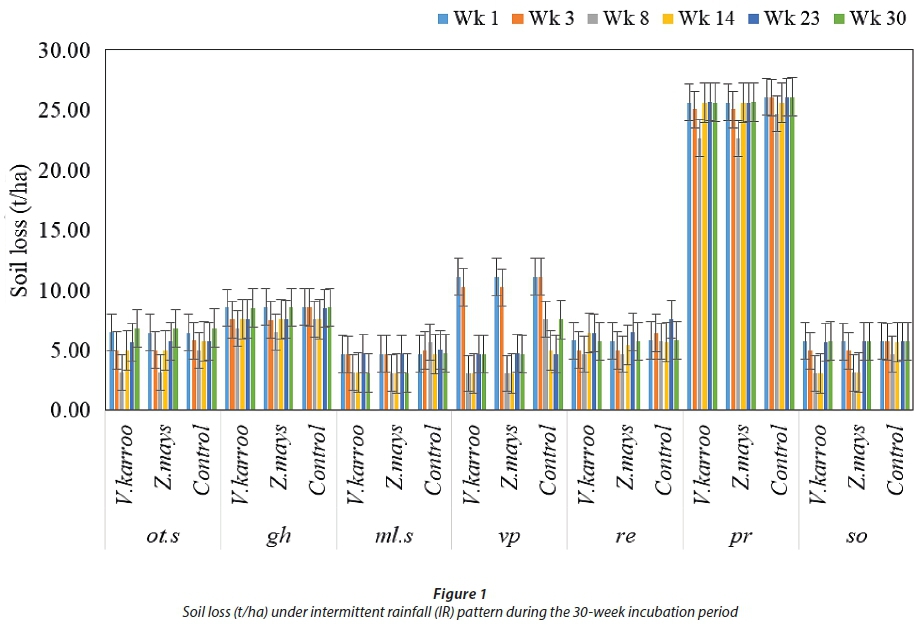
Soil loss (t/ha) decreased from Week 1 to Week 8 of incubation, and thereafter increased under IR (Fig. 1). The lowest quantities of sediments were collected at 8 weeks after incubation in all soil horizons. The highest quantity of sediment was collected in the pr and lowest in the ml.s and so (Figs 1 and 2). Litter source had no effect on the quantities of splashed sediments per soil horizon (Fig. 1). The observed soil loss in the soil horizons under IR from highest to lowest were: pr > vp > gh > ot.s > re ≥ so > ml.s (Fig. 1).
The quantities of soil sediments across the soil horizons initially decreased then became constant and increased from Week 23 after incubation under both IR and SR in most soil horizons except in pr where the soil loss was constantly high over the entire incubation period (Figs 1 and 2). There were no differences (P < 0.05) observed between the control and other treatments at Weeks 1 and 30 of incubation (Fig. 1).
Soil loss (t/ha) decreased from Weeks 1 to 14 of incubation, and thereafter increased under SR. The lowest quantities of sediments were also collected at 8 weeks after incubation in all soil horizons (Fig. 2).
The observed soil loss in the soil horizons under SR, from highest to lowest, for the different soils were: pr > vp > gh > ot.s ≥ re ≥ ml.s ≥ so (Fig. 2). Generally, 13% and 25% more sediments were splashed under IR than SR at Weeks 1, 3 and 30, and Weeks 8, 14 and 23 after incubation, respectively (Figs 1 and 2).
The recent South African soil erosion map (period: 2000 to 2005) defined soil-loss classes in t/(ha·yr) as: very low (0 to 5); low (5 to 12); moderate (12 to 25); high (25 to 60); very high (60 to 150) and extremely high (> 150) (www.nda.agric.za/docs/StratPlan07/07sectoral.pdf). According to this, the soil loss for the seven soil horizons ranged from very low in ml.s to high in pr for both IR and SR (Figs 1 and 2). The exchangeable Ca2+ and Mg2+ dominated the exchange complexes of the studied soils (Parwada and Van Tol, 2016). The adsorbed cations (Ca2+ and Mg2+) on the clay particles reduced the negative charge thereby causing loss of negativity on the clay particles, and hence attracting the negatively charged organic matter and increasing aggregation. Therefore, the noted differences could be due to high stability of aggregates, which increased with an increase in clay content, as suggested by Kay and Anger (1999). Furthermore, Wuddivira et al. (2009) found that the extent of soil particle detachment from the surface was associated with physical and chemical properties, particularly primary size distribution. The organic matter associated with the clay particles and presumably adsorbed on the clay particles is the fraction most effective in aggregate stabilization (Barthes et al., 1999) and could have resulted to low soil loss in the ml.s and vp horizons (Figs 1 and 2). The clay particles bind aggregates together thus contributing to cohesive strength of the aggregates against raindrop splash effects under the two rainstorm patterns.
The higher soil loss noted under IR than SR could be due to the fact that the raindrops in the first rainstorm had broken the aggregate bonds, which could not recover in the 72 h before the second storm. These results agree with those of Jiang and Liu (1989), who observed that rainfall of maximum intensity for a short duration has the most significant effects on splash erosion. However, splash erosion also relates to soil properties. Erosion impedes the development of soil structure (Poch and Antunez, 2010) as aggregates can build up only when losses of finer particles and cementing agents are limited (Shi et al., 2010) and, consequently, when erosion is not too intense. Knapen et al. (2008) observed aggregate consolidation with increasing wetting and drying cycles, but our results showed that a drying period of 72 h (Fig. 1) was not enough to confer aggregation that could resist further raindrop splash effects.
The observed reduction in soil loss from Weeks 1 to 8 under IR and up to 14 weeks of incubation under SR (Figs 1 and 2) showed a positive effect of litter on soil aggregate stability to reduce splash erosion. The added litter linearly increased soil resistance to splash erosion, shown by decreasing quantities of sediments across soil horizons (Figs 1 and 2) and the maximum stabilizing effects attained at 8 weeks of incubation for which the least amount of soil was splashed (Figs 1 and 2). The gradual increase in quantities of sediments observed from Weeks 8 and 14 under IR and SR, respectively, showed stabilizing effects of organic matter on soil aggregates declining with time. This is in agreement with Barthes et al. (1999) who found an inverse relationship between soil aggregate stability and soil erodibility. An increase in soil loss after Week 8 of incubation could be due to the declining effectiveness of the added litter on soil aggregate stability.
The effect of V. karroo and Z. mays litter on the amount of splashed sediments was observed to be statistically (P < 0.05) the same within a soil horizon (Figs 1 and 2). These results disagree with observations by Conde et al. (2005), Guenet et al. (2010) and Potthast et al. (2010) who observed that addition of higher quality substrate (lower C/N ratio of < 24 and lower lignin content) led to greater soil aggregation than the addition of lower quality (C/N > 24) substrate, and hence greater resistance to detachment. This could be due to the fact that V. karroo leaf quality was not very high compared to Z. mays stover and could be classified as intermediate quality, associated with a balance between immobilization and mineralization. However, the results were in agreement with those of Jacob et al. (2010), who observed that C/N ratio had no influence on different forest litter materials and suggested that other factors, such as lignin/N ratio or secondary metabolites like polyphenols, influence decomposability of litter. Blair et al. (2005) observed a greater aggregate stability in slower decomposing (C/N > 24) than high-quality litter (C/N < 24). In this study, C/N ratio was not a good index for litter quality.
Enrichment ratio of organic carbon (ERoc) per soil horizon was proportional to the initial SOC content of the soil horizon (Table 1). The higher the initial SOC content the higher the ERoc and vice versa (Figs 3 and 4). The ERoc in the litter-amended soils gave rankings of soils from highest to lowest as: so > pr ≥ vp ≥ ml.s ≥ gh ≥ ot.s ≥ re under both IR and SR (Figs 3 and 4). The ERoc decreased with time over the entire incubation period under both rainstorms, except for an increase (P < 0.05) observed in the pr at Week 23 under SR (Fig. 4).
ERoc was significantly (P < 0.05) higher under IR than SR from 1 to 8 weeks of incubation. Thereafter, ERoc was not different (P > 0.05; Figs 3 and 4).
Values of ERoc above 1 indicated higher OC concentration in sediments than in the original soils. Splashed sediments had more OC at Weeks 1 and 3 after incubation than the original soils under the IR and SR in most soil horizons, except in so where OC was constantly high throughout the incubation period (Figs 3 and 4). The ERoc decreased from Week 8 to Week 30 after incubation in most soil horizons, except so (Figs 3 and 4)
The ERoc was not proportional to the quantities of splashed sediments. In this study most soil was splashed in pr and least in ml.s and so (Figs 1 and 2), but ERoc was highest in re and lowest in so (Figs 3 and 4). This strongly suggests that ERoc was directly dependent on soil properties, particularly the initial SOC content (Table 1). The mean soil loss rates and ERoc in the same soil horizons increased under the IR relative to SR at Weeks 1, 3, 8 and 30 after incubation. However, ERoc values were lower under the IR and at 14 and 23 weeks after incubation (Figs 3 and 4). These findings suggest that ERoc was significantly affected by rainstorm patterns. These results are similar to those of Li et al. (2016), who observed a SOC relationship with rainstorm patterns.
The decline in ERoc observed with time could be due to the fact that most of the added OM would have decomposed and mineralized at these later stages of the incubation. Significantly (P < 0.05) larger ERoc between the control and the treatment per soil horizon during this declining stage could suggest the varying abilities of the soil horizons to protect SOC against further decomposition. Higher ERoc was observed in re and so than other soil horizons due to the differences in initial OC content (Table 1). The re is characterized by weaker structure and the so grades into relatively un-weathered rock materials (Soil Classification Working Group, 1991), which therefore exposed more SOC to splash erosion under both IR and SR. This is similar to observations of Hassink et al. (1993) who found that organic matter is often closely associated with clay particles, or encapsulated in micro-and meso-aggregates, while non-protected organic material was mainly present in soils with more sand particles. The sandy soils result in fast turnover and hence low SOC accumulation. Application of organic residues can sustain SOC (Palm et al., 2001), and improve aggregate stability and thus resistance to raindrop splash impact.
CONCLUSION
Organic litter was effective in alleviating disruptive forces of raindrops on soils, under both IR and SR. Litter quality (V. karroo leaf (C/N = 23.8) and Z. mays stover (C/N = 37.4)) effect on soil loss and ERoc was the same within a soil horizon and varied across soil horizons, suggesting that not all litter sources can be used to stabilize soil against splash erosion. The soil loss was gradually reduced up to 8 weeks under IR and 14 weeks under SR, and the SOM thereafter lost its effect in stabilizing soil aggregates against splash erosion, leading to an increase in soil loss under both rainstorm patterns. Hence addition of fresh litter after these respective times is recommended in order to maintain the soil stability against splash erosion. There were more, 13% and 25%, splashed sediments under IR than SR at Weeks 1, 3 and 30, and Weeks 8, 14 and 23 after incubation, respectively. Therefore, more attention should be given to these soils, especially when there are more intermittent rainstorms than single storms.
The ERoc was proportional to the initial SOC content of the soils. Soil horizons with higher initial SOC content had higher ERoc than soils with lower initial SOC content. In this regard, the rainstorm pattern and the original SOC content were the main factors by which different soils influenced ERoc. The study suggests that soil properties have a greater impact on the role of litter against soil splash erosion and ERoc than rainfall characteristics. However, more rainfall patterns should be investigated for these soils.
ACKNOWLEDGEMENTS
The authors gratefully acknowledge the Agricultural Research Council for funding received for the study as well as the Water Research Commission for financial support to the first author.
REFERENCES
ALLEN DE, SINGH BP and DALAL RC (2011) Soil health indicators under climate change. A review of current knowledge. In: Singh BP (ed.) Soil Health and Climate Change. Soil. Biol. 29. Springer Verlag, Berlin. 25-45. [ Links ]
BARTHES B, ALBRECHT A, ASSELINE J, De NONI and ROOSE E (1999) Relationships between soil erodibility and topsoil aggregate stability or carbon content in a cultivated Mediterranean highland (Aveyron, France). Commun. Soil Sci. Plant Anal. 30 1929-1938. https://doi.org/10.1080/00103629909370343 [ Links ]
BLAIR N, FAULKNER RD, TILL AR and SANCHEZ P (2005) Decomposition of 13C and 15N labelled plant residue materials in two different soil types and its impact on soil carbon, nitrogen and aggregate stability, and aggregate formation. Aust. J. Soil Res. 43 873-886. https://doi.org/10.1071/SR04137 [ Links ]
BRADFORD JM, FERRIS JE and REMLEY PA (1987) Interrill soil erosion process: I. Effect of surface sealing on infiltration, runoff, and soil splash detachment. Soil Sci. Am. J. 51 1566-1571. https://doi.org/10.2136/sssaj1987.03615995005100060029x [ Links ]
CWP (Center for Watershed Protection) (2001) Mats and blankets. Erosion and Sediment Control Fact Sheet 9. Center for Watershed Protection, Ellicott City, MD. URL: http://www.stormwatercenter.net/Assorted%20Fact%20Sheets/Tool5_ESC/ESC%20FS9.pdf (Accessed 29 September 2016). [ Links ]
CHENG Q, CAI Q and WENJUN MA (2008) Comparative study on rain splash erosion of representative soils in China. Chin. Geogr. Sci. 18 155-161. https://doi.org/10.1007/s11769-008-0155-9 [ Links ]
CONDE E, CARDENAS M, PONCE-MENDOZA A, LUNA-GUIDO ML, CRUZ-MONDRAGON C and DENDOOVEN L (2005) The impacts of in-organic nitrogen application on mineralization of C-14-labelled maize and glucose, and on priming effect in saline alkaline soil. Soil Biochem. 377 681-691. https://doi.org/10.1016/j.soilbio.2004.08.026 [ Links ]
DWA (Department of Water Affairs, South Africa) (2013) Feasibility study: Mzimvubu Water Project. Newsletter 1, August 2013. Department of Water Affairs, Pretoria. [ Links ]
EZEABASILI ACC, OKORO BU and EMENGINI EJ (2014) Relative erodibility of some soils from Anambra basin. Sky. J. Soil Sci. Environ. Manage. 3 83-90. [ Links ]
FAN R and LI Z (1993) Rainsplash and sediment transport model on the slope. J. Hydraul. Eng. 6 24v29. [ Links ]
GAO X and BAO Z (2001) Study on effects of rainfall and soil structure on raindrop splash. J. Soil Water ConserV. 3 24-26. [ Links ]
GREGORICH EG, MONREAL M, CARTER R, ANGERS DA and ELLERT BH (1994) Toward a minimum data set to assess soil organic matter quality in agricultural soils. Can. J. Soil Sci. 74 367-385. doi:10.4141/cjss94-051. https://doi.org/10.4141/cjss94-051 [ Links ]
GUENET B, DANGER M, ABBADIE L and LACROIX G (2010) Priming effect: bridging the gap between terrestrial and aquatic ecology. Ecology 91 2850-2861. https://doi.org/10.1890/09-1968.1 [ Links ]
HASSINK J, BOUWAN LA, ZWART KB, BLOEM J and BRUSSARD L (1993) Relationships between soil texture, physical protection of organic matter, soil biota, and C and N mineralization in grassland soils. Geoderma 57 105-128. https://doi.org/10.1016/0016-7061(93)90150-J [ Links ]
HOZL DJ, WILLIARD KWD, EDWARDS PJ and SCHOONOVER JE (2015) Soil erosion in humid regions. A review. J. Contemp. Water Res. Educ. 154 48-59. https://doi.org/10.1111/j.1936-704X.2015.03187.x [ Links ]
JACINTHE PA, LAL R, OWENS L and HOTHEM DL (2004) Transport of labile carbon in runoff as affected by land use and rainfall characteristics. Soil. Till. Res. 77 111-123. https://doi.org/10.1016/j.still.2003.11.004 [ Links ]
JACOB M, LEUSCHNER C and THOMAS FM (2010) Productivity of temperate broad-leaved forest stands differing in tree species diversity. Ann. For. Sci. 67 (5) 503-509. https://doi.org/10.1051/forest/2010005 [ Links ]
JIANG Z and LIU Z (1989) Effect of rainfall factors and slope erosion. J. Soil Water ConserV. 2 29-35. [ Links ]
KAY BD and ANGERS DA (1999) Soil structure. In: Summer ME (ed.) Handbook of Soil Science. CRC Press, Boca Raton, FL. A229-A276 [ Links ]
KAY BD and ANGERS DA (2000) Soil Structure. In: Sumner ME (ed.) Handbook of Soil Science, CRC Press, Boca Raton, FL. A-229-A-276. [ Links ]
KNAPEN A, POESEN J and DE BAETS S (2008) Rainfall-induced consolidation and sealing effects on soil erodibility during concentrated runoff on loess-derived topsoils. Earth Surf. Proc. Land. 33 444-458. https://doi.org/10.1002/esp.1566 [ Links ]
KUKAL SS and SARKAR M (2011) Laboratory simulation studies on splash erosion and crusting in relation to surface roughness and raindrop size. J. Indian Soc. Soil Sci. 59 87-93. [ Links ]
LAL R (2004) Soil carbon sequestration impacts on global climate change and food security. Science 304 1623-1627. https://doi.org/10.1126/science.1097396 [ Links ]
LI L, VOGEL J, HE Z, ZOU X, RUAN H, HUANG W, WANG S and BIANCHI TS (2016) Association of Aggregation with the Distribution and Quality of Organic Carbon in soil along and Elevation Gradient on Wuyi Mountain in China. Plos ONE 11 (3) e0150895. https://doi.org/10.1371/journal.pone.0150898 [ Links ]
LI XY, GAO SY, XU H and LIU LY (2006) Growth of Caragana korshinskii using runoff collecting microcatchments under semiarid condition. J. Hydrol. 328 338-346. [ Links ]
MANDIRINGANA OT, MNKENI PNS, MKILE Z, VAN AVERBEKE W and VAN RANSTE VH (2005) Mineralogy and fertility status of selected soils of the Eastern Cape Province, South Africa. Commun. Soil Sci. Plant Anal. 36 2431-2446. https://doi.org/10.1080/00103620500253514 [ Links ]
MARTIN C, POHL M, ALEWELL C, KORNER C and RIXEN C (2010) Interrill erosion at disturbed alpine sites: Effects of plant functional diversity and vegetation cover. Basic Appl. Ecol. 11 619-626. https://doi.org/10.1016/j.baae.2010.04.006 [ Links ]
MUCINA L and RUTHERFORD MC (2006) The vegetation of South Africa, Lesotho and Swaziland. Strelitzia 19. South African National Biodiversity Institute, Pretoria. [ Links ]
NCIIZAH AD and WAKINDIKI IIC (2014) Rainfall intensity effects on crusting and mode of seedling emergency in some quartz-dominated South African Soils. Water SA 40 4-12. https://doi.org/10.4314/wsa.v40i4.2 [ Links ]
NELSON DW and SOMMERS LE (1996) Total carbon, organic carbon, and organic matter. In: Sparks DL, Page AL, Helmke PA, Loeppert RH, Soltanpour PN, Tabataba MA and Johnston CT (eds) Methods of Soil Analysis, Part 3. Soil Science Society of America Inc., American Society of Agronomy Inc., Madison, WI. 961-1010. https://doi.org/10.2136/sssabookser5.3.c34 [ Links ]
OKALEBO JB, GATHUA KW and WOOMER PL (2000) Laboratory Methods of Soil and Plant Analysis: A Working Manual. TSBF-KARI-UNESCO, Nairobi, Kenya. [ Links ]
PALM CA, GILLER KE, MAFONGOYA PL and SWIFT MJ (2001) Management of organic matter in the tropics: translating theory into practice. Nutr. Cycl. Agron. 61 63-75. https://doi.org/10.1007/978-94-017-2172-1_7 [ Links ]
PARWADA C and VAN TOL J (2016) Soil properties influencing erodibility of soils in the Ntabelanga area, Eastern Cape Province, South Africa. Acta Agri. Scan., Section B Soil and Plant Sci. [ Links ]
POCH RM and ANTUNEZ M (2010) Aggregate development and organic matter storage in Mediterranean mountain soils. Pedosphere 20 702-710. https://doi.org/10.1016/S1002-0160(10)60060-4 [ Links ]
POTTHAST K, HAMER U and MAKESCHIN F (2010) Impact of litter quality on mineralization processes in managed and abandoned pasture soils in Southern Ecuador. Soil Biol. Biochem. 42: 56-64. https://doi.org/10.1016/j.soilbio.2009.09.025 [ Links ]
REYNOLDS WD, DRURY CF, TAN CS, FOX CA and YANG XM (2009) Use of indicators and pore volume function characteristics to quantify soil physical quality. Geoderma 152 252-263. https://doi.org/10.1016/j.geoderma.2009.06.009 [ Links ]
REYNOLDS WD, DRURY CF, YANG XM, FOX CA, TAN CS and ZHANG TQ (2007) Land management effects on the near-surface physical quality of clay loam soils. Soil Till. Res. 96 316-330. https://doi.org/10.1016/j.still.2007.07.003 [ Links ]
SAS Institute Inc. (2010) SAS campus drive, Cary, North Carolina, United States. [ Links ]
SHI Z, YAN F, LI L, LI Z and CAI C (2010) Interrill erosion from disturbed and undisturbed samples in relation to topsoil aggregate stability in red soils from subtropical China. Catena 81 240-248. https://doi.org/10.1016/j.catena.2010.04.007 [ Links ]
SINGH MJ and KHERA KL (2008) Soil erodibility indices under different land uses in lower Shiwaliks. Trop. Ecol. 49 113-119. [ Links ]
SOIL CLASSIFICATION WORKING GROUP (1991) Soil Classification - A Taxonomic System for South Africa. Memoirs on the Agricultural Natural Resources of South Africa No. 15. Department of Agricultural Development, Pretoria. [ Links ]
SONNEVELD MPW, EVERSON TM and VELDKAMP A (2005) Multi-scale analysis of soil erosion dynamics in KwaZulu-Natal, South Africa. Land Degrad. DeV. 16 287-301. https://doi.org/10.1002/ldr.653 [ Links ]
STERN R, BEN-HUR M and SHAINBERG I (1991) Clay mineralogy effect on rain infiltration seal formation and soil losses. Soil. Sci. 152 455-462. https://doi.org/10.1097/00010694-199112000-00008 [ Links ]
SUR HS and GHUMAN BS (1994) Soil management and rainwater conservation and use in alluvial soils under medium rainfall. Bull. Indian Soc. Soil Sci. 16 56-65. [ Links ]
VAN TOL JJ, AKPAN W, KANUKA G, NGESI S and LANGE D (2014) Soil erosion and dam dividends: Science facts and rural 'fiction' around the Ntabelanga dam, Eastern Cape, South Africa. S. Afr. Geogr. J. [ Links ]
WAGNER S, CATTLE SR and SCHOLTEN T (2007) Soil-aggregate formation as influenced by clay content and organic-matter amendments. J. Plant Nutr. Soil Sci. 170 173-180. https://doi.org/10.1002/jpln.200521732 [ Links ]
WANG X and FANG D (1997) A physically-based model of rainsplash erosion on the slope. J. Sichuan University (Eng. Sci. Edn) 3 90-102. [ Links ]
WATSON DA and LAFLEN JM (1986) Soil strength, slope and rainfall intensity effects on interril erosion. Trans. ASAE 29 98-102. https://doi.org/10.13031/2013.30109 [ Links ]
WOLANCHO LW (2012) Watershed management: An option to sustain dam and reservoir function in Ethiopia. J. Environ. Sci. Technol. 5 262-273. https://doi.org/10.3923/jest.2012.262.273 [ Links ]
WUDDIVIRA M, STONE RJ and EKWUE EI (2009) Clay, organic matter, and wetting effects on splash detachment and aggregate breakdown under intense rainfall. Soil Sci. Soc. Am. J. 10 2136-2158. https://doi.org/10.2136/sssaj2008.0053 [ Links ]
YU L and MENG L (2000) Soil erosion by water. Scientific and Technical Information of Soil and Water Conservation 2 52−53 (in Chinese). [ Links ]
Received 8 November 2017
Accepted in revised form 27 November 2018
* To whom all correspondence should be addressed. e-mail: cparwada@gmail.com

