


Servicios Personalizados
Articulo
 Inglés (pdf)
 Articulo en XML
 Referencias del artículo
Indicadores

Links relacionados
-
 Citado por Google
 -
 Similares en Google
Compartir

 Permalink
Water SA
versión On-line ISSN 1816-7950
versión impresa ISSN 0378-4738
Water SA vol.44 no.4 Pretoria oct. 2018
http://dx.doi.org/10.4314/wsa.v44i4.22
ORIGINAL ARTICLES
The Pongola Floodplain, South Africa - Part 2: Holistic environmental flows assessment
Cate BrownI, VI, *; Alison JoubertI; Toriso TlouII; Andrew BirkheadIII; Gary MarneweckIV; Bruce PaxtonV; Adhishri SinghII
ISouthern Waters, 152 Glen Road, Glencairn, Cape Town, 7975, South Africa
IITlou Consulting, Pretoria, South Africa
IIIStreamflow Solutions, East London, South Africa
IVWetland Consulting Services, Pretoria, South Africa
V31 Glenalpine Road, Welcome Glen, Cape Town, 7978, South Africa
VIInstitute for Water Studies, University of the Western Cape, South Africa
ABSTRACT
A holistic environmental flows (EFlows) assessment, undertaken as part of Ecological Reserve determination studies for selected surface water, groundwater, estuaries and wetlands in the Usuthu/Mhlatuze Water Management Area, South Africa, led to recommendations for modified releases from the Jozini Dam to support the socially, economically and ecologically important Pongola Floodplain situated downstream of the dam. The EFlows study analysed various permutations of flow releases from the dam based on the recommendations of pre-dam studies, and augmented by more recent observations, inputs from farmers and fishermen who live adjacent to the floodplain and discussion with the operators of Jozini Dam. The EFlows method used, DRIFT, allowed for the incorporation of detailed information, data and recommendations from a decades-old research project on the Pongola Floodplain that was undertaken prior to the construction of the Jozini Dam into a modern-day decision-making framework. This was used to assess the impact of a series of different flow releases on nature and society downstream of the dam. It was concluded that, within historic volumetric allocations to the floodplain, a release regime could be designed that considerably aided traditional fishing and grazing without necessarily prejudicing other uses, such as agriculture.
Keywords: EFlows, DRIFT, Jozini Dam, Pongola floodplain, Pongolapoort Dam, Reserve, sustainable use
INTRODUCTION
Floodplain ecosystems, which are defined as 'areas of low lying land that are subject to inundation by lateral overflow water from rivers or lakes with which they are associated' (Junk and Welcomme, 1990; cited in Tochner, 2008 p. 46), generate a range of benefits that support human livelihoods and wellbeing (Nelson et al., 2009). They are also among the most threatened ecosystems on Earth (Tockner et al., 2008). Human endeavour has impacted on the viability of floodplains through pollution and the spread of invasive species (Tockner et al., 2008), but perhaps the most pervasive impacts have been changes to the pattern and volume of the river flows (Braatne et al., 1996; Mahoney and Rood, 1998), either through dams in the upstream catchment or through infilling, with the nett result of both being alteration of the timing, frequency and duration of floodplain inundation (Poff et al., 1997).
The Pongola Floodplain is a low-lying area adjacent to the meandering Pongola River downstream of Jozini Dam in KwaZulu-Natal, South Africa. It covers 13 000 ha and is characterised by wide alluvial plains (called madotsheni), interspersed by a series of large depressions or pans (Heeg and Breen, 1982). There are about 65 named and 25 unnamed pans of varying size, permanence and importance on the floodplain (Fig. 1). The southern portion is narrow and almost restricted to the main river course and its associated lower terraces. This portion has a few pans of significant size, such as Mayazela, Mfongozi and Ntlanyane, but most of these are fed from their own catchments and only receive water from the Pongola River during exceptionally high floods. The remaining pans are under the direct influence of the Pongola River and depend on its floodwaters for the bulk of their water supply. At maximum retention level, i.e., immediately following a flood of sufficient volume and duration to inundate the full extent of the floodplain, the pans have an estimated collective area of 2 600 ha (Heeg and Breen, 1982). People have lived on the high dry ground of the Makhatini Flats adjacent to the Pongola Floodplain for hundreds of years and are heavily dependent on its resources, including water, flood recession agriculture, grazing for livestock, fish, wood, wild vegetables, fruit, reeds and grasses (Heeg and Breen, 1982; DWS, 2015).
The first comprehensive document describing the many facets of the Pongola Floodplain was Man and the Pongolo Floodplain (Heeg and Breen, 1982), which remains a landmark account nearly 4 decades later. It not only provides a comprehensive compilation of knowledge from the late 1970s, but also a suggested pattern of flows to support the floodplain ecosystem through, inter alia, filling the pans, stimulating fish migration and breeding, accessing nutrients from marginal and providing flood irrigation to support crops on the floodplain (Heeg and Breen, 1982). This controlled flooding regime was suggested a decade before (South African) EFlows for river maintenance were first addressed nationally in the late 1980s (King and Louw, 1998) and brought into law in 1998 (RSA, 1998).
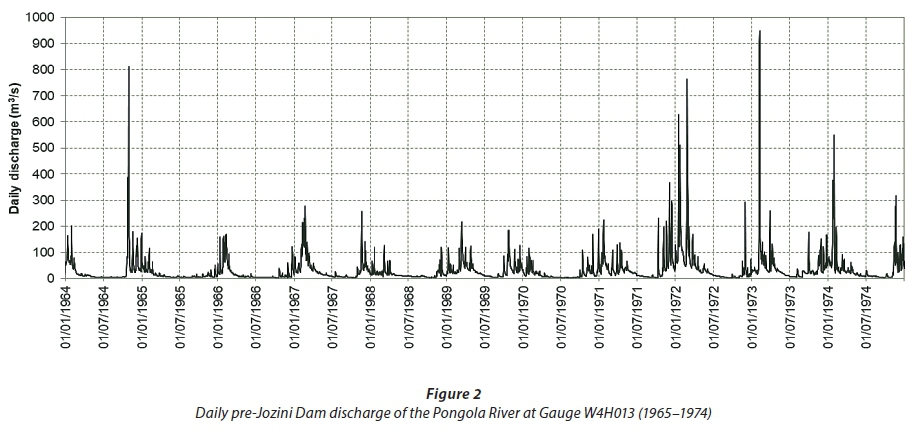
Jozini Dam was built in 1974 (previously named JG Strydom Dam and Pongolapoort Dam), has a full storage capacity of 2 267 100 ML and is situated at the upstream end of the floodplain. The dam was constructed for water supply to nearby towns and agriculture (mainly sugarcane). Prior to the construction of the dam, characteristic short floods that coincided with the rainy season each year deposited alluvial sediments that re-enriched the soils and supported recession agriculture, livestock husbandry, fishing and various other activities, such as harvesting of fruits, wild vegetables, wood and poles, and grasses and reeds (Heeg and Breen, 1982; DWS, 2015). Monthly maximum discharges measured at the Department of Water and Sanitation (DWS) gauging weir, W4H013, downstream of the dam varied considerably, from ~15 m3·s−1 in August to ~250 m3·s−1 in February. Minimum discharge showed less variation by month but was highest in February at ~25 m3·s−1 (Heeg and Breen, 1982; Fig. 2).
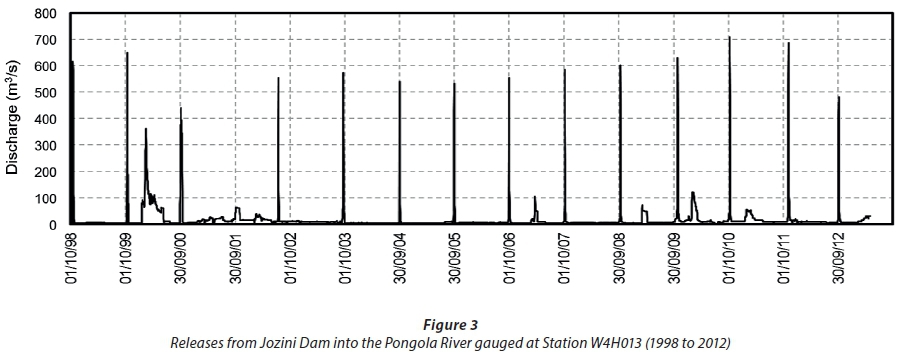
With the closure of Jozini Dam (c. 1974) the volume of water reaching the downstream river was almost halved and releases from the dam became the over-riding influence on the flow regime of the downstream river. The pattern of the releases has varied with time according to changing management but, in general, flooding frequency has declined, the timing of high and low flows has changed and, overall, flows have become less variable with fewer peaks and more constant low- flows (Van Vuuren, 2009). There are also sudden cessations of flows (Jaganyi et al., 2008). Developments upstream of Jozini Dam, such as the Bivane Dam built in 1995, have also reduced inflows to the dam (Jaganyi et al., 2008; Lankford et al., 2010) and reduced spills into the downstream reaches of the river. Initially, releases from Jozini Dam (by DWS) were made without consultation with the people living on the floodplain margins and dependent on its resources, and the negative impacts on them were enormous, such as collapse of fisheries, drying out of the floodplain allowing cattle access to crops, and a consequent drop in food security (Van Vuuren, 2009). In the mid-1980s, this changed to an unstructured process of negotiated dam-releases. In some years there were two or three flood releases, and in other years none at all. The unpredictable timing resulted in conflict between the various users of the floodplain (Van Vuuren, 2009). The situation changed again in 1998, with the advent of the 'October flood release', which was intended to meet the needs of recession floodplain agriculture and to inundate the floodplains in Ndumo Game Reserve at the Usuthu River confluence (Fig. 1). Since then, the annual releases have comprised a 4 m3·s−1 baseflow in the river throughout the year (which does not affect the floodplain), a large October flood release that inundates the floodplain and partially fills the pans, and periodic spills towards the latter part of the wet season (November to February; Fig. 3) that may or may not inundate the floodplain. Future baseflow releases will be approx. 1 m3·s−1 higher to provide 30 × 106 m3 per annum to Shemula for domestic use. The magnitude of the October flood releases has varied between < 400 and > 700 m3·s−1 (Fig. 3), mostly in an unsuccessful effort to fill the pans in Ndumo. In most years, the Ndumo pans only partially filled because October is before the onset of the rainy season and flows in the Usuthu River are still low, and thus do not hold back water in Ndumo. When the Usuthu and Pongola Rivers flood simultaneously, the backwater effect from the Usuthu promotes flooding in Ndumo Game Reserve at the confluence of the two rivers, filling the pans (Anderson, 2009). The asynchronous flooding also meant that water velocities through the pans have been higher than natural, resulting in the creation of channel incisions in the pans, which further reduced retention (Birkhead et al., 2018).
In 2014, as part of a basin-wide assessment of the Ecological Reserve (DWAF, 1999), DWS commissioned an environmental flows (EFlows) assessment of the Pongola Floodplain to inform a revision of the releases from Jozini Dam. The assessment was the first in South Africa that focused on a floodplain of the scale of the Pongola Floodplain and employed a systematic inclusion of historic data, information and expert opinion in the EFlows modelling.
The EFlows assessment
The EFlows assessment used the DRIFT (Downstream Response to Imposed Flow Transformations) EFlows method (King et al., 2003; Brown et al., 2013; King et al., 2016; Brown et al., 2018), underpinned by a two-dimensional hydrodynamic model that extended downstream from the Jozini Dam wall to the confluence of the Pongola and Usuthu Rivers at the Mozambique border (Birkhead et al., 2018). DRIFT is a time-series based scenario-assessment method that evaluates the impacts of changes in both the volume and the distribution of flows (Brown et al., 2018) on the ecosystem and its users. In doing so, it considers the implications of changing the timing of different magnitude flows on ecological aspects such as seasonal distributions and completion of life-history stages of aquatic biota, and social aspects such as flood-recession farming and fishing (Pringle et al., 2000; Rosenberg et al., 2000).
The Pongola assessment evaluated the impacts on the sociological and ecological attributes of the floodplain of various permutations of flow releases from the dam. These permutations were derived from the recommendations of pre-dam studies (Heeg and Breen, 1982), and augmented by more recent observations, inputs from farmers and fishermen who live adjacent to the floodplain and discussion with the operators of Jozini Dam. The main considerations were the high socio-economic dependence on the floodplain; the apparent conflict between the historic October irrigation release and the flow requirements for ecosystem maintenance as recommended by the water supply targets of Jozini Dam; and the aspiration to find a flow regime that optimises socio-economic and ecological benefits.
The steps taken in the assessment were: landscape delineation and site selection, to achieve a representative selection of pans and floodplain areas for assessment; hydrological and hydraulic analyses for each selected pan and floodplain; ecological and social data collection and collation, aimed mainly at establishing the sorts of changes that have occurred over time and collating the data generated by early ecological and social research done on the floodplain; definition of a baseline condition against which relative change could be described; selection of indicators that could be used to describe changes in the floodplain ecosystem and their effect on the social uses of the resource; development of response curves, which captured the knowledge and insights by previous research into the DRIFT software for use in the analysis; selection and running a set of flow scenarios through DRIFT; and generating the predictions of change.
Landscape delineation and site selection
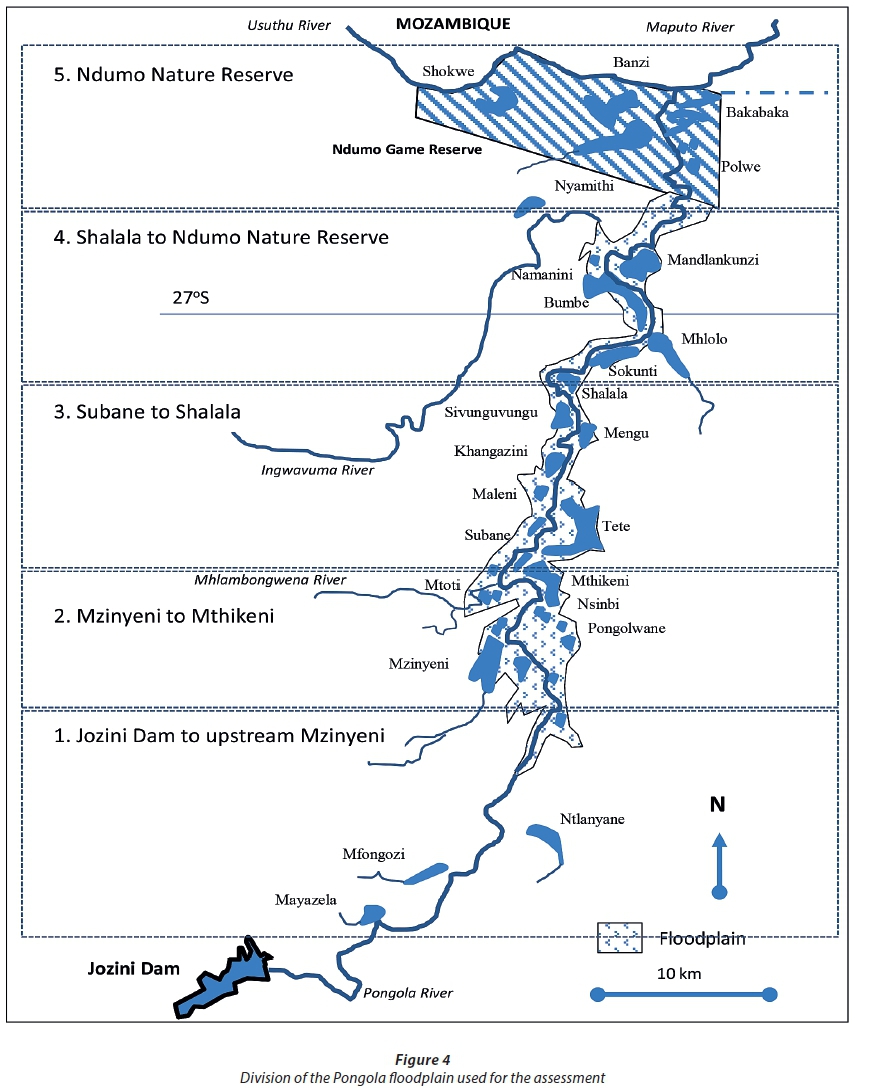
The floodplain was divided into five main areas, with one or more study sites, each comprising a pan and its surrounding floodplain (Fig. 4; Table 1). The selection of study sites/areas was guided by the reliability of the hydrodynamic modelling results and ensuring the inclusion of an array of important pans and floodplain areas. Banzi Pan (top northern portion of the system; Fig. 5) was excluded from the EFlows assessment because it is mainly filled by the Usuthu River, and because erosion of the pan and surrounding area had altered the relationship between the pan and the flow and sediment regime of the Pongola River (and to a lesser extent the Usuthu River). Field observations and modelling results indicate that the physical connectivity of the Banzi Pan with the river systems appeared to be in flux, as it did not retain water in the same way as it used to historically. In addition, an artificial weir built to retain water had been breached, which also affected the hydraulic and hydrologic behaviour of the pan.


Hydrological and hydraulic analyses
Monthly discharge time series were simulated by Aurecon (Pty) Ltd (DWS, 2015) for naturalised and 2014 conditions at relevant points along the river, and for potential future scenarios of water-resource releases from the dam. Simulations were done using the Water Resources Yield Model (WRYM) inherited from the PRIMA IAAP 10 Study (TPTC, 2011; DWS, 2015). Naturalised monthly discharges were disaggregated for hydrodynamic modelling guided by historic gauge data from the upstream catchment, and used to simulate daily releases from Jozini Dam (Birkhead et al., 2018). The simulated time series extends from 1951 to 2004, but this period was reduced to the most recent 15 years for hydrodynamic simulations, giving more acceptable run times of the hydrodynamic model of approx. 24 h. Two-dimensional hydrodynamic modelling using RMA2 (King, 2017) was used to determine the hydraulics of the water across the floodplain, and post-processed for analyses in the DRIFT DSS (Birkhead et al., 2018).
Data collection and collation
Limited field visits (3 days) were undertaken in November 2014, aimed mainly at identifying changes in the floodplain system over time through comparison with maps and other historical information, such as Furness and Breen (1982) and Heeg and Breen (1982). This was supplemented by an in-depth analysis of the extensive body of knowledge on the system (Coke, 1970; Phélines et al., 1973; Furness and Breen, 1980, 1982, 1985; Heeg and Breen, 1982; Heeg et al., 1980; Rogers, 1984; La Hausse de Lalouviére, 1987; Merron et al., 1993 a, b; Weldrick, 1996; Breen et al., 1998; Basson et al., 2006; DWAF, 2008; Jaganyi et al., 2008; Anderson, 2009; Van Vuuren, 2009; Lankford et al., 2010; Whittington et al., 2013). These were used to define the baseline ecological conditions (which were set as the condition in 2014), guide the choice of indicators, and construct the flow-ecology relationships (response curves) for input into the DRIFT DSS.
Baseline condition
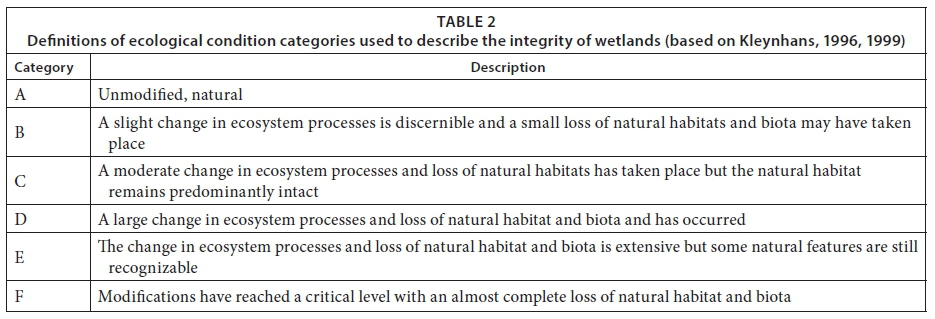
The baseline ecological condition (2014) was derived using the Wetland Index of Habitat Integrity (WIHI, DWAF 2007) and expressed as ecological categories for each site (Table 2; Kleynhans 1996, 1999). This is made up of category scores for the driving process hydrology, geomorphology and water quality, plus a vegetation alteration score based on field observations relative to the vegetation mapped by Furness and Breen (1982; Fig. 5). For the sections of the floodplain that were visited that did not have pans, the WET-Health tool (Macfarlane et al., 2007) was used to derive category scores for the hydrology, geomorphology and vegetation components, which were used to check that the WIHI for the whole system were comparable and made sense from the perspective of general floodplain health.
Indicators
DRIFT uses indicators to capture the response of the river ecosystem to flow change. The hydrological regime is the main driver of the whole ecosystem, and manifests as changing hydraulic conditions in the pans. A set of flow indicators was thus selected that captured the essence of the flooding regime on the floodplain with the focus on extent, depth, timing and duration of flooding (Table 3).

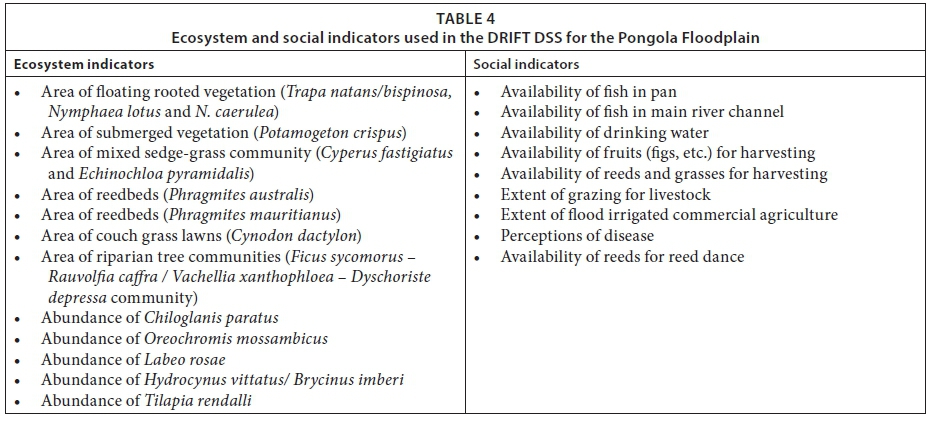
For each study area, the stage (depth) daily time series for baseline and each of the flow (release) scenarios was simulated using the RMA hydrodynamic model and imported into the DRIFT DSS. Initially, stage data of water levels were used to delineate four seasons (dry, transition 1, wet, transition 2), which were then used to calculate seasonal statistics for indicators such as pan area and inundation depths on the floodplain (Table 3). These indicators, capturing the changing hydraulic conditions on the floodplain through the year scenarios, are linked in DRIFT to ecosystem indicators that represent the different parts of the floodplain (Table 4) deemed most relevant by Heeg and Breen (1982), and to social indicators important to local people (Table 4).
Response curves
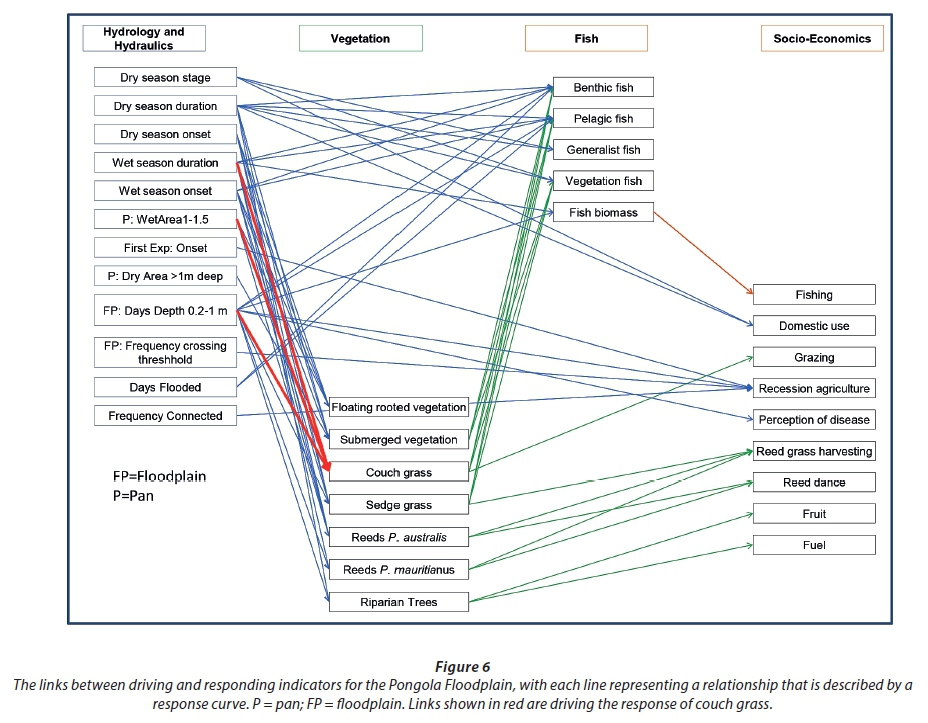
DRIFT predictions are driven by response curves that describe the relationship between a driving and a responding indicator. A driving indicator, such as 'Duration of flooding' could be linked to a responding indicator such as 'Area of submerged vegetation', which could itself become a driving indictor for a responder such as 'Fish biomass', which in turn drives 'Fishing' (social), and so on (Brown et al., 2018). The result is a complex web of response curves, each of which describes the expected impact of a single type of driving variable on the abundance of a single responding indicator (Fig. 6) if all other indicators remain unchanged. Each response curve has an explanation of its shape, based on the best available local and international data and understanding of the relationship.
As an example, the driving indicators linked to couch grass lawns are:
•Duration of inundation in the wet season. Explanation: The species survives inundation as viable rhizomes and shoots even though the latter lose their leaves following inundation (Heeg and Breen, 1982). It can tolerate periods of submergence of up to 150 days (Furness and Breen 1980) provided inundation persists for at least 28 days for the aquatic phase to benefit (Furness and Breen, 1982). As the plants are exposed to increasing water stress, productivity decreases, although they are extremely tolerant of extended periods of dry conditions (Furness and Breen, 1980).
•Mean pan area with a depth between 1 and 1.5 m. (P: Wet Area 1-1.5 m, in Fig. 6.) Explanation: flood events large enough to fill the pans to this depth are expected to optimally inundate couch grass habitat.
•The number of times the water depth on the floodplain increased to 0.2-1 m depth. (FP: Days Depth 0.2-1 m, in Fig. 6.) Explanation: Couch grass is found on gently sloping areas that become flooded and then exposed gradually as the flood waters recede (Heeg and Breen, 1982). It responds with rapid growth after re-exposure as the flood waters recede, but will eventually die if the interval between consecutive periods of inundation is less than 25 days (Furness and Breen, 1982).
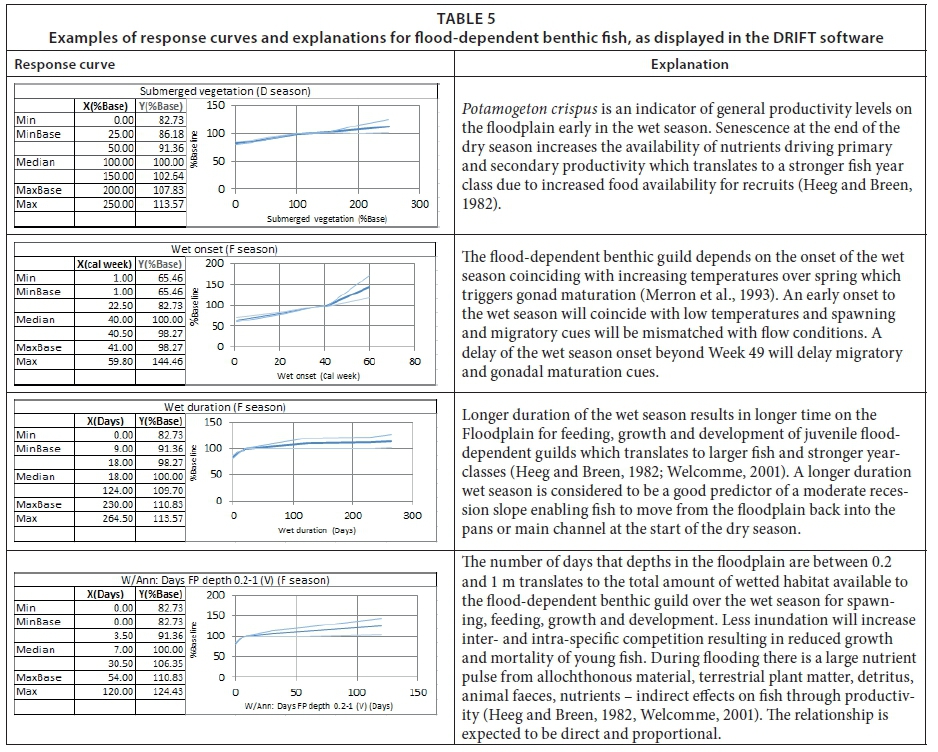
Each response curve describes the expected response, as a percentage change from baseline (y-axis), of the responding indicator. Examples of response curves housed in DRIFT, and the explanation that support them, (Table 5) show the baseline minimum (MinBase), median and maximum (MaxBase) values for each driving indicator, plus values outside of anything recorded under baseline (Min and max), and the nature of the reaction by the responder. Uncertainty is captured by the slightly thinner blue lines on either side of the main curve. A responding indicator can be linked to a maximum of 10 driving indicators. As illustrated in Table 5, the responding indicator 'flood-dependent benthic fish' is linked to amount of 'submerged vegetation' in the dry season (D season), onset and duration of the wet season and number of days that water depths on the floodplain are between 0.2 and 1 m (x-axis; Table 5). In the database it is also linked to mixed sedge-grass community in the wet/flood season; couch grass lawns in the wet season; duration of the dry season; the number of days the pans are connected to the main channel. Response curves and explanations for full suite of indicators are provided in DWS (2014). DRIFT evaluates the response of the indicator to the underlying hydraulic indicator for each month in the time series, based on the percentage change of the indicator relative to the baseline condition.
Scenarios
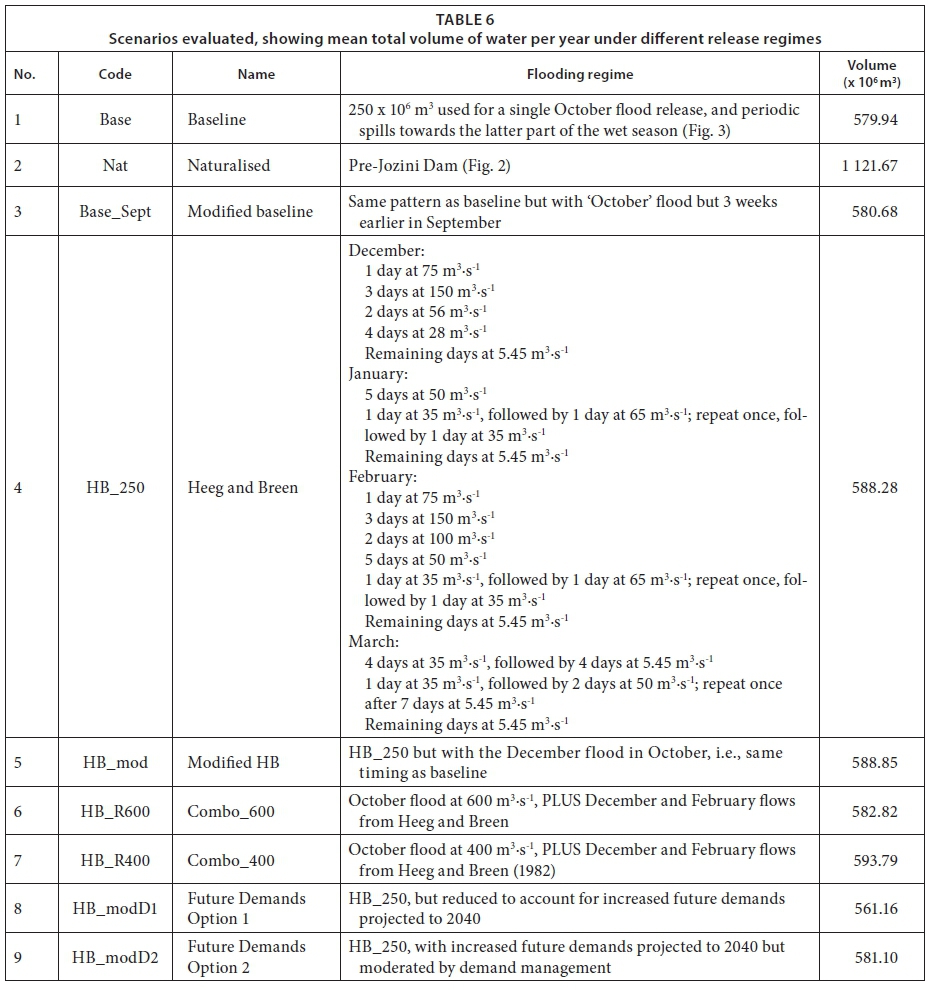
With the indicators, links and responses captured in the DRIFT software, the database is available as a resource for investigations of possible future interventions, such as a proposed change in the dam-release regime. Nine scenarios were selected for analysis. These were natural, baseline, and seven different arrangements of flow releases from Jozini Dam scenarios (Table 6). Apart from the natural scenario the scenarios required a similar annual volume (approx. 580 × 106 m3), which comprised: a 157 × 106 m3 per annum 'compensation flow' for Mozambique, released at approx. 5.5 m3·s−1 for most of the year; an annual allocation of 30 × 106 m3 for domestic use; an annual ~250 × 106 m3 flood allocation; and periodic spills towards the latter part of the wet season. The scenarios differed from one another in the release patterns making up the ~250 × 106 m3 flood allocation, which ranged from those seen as beneficial to recession agriculture (i.e., a single large early flood) to those seen as beneficial to the aquatic ecosystem (i.e., releases recommended by Heeg and Breen, 1982). The 250 × 106 m3 was used as a 'target' volume for the flood releases as asking for more would prejudice other users upstream and mean that it would be difficult to implement any recommended changes to the releases. Spills from Jozini Dam occur when the dam is full, which does not occur every year and usually not until the latter part of the wet season. Since all the scenarios used the same base hydrology and the same off-channel demands on the water stored in the dam, spills were only affected by the volume and pattern of releases. The 'Baseline' release operations were those that had been in place since 1994, with the 250 × 106 m3 used for a single October flood release, and periodic spills towards the latter part of the wet season (Fig. 3). One scenario, Base_Sept, made provision for a single large flood delivered in mid-September at the request of some farmers, so that they could start planting earlier (Table 6). The remaining six were variations on the Heeg and Breen (1982) recommended flood releases. According to Heeg and Breen (1982), these 'involved 41 × 106 m3 of water per annum', whereas in fact they would require in the region of 350 m3 × 106 per annum. This was higher than the target volume for the flood releases and so the 'Heeg and Breen (1982)' scenario was adjusted so that the flood portions could be supplied using no more than 250 × 106 m3 per annum.
Predictions of change
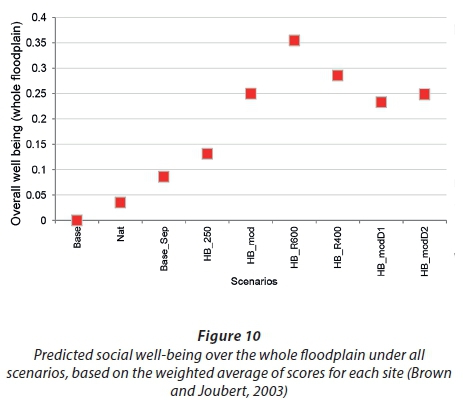
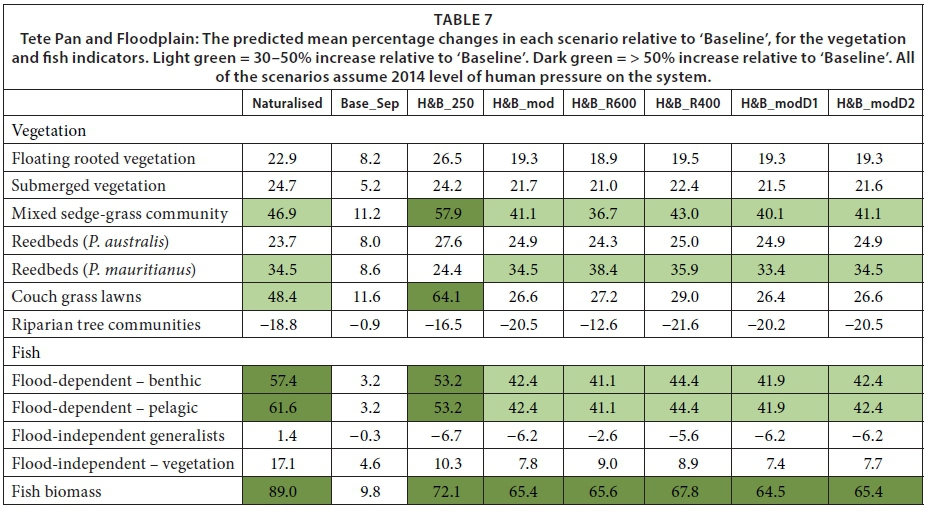
For each scenario, the predicted ecosystem changes in each study pan and its surrounding floodplain were evaluated as the estimated mean percentages of change from baseline in the abundance, area or concentration of each ecosystem indicator (Table 7), the predicted change in ecological condition and the predicted change in social wellbeing. The ecological condition score is a weighted sum of all ecosystem indicators, multiplied by +1 or -1 depending on whether a change in the indicator is a move towards or away from the natural condition (Brown and Joubert, 2003). The resultant score is then adjusted relative to the baseline condition and assigned an ecological condition category as per Table 2. Social well-being is calculated in much the same way, as a weighted sum of predicted change in each social indicator, but is not assigned a category. Tete Pan and Floodplain is used here as an example, but similar assessments were done for each of the pans listed in Table 1.
Of the scenarios modelled, Scenarios 2 (Naturalised) and 4 (HB_250) yielded the greatest improvements in vegetation and fish indicators, with the indicators that are dependent on timing, duration and frequency of flooding, such as couch grass lawns and flood-dependent benthic and pelagic fish, showing the greatest predicted increases in abundance. For some indicators, the increased flooding associated with these two scenarios was not expected to be an advantage. Riparian tree communities, for instance, which benefit from the low frequency of flooding under 'Baseline' conditions, and fish generalists, which have a competitive advantage over species of fish in the other guilds under 'Baseline' as they are better able to tolerate impacted conditions, both declined relative to 'Baseline' (Table 7). This represented a move towards natural. Interestingly, Scenario 2 (Naturalised), which represented a return to the pre-dam hydrology, did not yield universally better outcomes than Scenario 4 (HB_250). Fish were expected to do better under 'Naturalised', probably because frequent and prolonged inundation of the floodplain would enhance connectivity for fish between the river and floodplain and increase fish habitat, but vegetation was expected to fare better under 'HB_250'. This is because the frequent and prolonged inundation of the floodplain under 'Naturalised' is expected to enhance connectivity for fish between the river and floodplain, and increase fish habitat, but is also expected to result in suboptimal submergence of couch grasses and sedges. Couch grass, for instance responds positively following re-exposure as the flood waters recede, but the interval between consecutive periods of inundation should exceed 25 days (Furness and Breen 1982). 'HB_250' was designed around this (and other) optimal frequencies and duration of submergence of the floodplain vegetation. The predicted change in abundance of vegetation in Tete Pan (floating rooted vegetation and submerged vegetation; Table 7) was similar for the two scenarios because in both the pans remain full for the duration of the wet season. The predicted outcomes for most of the other scenarios followed a similar trend, although the changes were less marked (Table 7). The exception to this was 'Base_Sep', which yielded a slight improvement relative to 'Baseline' because the earlier flood release meant there was more time for the dam to fill after the release and as a result there were slightly more spills from Jozini Dam towards the end of the wet season, which generated a positive response in many of the ecosystem indicators.
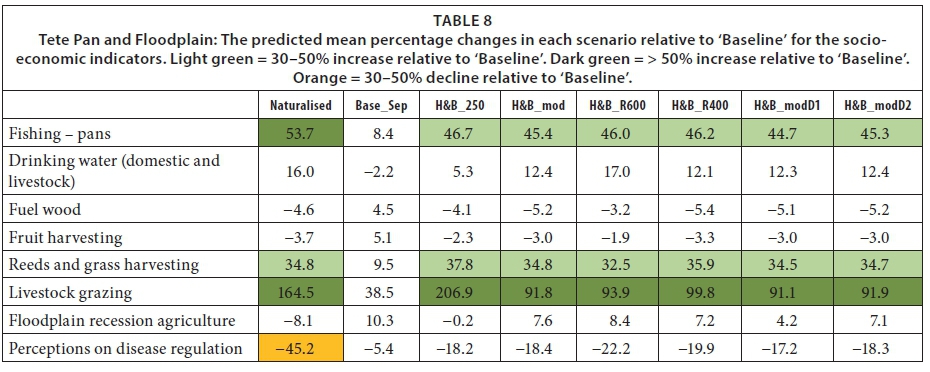
The predicted changes in socio-economic indicators (Table 8) were more variable than those for the ecosystem indicators, although, as expected, these tracked changes in the underlying resources. Fishing in pans, for instance, was expected to improve in line with increases in fish biomass, and livestock grazing was expected to do much better under Scenario 2 (Naturalised) and 4 (HB_250) mainly because they improve availability of grazing grass and ensure ready access to water through the summer months. The slight decline predicted for fuel wood and fruit harvesting under Scenarios 3-7 was related to reduced access to the floodplain because of flooding. Floodplain recession agriculture was expected to benefit most from Scenario 3 (Base_Sept), which moves the current October flood into September in order to allow earlier planting and multiple harvests. Such agriculture was also positively affected to almost the same extent, however, by some of the variations in Scenarios 5, 6 and 7, which combined a smaller October flood release with floods later in the year. This suggests that there is more potential for synchronisation of flooding requirements, and a possible win-win outcome that benefits the ecosystem without prejudicing recession agriculture. Interestingly, the perception among floodplain users was that the regulated flows reduced the prevalence of diseases such as malaria, and thus perceptions on disease regulation associated with the other scenarios, in particular the 'Naturalised' scenario, were negative.
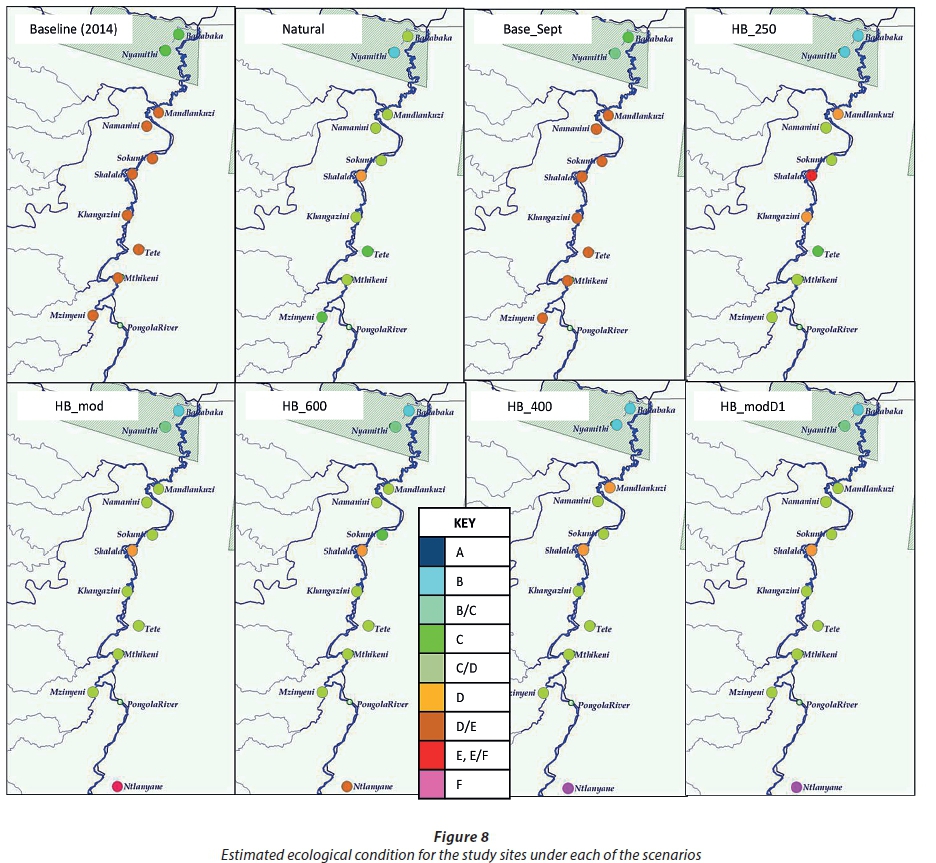
Other than 'Baseline' and 'Base_Sept', the scenarios were predicted to result in an improved overall ecosystem condition. In the case of Tete, the ecological category, except under 'Base-Sep' was expected to improve from D/E (Fig. 5) to C (Fig. 7), with very little differentiation between scenarios. Although it is not certain, we hypothesise that this is because of the impact on sediment supply of having a dam immediately upstream (after Kondolf, 1997), and because human pressures on the system are such that it would be difficult to attain an A and B category. This theory is lent credence by the A to B categories predicted for the pans in the Ndumo Nature Reserve (Fig. 8), which are shielded from many of the human pressures.

Not all sites respond in the same way to the scenarios because topography and position in the floodplain mean that for the same discharge in the river, the onset, duration, frequency and depth of flooding differs depending on location and topography. 'HB_250', although best for Tete, was not optimal for several other pans. For instance, Sokuthi and Ntlanyane fared better under 'HB_600' than under 'HB_250'. In most scenarios, Ntlanyane was predicted to be in the poorest condition and the pans in Ndumo Game Reserve (Nyamithi and Bakabaka) in the best condition. The predicted ecological condition of the floodplain as a whole, calculated by averaging the individual conditions weighted by area (Brown and Joubert, 2003) showed that the best overall outcome was achieved by any one of 'Naturalised', 'HB_600', 'HB_mod', 'HB_400', 'HB_modD1' and 'HB_modD2' (Fig. 9).

'HB_600' yielded the best socio-economic outcome as expressed by the weighted sum of the social indicators (Fig. 10). This was because it resulted in improved fishing, livestock grazing and access to drinking water with minimum impacts on recession agriculture. 'HB_mod', 'HB_400', 'HB_modD1' and 'HB_modD2' offered the next best outcomes.
On balance, the distribution of releases captured by 'HB-600' seems best placed to improve the pans and dependent social structures. In this scenario, the 250 × 106 m3 flood volume is distributed in: October = 2-day flood with a peak of 600 m3·s−1; December = 1 day at 75 m3·s−1; 3 days at 150 m3·s−1; 2 days at 56 m3·s−1; 4 days at 28 m3·s−1 and remaining days at 5.45 m3·s−1; February = 1 day at 75 m3·s−1; 3 days at 150 m3·s−1; 2 days at 100 m3·s−1; 5 days at 50 m3·s−1; 5 days oscillating between 35 and 65 m3·s−1 and remaining days at 5.45 m3·s−1.
DISCUSSION
Releases from Jozini Dam affect the whole Pongola Floodplain, but not all parts of the ecosystem or its social structures are affected equally. Thus, any decisions with respect to the release regime should consider the configuration of different effects in all parts of the floodplain. Releases that support some users will often prejudice others, particularly if they negatively affect the natural environment as this has a strong link to people's livelihoods and welfare. The 'Baseline' releases clearly benefit most those areas and people immediately downstream of the dam and negatively affect fishing and grazing further away. A better-designed release regime could considerably aid fishing and grazing and need not necessarily prejudice agriculture, particularly if the October timing of the main flood event is maintained.
There is also anecdotal evidence to support the redistribution of the releases to be similar to the recommended release scenario (HB_600). In wet years, when the Jozini Dam spills (mimicking the distribution in 'HB-600'), agricultural and fish yields are reportedly better than in years where this does not occur (T Tlou, pers obs.), which aligns with evidence from similar situations elsewhere (Arias et al., 2013; Junk et al., 1989; Merron et al., 1985; Rood and Mahoney 1996). HB_600 represented the best outcome for the ecosystem and socio-economic aspects combined. It uses no more water than the baseline and yet, if implemented, should yield a better overall outcome for all users and for the ecosystem as a whole than the baseline (2014) scenario. The recommended release pattern may not be the optimal nor final solution for the floodplain, as negotiations, and monitoring and adaptive management, may well result in some refinement. The veracity of the local people's perceptions on disease regulation should also be established. These additional activities notwithstanding, the systematic, scientifically based DRIFT analysis suggests that they are a good place to start. The database also provides a means of comparing the predicted outcomes for other release scenarios with those presented here, using the same assumptions.
This study highlights the role that systematic EFlows assessments can play in maximising the value of available scientific and social information to assist planners, developers, managers and communities to achieve more sustainable outcomes. It examines flow-release options that represent a range of trade-offs between water supply and social/ecological benefits, allowing decision-makers and stakeholders to make more informed choices. It shows that even when the volume of water made available for supporting ecosystem and social functions is not negotiable, there is still considerable scope for maximising the benefit that can be achieved through careful consideration of timing (e.g., Poff, 1997) and illustrates the lasting value of ecological data and understanding from well-designed and documented studies of the links between aquatic ecosystems and their flow regimes in assisting management with using limited resources to achieve an optimal outcome.
ACKNOWLEDGEMENTS
We extend our thanks to the Department of Water and Sanitation, who funded the study; Aurecon, (South Africa) for the daily flow time-series data used in the assessment; Dr Mike Coke for providing literature from the 1970s and 1980s. We are especially indebted to those who contributed to Heeg and Breen (1982). We thank three anonymous reviewers, who each added value to this paper, and Dr Jackie King, of Water Matters and UWC, who kindly reviewed the paper for us prior to final submission, and which also led to an improved product.
REFERENCES
ANDERSON RL (2009) Fluvial dynamics of the Usuthu River and Banzi Pan, Ndumo Game Reserve. Bsc Hons dissertation, University of Pretoria. [ Links ]
ARIAS ME, COCHRANE TA, NORTON D, KILLEEN TJ and KHON P (2013) The flood pulse as the underlying driver of vegetation in the largest wetland and fishery of the Mekong Basin. Ambio 42 864-8767. https://doi.org/10.1007/s13280-013-0424-4 [ Links ]
BASSON GR, DENYS F and BECK JS (2006) Pongolapoort Dam flood releases operational analysis: Socio-hydrological investigation, historical flood releases and mathematical modelling. Report to the Department of Water Affairs and Forestry, Pretoria on Project 2003-321 by ASP Technology (Pty) Ltd. 130 pp. [ Links ]
BREEN C, DENT M and MANDER M (1998) The Pongolo River Floodplain and its People: Past, Present and Future. Institute of Natural Resources, Pietermaritzburg. [ Links ]
BRAATNE JH, ROOD SB AND HEILMAN PE (1996) Life history, ecology and conservation of riparian cottonwoods in North America. In: Stettler RF, Bradshaw HD Jnr., Heilman PE, Hinckley, TM (eds) Biology of Populus and its Implications for Management and Conservation. National Research Council Press, Canada. [ Links ]
BIRKHEAD AL, BROWN CA, JOUBERT AR, SINGH A and TLOU T (2018) The Pongola Floodplain, South Africa. Part 1: Two-dimensional hydrodynamic modelling in support of an environmental flows assessment. Water SA 44 (4) 730-745. [ Links ]
BROWN CA and JOUBERT A (2003) Using multicriteria analysis to develop environmental flow scenarios for rivers targeted for water resource development. Water SA 29 (4) 365-374. [ Links ]
BROWN C, ZAKARIA V, JOUBERT A, RAFIQUE M, MURAD J, KING J, HUGHES J, CARDINALE P and ALONZO L (2018) Achieving an environmentally-sustainable outcome for the Gulpur Hydropower Project in the Poonch River Mahaseer National Park, Pakistan. Sustain. Water Resour. Manag. (2018). https://doi.org/10.1007/s40899-018-0227-7 [ Links ]
BROWN CA, JOUBERT AR, BEUSTER J, GREYLING A and KING JM (2013) DRIFT: DSS software development for Integrated Flow Assessments. WRC Project No. 1873. Water Research Commission, Pretoria. [ Links ]
COKE M (1970) The water requirements of the Pongola Floodplain Pans. In: Proceedings of the 1970 "Water for the future" Convention, Pretoria. [ Links ]
DWA (Department of Water Affairs, South Africa) (2010) The nature, distribution and value of aquatic ecosystem systems of the Olifants, Inkomati and Usutu to Mhlathuze Water Management Areas. DWA, Pretoria. [ Links ]
DWAF (Department of Water Affairs and Forestry, South Africa) (1999) Resource Directed Measures for Protection of Water Resources. Volume 3: River Ecosystems Version 1.0. DWAF, Pretoria. [ Links ]
DWAF (Department of Water Affairs and Forestry, South Africa) (2007) Manual for the assessment of a Wetland Index of Habitat Integrity for South African floodplain and channelled valley bottom wetland types. Rountree M (ed); Todd CP, Kleynhans CJ, Batchelor AL, Louw MD, Kotze D, Walters D, Schroeder S, Illgner P, Uys M and Marneweck GC. Report no. N/0000/00/WEI/0407. Resource Quality Services, Department of Water Affairs and Forestry, Pretoria. [ Links ]
DWAF (Department of Water Affairs and Forestry, South Africa) (2008) Artificial flood release at Pongolapoort Dam 2008 - Hydro activities. DWAF, Pretoria. 34 pp. [ Links ]
DWS (Department of Water and Sanitation, South Africa) (2014) Resource Directed Measures: Reserve determination study of selected surface water and groundwater resources in the Usutu/Mhlathuze Water Management Area. Pongola Floodplain - Hydrology Report. Report produced by Tlou Consulting (Pty) Ltd, Pretoria. [ Links ]
DWS (Department of Water and Sanitation, South Africa) (2015) Resource Directed Measures: Reserve determination study of selected surface water and groundwater resources in the Usutu/Mhlathuze Water Management Area. Hydrology Specialist Report. Prepared by Tlou Consulting (Pty) Ltd, Pretoria. Authors: Görgens A, Howard G and Sparks A (Aurecon South Africa (Pty) Ltd). [ Links ]
FURNESS HD and BREEN CM (1980) The vegetation of seasonally flooded areas of the Pongolo River Floodplain. Bothalia 13 (1&2) 217-231. [ Links ]
FURNESS HD and BREEN CM (1982) Decomposition of Cynadon dactylon (L.) Pers. in the seasonally flooded areas of the Pongolo river floodplain: pattern and significance of dry matter and nutrient loss. Hydrobiologia 97 119-126. https://doi.org/10.1007/BF00011965 [ Links ]
FURNESS HD and BREEN CM (1985) Interactions between period of exposure, grazing and crop growth rate of Cynodon dactylon (L.) Pers. in seasonally flooded areas of the Pongolo River floodplain. Hydrobiologia 126 65-73 https://doi.org/10.1007/BF00008389 [ Links ]
HEEG J and BREEN CM (1982) Man and the Pongolo Floodplain. A report of the Committee for Inland Water Ecosystems National Programme for Environmental Sciences. South African National Scientific Programmes Report no. 56. June 1982. 117 pp. Council for Scientific and Industrial Research, Pretoria. URL: http://researchspace.csir.co.za/dspace/handle/10204/2417 (Accessed 24 November 2014). [ Links ]
HEEG J, BREEN CM and ROGERS KH (1980) The Pongolo floodplain: a unique ecosystem threatened. In: Bruton MN and Cooper KH (eds) Studies on the Ecology of Maputaland. Natal Branch of The Wildlife Society of Southern Africa. 374-381. [ Links ]
JAGANYI J, SALAGAE M and MATIWANE N (2008) Integrating floodplain livelihoods into a diverse rural economy by enhancing co-operative management: A case study of the Pongolo floodplain system, South Africa. WRC Report No 1299/1/08. Water Research Commission, Pretoria. [ Links ]
JUNK WJ and WELCOMME RL (1990) Floodplains. In: Patten BC (ed.) Wetlands and Shallow Continental Water Bodies. SPB Academic Publishers, The Hague. 491-524. [ Links ]
JUNK WJ, BAYLEY PB and SPARKS RE (1989) The flood pulse concept in river floodplain-systems. Can. Spec. Publ. Fish. Aquatic Sci. 106 110-127. [ Links ]
KING IP (2017) Resource Modelling Associates: The RMA Modelling Suite - latest release and demo information, overview, history, references, user documents and technical aspects. URL: http://ikingrma.iinet.net.au/ (Accessed 1 June 2017). [ Links ]
KING J and LOUW D (1998) Instream flow assessments for regulated rivers in South Africa using the Building Block Methodology. Aquat. Ecosys. Health Manag. 1 (2) 109-124. https://doi.org/10.1016/S1463-4988(98)00018-9 [ Links ]
KING J, BEUSTER H, BROWN C and JOUBERT A (2014) Pro-active management: the role of environmental flows in transboundary cooperative planning for the Okavango River system. Hydrol. Sci. J. 59 (3-4) 786-800. https://doi.org/10.1080/02626667.2014.888069 [ Links ]
KING JM, BROWN CA and SABET H (2003) A scenario-based holistic approach to environmental flow assessments for regulated rivers. Rivers Res. Appl. 19 (5-6) 619-640. https://doi.org/10.1002/rra.709 [ Links ]
KONDOLF GM (1997) Hungry water: effects of dams and gravel mining on river channels. Environ. Manag. 21 (4) 533-551. https://doi.org/10.1007/s002679900048 [ Links ]
KLEYNHANS CJ (1996) A qualitative procedure for the assessment of the habitat integrity status of the Luvuvhu River. J. Aquat. Ecosyst. Health 5 41-54. https://doi.org/10.1007/BF00691728 [ Links ]
KLEYNHANS CJ (1999) A procedure for the determination of the ecological reserve for the purposes of the national water balance model for South African Rivers. Institute for Water Quality Studies, Department of Water Affairs and Forestry, Pretoria. [ Links ]
LA HAUSSE DE LALOUVIÉRE P (1987) A toponymic survey of the waterbodies of the Uphongola (Pongola) Floodplain area, northern Zululand. INR Working Paper No. 24. Institute of Natural Resources, Pietermaritzburg. [ Links ]
LANKFORD B, PRINGLE C, DICKENS C, LEWIS F, CHHOTRAY M, MANDER M, GOULDEN M, NXELE Z and QUAYLE L (2010) The impacts of ecosystem services and environmental governance on human well-being in the Pongola region, South Africa. Report to the Natural Environment Research Council. University of East Anglia and Institute of Natural Resources, London, Norwich, UK and Pietermaritzburg, South Africa. 140 pp. URL: http://inr.org.za/wp-content/uploads/2014/06/Lankford-et-al-2011-Water-allocation-PRESPA-paper-JEPM.pdf (Accessed 24 November 2014). [ Links ]
MAHONEY JM AND ROOD SB (1998) Streamflow requirements for cottonwood seedling recruitment - an integrative model. Wetlands 18 634-645. https://doi.org/10.1007/BF03161678 [ Links ]
MACFARLANE DM, KOTZE DC, ELLERY, WN, WALTERS D, KOOPMAN V, GOODMAN P and GOGE C (2007) WET-Health: A technique for rapidly assessing wetland health. WRC Report No. TT340/08. Water Research Commission, Pretoria. [ Links ]
MERRON GS, BRUTON MN and SKELTON PH (1985) Report on the October-December 1984 expedition to the Okavango Delta, Botswana. JLB Smith Inst. Ichthyol. Invest. Rep. 15. 15 pp. [ Links ]
MERRON G, BRUTON M and DE LALOUVIERE PLH (1993a) Changes in fish communities of the Phongolo floodplain, Zululand (South Africa) before, during and after a severe drought. Regulated Rivers: Res. Manag. 8 335-344. https://doi.org/10.1002/rrr.3450080404 [ Links ]
MERRON G, BRUTON M and DE LALOUVIERE PLH (1993b) Implications of water release from the Pongolapoort dam for the fish and fishery of the Phongolo floodplain, Zululand. South. Afr. J. Aquat. Sci. 19 34-49. [ Links ]
NELSON E, MEDNOZA G, REGETZ J, POLASKY S, TALLIS H, CAMERON D, CHAN K, DAILY G, GOLDSTEIN J, KARIEVA P, LONSDORF E, NAIDOO R, RIKKETS T and SHAW R (2009) Modelling mutiple ecosystem services, biodiversity conservation, commodity production, and tradoffs at landscape scale. Front. Ecol. Environ. 791 4-11. https://doi.org/10.1890/080023 [ Links ]
PHÉLINES RF, COKE M and NICOL SM (1973) Some biological consequences of damming the Pongola River. Commission Internationale Des Grands Barrages, Madrid. 173-189. [ Links ]
POFF NL, ALLAN MB, BAIN JR, KARR KL, PRESTEGAARD BD, RICHTER RE, SPARKS RE AND STROMBERG JC (1997) The natural flow regime concept: a paradigm for river conservation and restoration. BioScience 47 769-784. https://doi.org/10.2307/1313099 [ Links ]
PRINGLE CM, FREEMAN MC and FREEMAN BJ (2000) Regional effects of hydrologic alterations on riverine macrobiota in the New World: Tropical-temperate comparisons. BioScience 50 807-823. https://doi.org/10.1641/0006-3568(2000)050[0807:REOHAO]2.0.CO;2 [ Links ]
ROOD SB and MAHONEY JM (1996) River damming and riparian cottonwoods along the Marias River, Montana. Rivers 5 (3) 195-207. [ Links ]
ROGERS KH (1984) The role of Potamogeton crispus L. in the Pongolo River floodplain ecosystem. PhD thesis, Univ. Natal, Pietermaritzburg, South Africa. 299 pp. [ Links ]
ROSENBERG D, McCULLY P and PRINGLE C (2000) Environmental effects of hydrological alteration. BioScience 50 (9) 746-751. https://doi.org/10.1641/0006-3568(2000)050[0746:GSEEOH]2.0.CO;2 [ Links ]
RSA (Republic of South Africa) (1998) National Water Act. Act No. 36 of 1998. Government Gazette 19182. Government Printer, Cape Town. [ Links ]
TLOU T (2015) Personal observation, 12 February 2015. Mr Toriso Tlou. Director Tlou Consultants, Pretoria, South Africa. [ Links ]
TOCKNER K, BUNN SE, GORDON C, NAIMAN RJ, QUINN JP AND STANFORD JA (2008) Floodplains: Critically threatened ecosystems. In: Polunin NVC (eds) Aquatic Ecosystems. Trends and Global Prospects. Cambridge University Press, Cambridge. [ Links ]
TRIPARTITE PERMANENT TECHNICAL COMMITTEE (TPTC) (2011) PRIMA IAAP 10: System Operating Rules for the Incomati and Maputo Watercourses. Report by Aurecon South Africa to the Tripartite Permanent Technical Committee. [ Links ]
VAN VUUREN L (2009) Pongolapoort Dam: Development steeped in controversy. The Water Wheel 8 (3) May/June 2009 23-27. [ Links ]
WELCOMME R (2001) Inland Fisheries: Ecology and Management. Fishing News Books, Oxford. 358 pp. https://doi.org/10.1002/9780470995693 [ Links ]
WELDRICK SK (1996) The development of an ecological model to determine flood release options for the management of the Phongolo floodplain in Kwazulu/Natal (South Africa). MSc. thesis, Rhodes University. [ Links ]
WHITTINGTON M, MALAN G and PANAGOS MD (2013) Trends in waterbird diversity at Banzi, Shokwe and Nyamithi pans, Ndumo Game Reserve, South Africa. Ostrich 84 (1) 47-61. https://doi.org/10.2989/00306525.2013.775188 [ Links ]
Received 25 August 2017
Accepted in revised form 27 September 2018
* To whom all correspondence should be addressed. e-mail: cate@southernwaters.co.za

