


Services on Demand
Article
 English (pdf)
 Article in xml format
 Article references
Indicators

Related links
-
 Cited by Google
 -
 Similars in Google
Share

 Permalink
Water SA
On-line version ISSN 1816-7950
Print version ISSN 0378-4738
Water SA vol.44 n.4 Pretoria Oct. 2018
http://dx.doi.org/10.4314/wsa.v44i4.21
ORIGINAL ARTICLES
The Pongola Floodplain, South Africa - Part 1: Two-dimensional hydrodynamic modelling in support of an environmental flows assessment
AL BirkheadI, *; CA BrownII, III; AR JoubertII; A SinghIV; T TlouIV
IStreamflow Solutions, East London, South Africa
IISouthern Waters, 152 Glen Road, Glencairn, Cape Town, 7975, South Africa
IIIInstitute for Water Studies, University of the Western Cape, Cape Town, South Africa
IVTlou Consulting, Pretoria, South Africa
ABSTRACT
The Pongola Floodplain in the Makhathini Flats is an area of low topographic relief between the 1973-commissioned Jozini Dam, and the Usuthu River which borders Mozambique. The floodplain system is characterised by a complex mosaic of meandering river channels, levees, and floodplains interspersed with pans (or depressions) and wetlands. The landmark 1982 study of the floodplain, Man and the Pongolo Floodplain, suggested a pattern of flows to 'maintain the floodplain' based on socio-ecological criteria. Since 1998, however, annual releases have been primarily targeted at the needs of recession agriculture and inundation of the floodplain in the Ndumu Reserve. No releases have been specifically aimed at maintaining the floodplain ecosystem and the services it delivers to support the livelihoods of local communities. In 2013, the Department of Water and Sanitation commissioned an Ecological Reserve study of the Usuthu/Mhlatuze Water Management Area, which incorporates the Pongola Floodplain. This paper describes two-dimensional hydrodynamic modelling using RMA2 to inform this flow assessment. Four computational Pongola Floodplain models have been developed since 1979, including cell-based, one- and two-dimensional approaches. The RMA2 model is based on existing topographical, hydrological and hydraulic information, and was calibrated and verified for the period 2008 to 2010 using water-level data from the local hydrometric monitoring network. Generally, good replications have been achieved in terms of peaks, rising and recession limbs, recession of ponded pan water-levels, and low-flow river stages. The RMA2 modelling represents an advancement of previous hydrodynamic studies of the floodplain and contributes to an improved understanding of its hydraulic behaviour. Model application was for the 15-year period 1990 to 2004, and simulations included naturalised, present management (2014), and 7 potential dam operational scenarios. The results were post-processed for analyses in the DRIFT DSS, described in the companion paper.
Keywords: Pongola Floodplain, Jozini Dam, two-dimensional hydrodynamic modelling, RMA2, environmental flows, Makhathini Flats, Ndumu Reserve
INTRODUCTION AND BACKGROUND
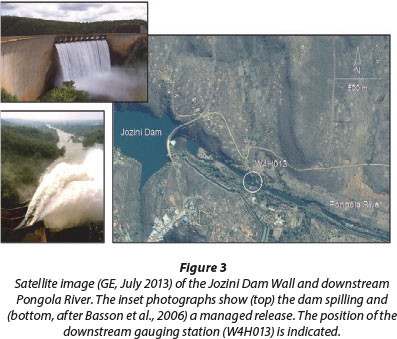
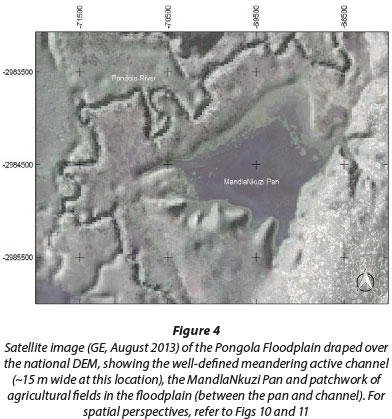
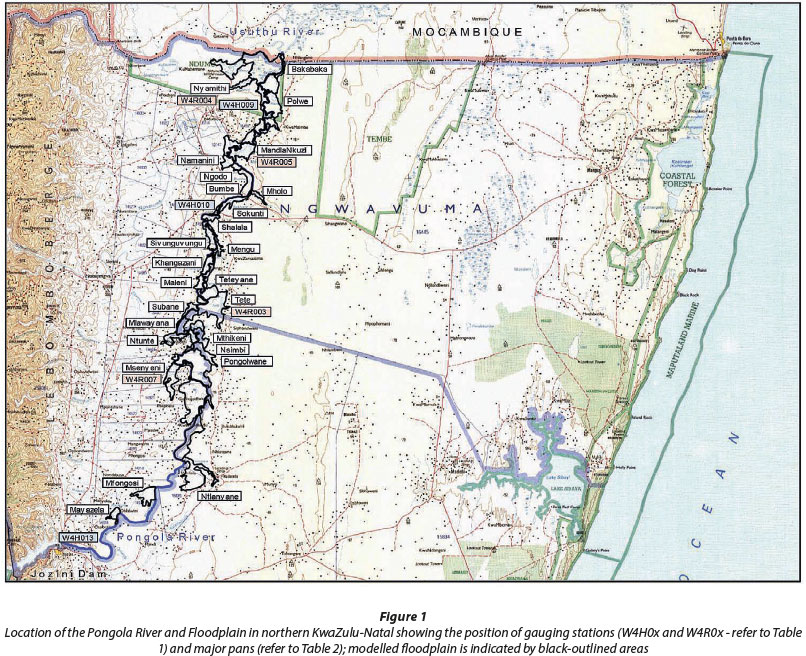
The Pongola Floodplain is an area of low topographic relief in the Makhathini Flats, northern KwaZulu-Natal, bordered by the Usuthu River and Mozambique to the north, the Lebombo Mountains and Swaziland to the west, and the Indian Ocean to the east (Figs 1 and 2). From Jozini Dam (Fig. 3) the Pongola River flows in a north-easterly direction to its confluence with the Usuthu River. The river's average longitudinal gradient is 0.039% over a total length of approximately (~) 139 km and, being characteristic of a low-gradient channel, displays a meandering planform across the flats, as illustrated in Fig. 4. The floodplain is interspersed with large depressions or 'pans' of varying size and permanence, and, whereas some pans are also fed by tributaries, most are dependent on the Pongola River for the bulk of their water supply. People have lived on the high dry ground of the Makhatini Flats for hundreds of years and are heavily dependent on its resources, including water, flood recession agriculture, grazing for livestock, fish, wood, wild vegetables, fruit, reeds and grasses (Heeg and Breen, 1982; DWS, 2015a).
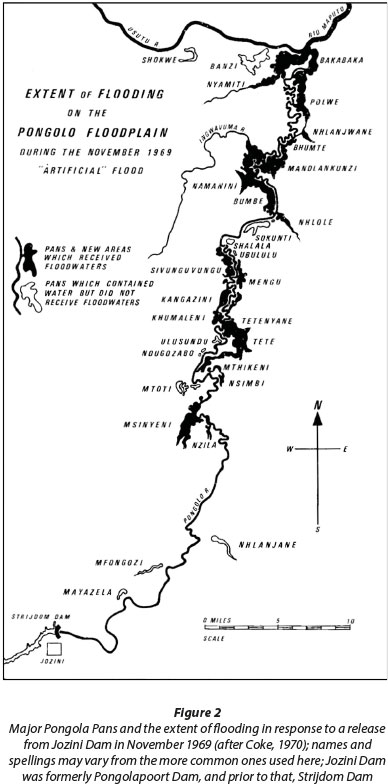
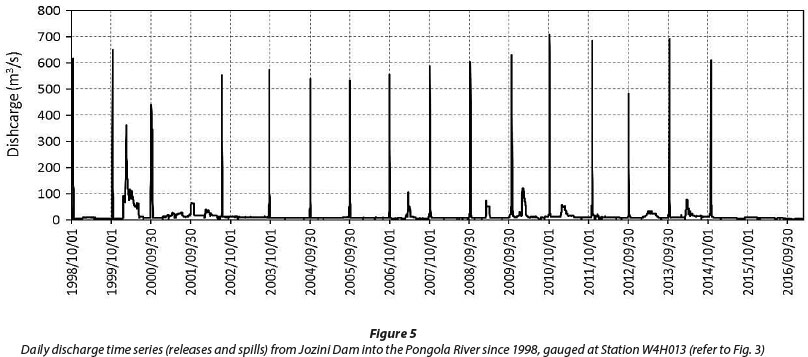
The first comprehensive document describing the many-faceted aspects of the Pongola Floodplain was Man and the Pongolo Floodplain, by Heeg and Breen (1982), and remains a landmark account over 3 decades later. This document is a synthesis of contributions to a workshop held in 1979, and covers the following aspects: general description (including geology, climate, vegetation and human links to the floodplain); hydrology; water quality; the ecosystem; humans and the floodplain; impact of development and development options; and conservation and the cost thereof. This account not only provides a comprehensive compilation of knowledge from the late 1970's, but also carried this through to a suggested pattern of flows to 'maintain the floodplain through the removal of accumulated wastes, stimulation of fish migration and spawning; submergence of marginal vegetation for a sufficiently long period to allow assimilation into the aquatic system and the provision of flood irrigation to cultivated lands on the floodplain.' It is worth noting that the controlled flooding regime suggested by Heeg and Breen (1982) pre-dated (South African) instream flow requirements for river maintenance by a decade, which was first addressed nationally in the late 1980s (King and Louw, 1998). Of concern is that, 36 years later, there are no operational releases specifically targeted at maintaining the floodplain ecosystem and its services which support the livelihoods of local communities. A Preliminary Ecological Reserve using the Desktop Model (Hughes and Münster, 2000) was undertaken by DWAF (2000), and provided for an allocation of 223 × 106 m3/a for an Ecological State C river. (The Ecological Reserve is a provision made through the National Water Act (RSA, 1998) for the protection of water resources through an allocation of water quantity and quality to the environment.) Between 1998 and 2012, annual October releases peaking between 450 and 700 m3/s (average daily) were made regularly at the end of the dry season (Fig. 5), primarily to meet the needs of recession floodplain agriculture and, ostensibly at the same time, to inundate the floodplain in the Ndumu Reserve near the Pongola-Usuthu Confluence. This timing is asynchronous with natural flooding patterns, where the highest volumes generally occurred in January/February. These and other issues are discussed in the article 'Pongolapoort Dam: development steeped in controversy' by Van Vuuren (2009). There have been no high flow releases since late-2014, due to falling dam levels.
Heeg and Breen (1982) recognised the need for 'the construction of a hydraulic model of the system which will establish relationships between river flow and flood levels, and will provide the means for testing the effects of this and other engineering alternatives for the optimisation of the use of available water resources.' A relatively recent study of the Pongola Floodplain by Lankford et al. (2010) is entitled 'Hydrological modelling of water allocation, ecosystem services and poverty alleviation in the Pongola Floodplain, South Africa.' Their hydrological modelling involved the use of measured 'natural river regime' flows and the development of relationships between discharge and flooded area from the previous studies of Phélines et al. (1973), Heeg and Breen (1982) and Basson et al. (2006). The latter, and other historic hydrodynamic models of the floodplain are discussed next.
Hydrodynamic models of the Pongola Floodplain
Over the past 45 years, since the commissioning of Jozini Dam, four computational models have been developed to simulate the hydrodynamic behaviour of the downstream Pongola Floodplain. These include the one-dimensional (1d) models of Pitman and Weiss (1979); Department of Water Affairs (1987); and Beck and Basson (2003), and the two-dimensional (2d) version of Basson et al. (2006).
The Pitman and Weiss (1979) 1d cell-based model had previously been successfully applied for simulating inundation behaviour in other floodplains. Limited data were available to calibrate the model for the Pongola Floodplain, however, and predictions indicated that a peak discharge of 690 m3/s (100 × 106 m3) filled the downstream pans, whereas a lower peak of 345 m3/s (50 × 106 m3) did not. The next model developed, by the South African Department of Water Affairs in 1987, was also cell-based, with stage-storage functions and weir connections between cells. The model was essentially steady-state incorporating Manning's formulation for flow resistance. Whereas the 1979 model excluded a section of the (more confined) river immediately downstream of Jozini Dam, the entire extent of the floodplain to the Usuthu River confluence was included in the 1987 model. Historic dam releases and resulting pan levels were used for calibration, but predictions tended to underestimate peaks and overestimate associated lag times by up to a few days. A 1d hydrodynamic model of the Pongola River and Floodplain (using Mike 11: 1d hydraulic, water quality and sediment transport modelling software) was developed 16 years later by Beck and Basson (2003), under the auspices of a South African Water Research Commission Project. The model was parameterised with cross-sections at ~500 m intervals along the river, and hydraulic controls (channels and weirs) provided the connectivity between the active channel and major pans, and between adjacent pans. The simulated flood peak was overestimated by ~0.5 m, and travelled through the system too fast by roughly half a day.
Basson et al. (2006) followed-up their 2003 study with linked 1d/2d models (using Mike 11 and 21C) for the upper and lower floodplain, respectively. Initial setup involved the use of a curvilinear grid with higher spatial resolution covering the river channel. Simulations encountered instabilities that could not be resolved, however, and a rectilinear grid was ultimately used, with the upstream 18 km of the system modelled one-dimensionally. The grid size applied for the 2d analysis was 20 m laterally by 50 m longitudinally. The model was parameterised with topographical data from two sources: digitised cross-sections and contours from 1930s and 1950s maps, and bathymetric surveys during a dam release in 2004. The October 1986 release was used for calibration, and model performance was checked against measured data associated with releases in 1986, 2002 and 2005. Computational time for an event was ~24 h. Basson et al. (2006) quoted a predictive accuracy of ~0.5 m for pan water levels, and less than 1 day for the timing of peaks. Water-level plots, however, indicate some substantially higher differences of up to ~1.0 m. Discrepancies were attributed to measurement errors, and possible geomorphological changes are mentioned concerning a 2.5 m difference in peak water level for the Msenyeni Pan in 1986. The calibrated model was also used for simulating hydrodynamic behaviour in response to different operational scenarios. These included different hydrograph peaks, volumes and shapes, as well as varying initial pan water levels. Key findings were the importance of peak duration and volume on pan inundation and (peak) discharge at the Mozambique border; the minor influence of initial pan levels on the effectiveness of large-volume releases; and the widespread flooding associated with extreme events. Also noted was the sensitivity of model results to topography, with a vertical accuracy of ~0.3 m suggested for future detailed surveys.
The present investigation was initiated in response to the need for improved hydrodynamic information in support of a socio-environmental flow assessment for the Pongola Floodplain, described in Part 2 of this set of papers (Brown et al., 2018). The flow assessment was commissioned by the Department of Water and Sanitation (DWS) as part of a basin-wide assessment of the Ecological Reserve. Concomitant with rapid advances in computing technology over the past few decades has been the development of multi-dimensional hydrodynamic models. For spatially extensive, topographically and hydraulically complex systems, such as the Pongola Floodplain, a model with advanced functionality is required. Appraisal of available 2d models, both commercial and freeware, led to the selection of RMA2 for this study.
TWO-DIMENSIONAL HYDRODYNAMIC MODELLING USING RMA2
Background
RMA2 is a 2d, depth-averaged, hydrodynamic model using finite elements, and is based on implicit solutions of the fully non-linear shallow water equations. It was developed by Norton et al. (1973) of Resource Management Associates, under contract with the United States Army Corps of Engineers (USACE; Wurbs, 1994). The model has been extended over the past 4 decades, and a version, together with pre- (CFGEN - ConFig GENerator) and post-processors which are part of the TABS numerical modelling system, is maintained by the Waterways Experiment Station (WES) Hydraulics Laboratory (Donnel, 2011). A commercial version, with licensing, is also available through Resource Modelling Associates (King, 2017) that includes active updates. Pre- and post-processing software for RMA2 includes RMAGEN (RMA geometry GENerator) and RMAPLT (RMA PLoT), which are for developing network geometry files and facilitating the display of results from the RMA suite of models, respectively.
RMA2 was one of the first multi-dimensional models widely used for modelling riverine and estuarine applications, and is a first-generation hydrodynamics engine. Over the past 3 decades, many new computational engines have been developed, although earlier models such as RMA2 still receive frequent use. It is included in the well-known Surfacewater Modelling Systems (SMS) suite, and a selection of recent applications include Yin et al. (2010), Sammany and Moustafa (2011), Lee and Julien (2012), Han (2014), Fulton and Wagner (2014), Akl (2016), Tonyes et al. (2017) and Birkhead et al. (2017).
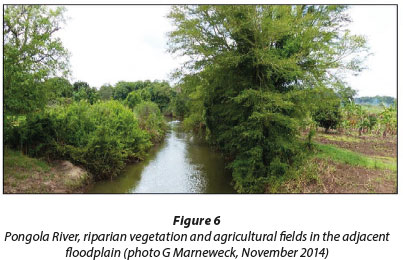
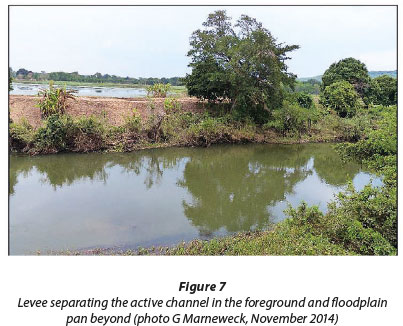
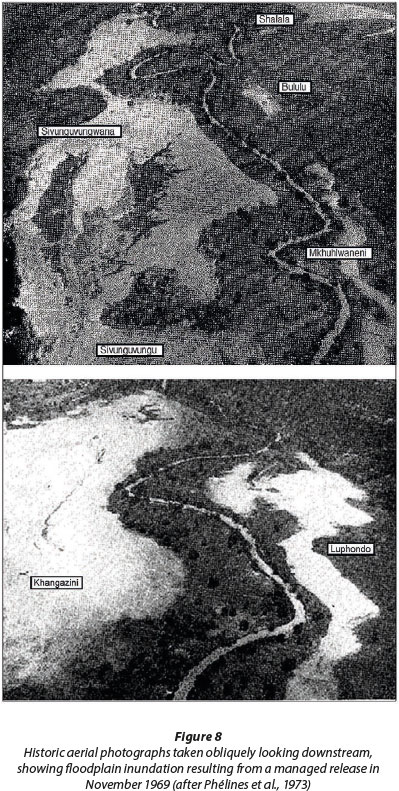
According to Jones (2011), the main drawbacks of the early computational engines are numerical instability, particularly when the application involves substantial wetting and drying and relatively long run times. In this study, the King (2014) version of RMA2 was applied to the Pongola Floodplain, which is characterised by extreme wetting and drying of an extensive floodplain (~13,000 ha) that includes a well-defined active channel (Figs 4 and 6). The floodplain contains numerous pans with ~150 identified by La Hausse (1987). These are generally connected to the Pongola River through small tributary and paleo channels that breach levees adjacent to the active channel, as illustrated in Fig. 7 and evidenced in the 1969 photographs in Fig. 8. The pans are isolated from surface flow in the river during the low flow (winter) season, with their water levels falling due to evapotranspirative losses. The hydrodynamic modelling required simulation over a large discharge range, associated with rapid changes in flow resulting from managed releases at Jozini Dam under present day (PD) operation. Furthermore, simulations were needed for long periods of at least a decade. More commonly, multi-dimensional hydrodynamic models are used to simulate behaviour over much shorter periods, such as hours or days, these being generally associated with isolated hydrological events.
Available data
Topographical information
Accurate topographical data are essential to the development of a 2d hydrodynamic model, and two available data sources were used. The first of these was from the bathymetric longitudinal survey of the Pongola River bed carried out by the Department of Water and Sanitation (DWS) for the Basson et al. (2006) study. These were sourced directly from the DWS, with the bathymetric portion extracted from the dataset which also included floodplain topography. Whereas the Basson et al. (2006) study used digitised cross-sections and contours from topographical maps of the 1930s and 1950s, this study used the national 25 m-resolution digital elevation model (DEM) available from National Geo-spatial Information (NGI). The standard error of the DEM is quoted as 1.2 m, and 2.5 m in flatter areas (NGI, 2011). Figure 4 shows a section the floodplain where the active and paleo channels, raised levees, floodplain and the MandlaNkuzi Pan are clearly discernible.
Discharge and stage records
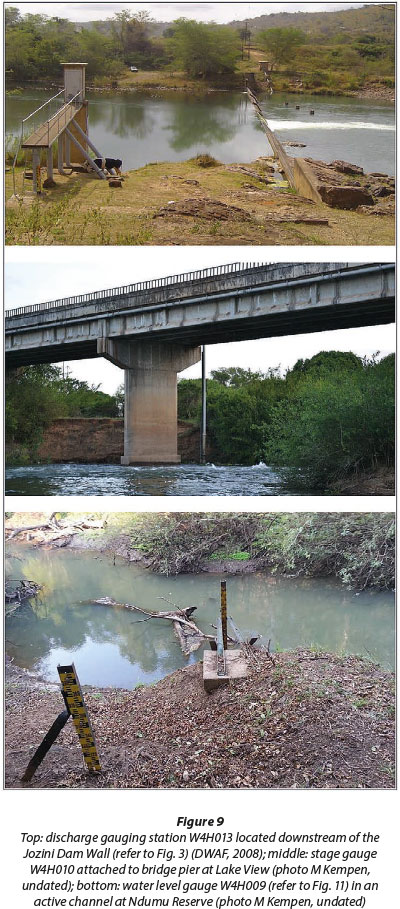
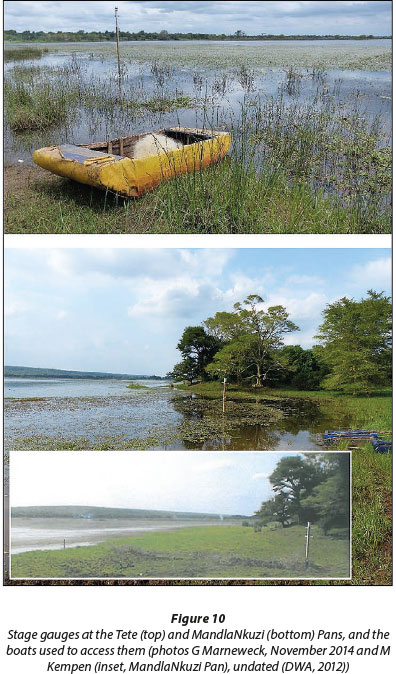
Available discharge and stage records were obtained from the DWS for hydrometric stations along the Pongola River and at pans, and are listed in Table 1. Discharge at Station W4H013 is accurately gauged at a compound sharp-crested weir (Fig. 9), which has been calibrated up to flows of ~850 m3/s using an Acoustic Doppler Profiler (Le Roux, 2008). At the remaining 6 stations (examples of which are illustrated in Figs 9 and 10), local water levels are recorded using data loggers, and these are converted to elevations relative to mean sea level. An exception is at the Ndumu Station (W4H009), where levels are relative to the (local) gauge datum. Records were also obtained for 2 stations along the Usuthu River from the Swaziland Department of Water Affairs.
Model setup
The 2d hydrodynamic model extends from the Jozini Dam wall to the Pongola-Usuthu confluence at the South Africa-Mozambique Border (Fig. 1). It includes all floodplain areas outlined in Fig. 1 that are directly inundated by Pongola River flows. The modelled area therefore excludes the Msunduzi and Shokwe Pans, with the latter associated with flooding along the Usuthu Floodplain (Fig. 11).
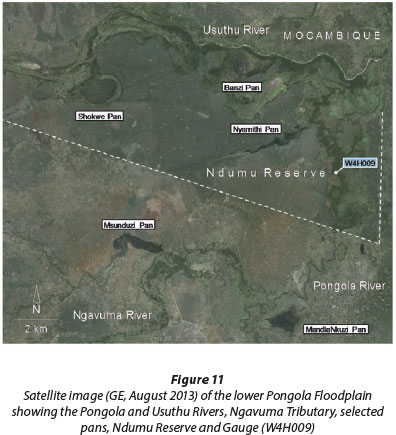
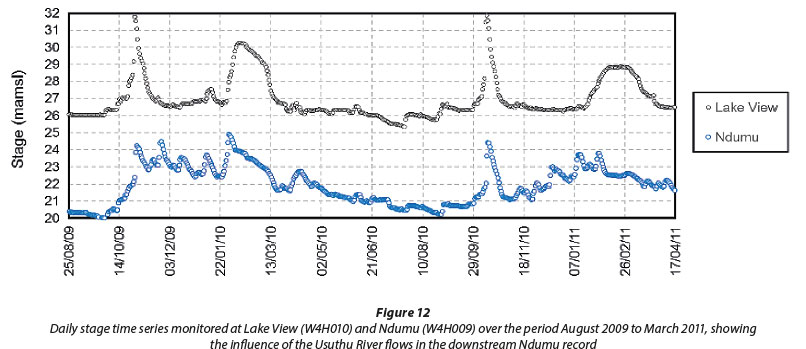
Inundation of the lower Pongola Floodplain (including its pans and wetlands) in the Ndumu Reserve, which is a Ramsar site, is associated not only with flows in the Pongola River, but also with flows from the Usuthu River. This relationship is illustrated in Fig. 12, which is a plot of recorded stage levels at two hydrometric stations in the Pongola River: Lake View (W4H010) and Ndumu (W4H009) located ~93 and ~129 km downstream of the dam, respectively. The October short-duration high-flow releases from Jozini Dam are obvious in the Lake View and Ndumu records, as are the longer-duration wet season releases/spills at Lake View. The wet season releases are not as clearly identifiable in the Ndumu record, however, since within the Ndumu Reserve wet season inundation is substantially influenced by flows in the lower Usuthu River.
The wetlands in the south of the Ndumu Reserve (near Gauge W4H009 - refer to Fig. 11) have been impacted by the severe reduction in the Pongola's wet season flows (Marneweck, 2014; refer to Fig. 13), and are frequently inundated for only a few days each year during the October release. This impact is expected, since the backwater influence of the Usuthu River, that ameliorates the effect of the dam, reduces with increased distance upstream of the Pongola-Usuthu confluence. Consequently, the future ecological status of the floodplain in the Ndumu Reserve depends not only on Pongola River flows, but on future water resource developments along the Usuthu River in Swaziland - which were not addressed in this study.
Topography
The national DEM was used for the Pongola Floodplain. Its spatial resolution allows mapping of the Pongola River by its lower elevation, as illustrated in Fig. 4. The 2004 bathymetric survey of the active channel, however, provides superior accuracy for the channel bed level, and this, together with measurements of channel width, was used to characterise the longitudinal bed topography of the river.
Finite-element mesh and topographic elevations
The finite-element mesh (e.g. Fig. 14) used was developed using a combination of purpose-coded software and geographic information systems. The procedure used was as follows:
•The river thalweg was digitised using the national DEM, producing a smoothened polyline containing 1 294 vertices.
•Channel bed widths were measured using satellite photography, and varied from 50 m immediately downstream of the Jozini Dam wall to 15 m at the Pongola-Usuthu River confluence. Trapezoidal channel cross-sections were applied, with maximum bank slopes of 45° and 7.5 m widths. The river bed, banks and adjacent levees were included as quadrilateral elements, whereas triangular elements were used to characterise the highly variable floodplain topography (e.g. Fig. 14). Bespoke software automated the construction of quadrilateral elements (and nodes) based on the channel's planform.
•The extent of floodplain was delineated using maximum recorded stages from the hydrometric stations (refer to Table 1) and the floodplain topography. Meshing of the floodplains was computed in QGIS (Quantum GIS; www.qgis.org) using the 'Triangle' software developed by Shewchuk (undated), available as the Basemesh Plugin for QGIS (Vetsch et al., 2014). The meshing software produces conforming Delaunay triangles based on the polygon model boundary (floodplain and levee), breaklines used to align mesh segments, holes within the mesh where elements are not required (e,g. elevated topographical features that are not flooded), conforming vertices (Steiner points) and restrictions on maximum element areas. The Basemesh software provides output as geographic information system shape and text files.
•Software was also developed to merge quadrilateral channel elements with floodplain triangulation, and assigns elevations to all nodes in the mesh (bed elevations were assigned from the bathymetric survey; levee and floodplain elevations were assigned from the DEM).
•Lastly, the finite-element mesh was written in text format for final pre-processing using RMAGEN.

Boundary and initial conditions
The boundary conditions used in the model include:
•Daily discharge time series at the upstream Pongola River boundary, representing naturalised, PD and future scenario conditions
•A rating (or stage-discharge) relationship at the Usuthu River boundary, immediately downstream of the Pongola-Usuthu confluence
•Daily discharge time series at the upstream Usuthu River boundary
•Daily discharge time series from tributaries flowing into the Pongola Floodplain
•Evapotranspiration from open water surfaces
The elevation difference over the modelled area is ~50 m, and the slope adjustment method in RMA2 was used to compute an initial (restart) condition from which transient (unsteady) simulations commence.
Floodplain wetting and drying and maximum retention levels in the pans
The 'marshing' feature in RMA2 was successfully used to model wetting and drying of the floodplain associated with flooding. Using this, when water levels fall below the ground surface, flow occurs in the 'low porosity groundwater zone'. Pans become isolated from surface flow in the river when water levels drop below invert levels - which are the hydraulic controls on river-pan connectivity. Maximum (pan) retention levels (MRL) are defined by the point of (dis)connection.
Recent changes in the hydraulic behaviour of the floodplain in the Ndumu Reserve not incorporated in the model setup
The floodplain in the Ndumu Reserve is characterised by pans, extensive wetlands and riparian forest. Major pans connected to the Usuthu River are the Shokwe and Banzi, whereas those adjacent to the Pongola River are the Polwe, Nyamithi, Bakabaka and Ndwanini. Numerous smaller pans were mapped by La Hausse (1987). It needs to be re-emphasized that the Ndumu Wetlands and Pans (excluding Shokwe) respond to flows in both the Pongola and Usuthu Rivers. Modelling indicates that the Usuthu River's backwater influence during high flows extends upstream of the Ndumu Reserve, to the KwaBumbe Pan; also, flow reversal occurs at the Pongola-Usuthu confluence under PD conditions, and to a lesser extent under natural conditions, when high flows in the Usuthu River are asynchronous with Pongola River discharges.
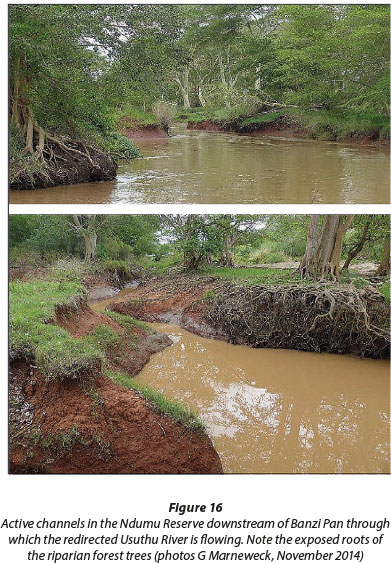
Concrete weirs were constructed downstream of the Banzi and Nyamithi Pans, and although the latter structure, which was constructed in 1983 (Whittington et al., 2013) is still intact, the Banzi Weir is breached. Associated with this, is the 'Lower Usuthu Breach', where this river broke its southern bank diverting flows through the Banzi Pan and into the Pongola River (Fig. 15). Due to international implications, studies have investigated possible causes for the breach and its remediation (Wadeson, 2006; Anderson, 2009; Basson, 2011 and SALOMON LDA, 2010 and 2011). As at August 2017, the Lower Usuthu Breach continues to divert flows through the Banzi Pan; a Google Earth image dated 21/08/2017 shows entire diversion of a low flow. Figure 16 shows the incised active channels and riparian forest downstream of the Banzi Pan. A key finding of the geomorphological scoping study of the Lower Usuthu Breach (Wadeson, 2006) is the naturally unstable characteristic of the Usuthu River. Frequent channel change was evidenced from paleo channels, but upstream catchment conditions were seen to be responsible for accelerated instability.
The influence of Usuthu River flows on the Pongola Floodplain is therefore even greater than pre-breach conditions. For this study, however, insufficient topographic data were available during model setup to include the Usuthu River from its breach position to the Pongola confluence.
Model calibration and verification
The model was calibrated using data from the hydrometric network: the two river channel locations (viz. Lake View and Ndumu) and four pan locations (viz. Msenyeni, Tete, MandlaNkuzi and Nyamithi) - refer to Table 1; data from the remaining three gauges provided some of the boundary conditions. Measurement-based data were used as far as possible for calibration, including daily discharge time series from Station W4H013 (below Jozini Dam), and from Stations GS6 or GS16 in Swaziland. The parameter values for the following variables were determined as part of the calibration: flow resistance as a function of depth; turbulence parameters; marshing parameters; depth for element elimination/addition, and evapotranspiration.
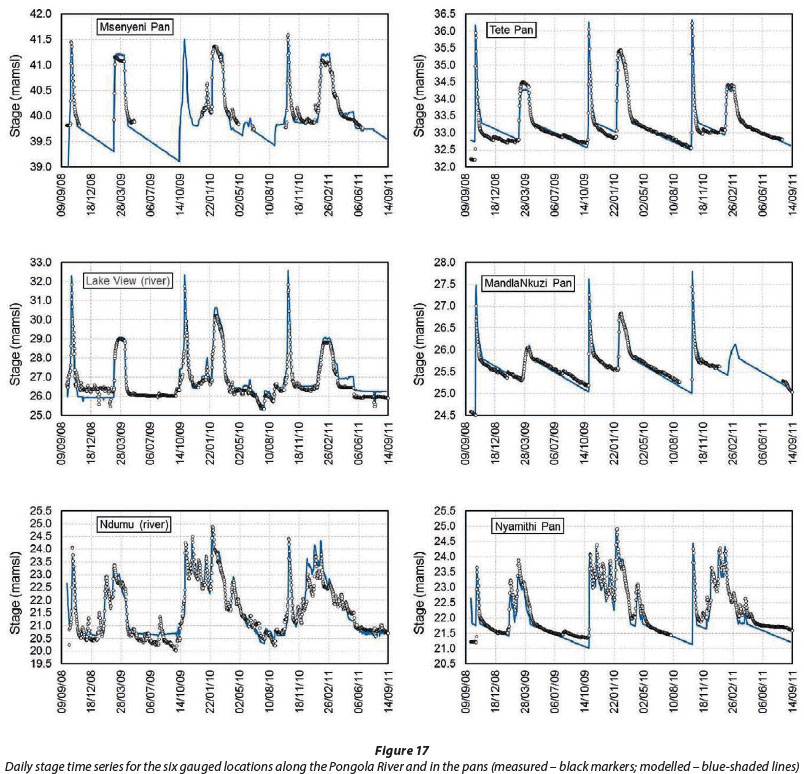
For the above 4 pans with continuous water level recorders, MRL can be identified from the stage hydrographs recessions (refer to Fig. 17), and invert levels were determined as part of calibration. For the remaining pans, MRL were estimated by combing the DEM with vegetation mapping (using high-resolution aerial and satellite imagery and ground-truthing). The floodplain was delineated into 56 areas (or sites), based mainly on the presence of 30 major named pans from the literature (Phélines et al., 1973 and Heeg and Breen, 1982). The model thus consists of the active channel and 56 adjacent and contiguous floodplain areas, most of which contain well-defined pans (e.g. the MandlaNkuzi Pan in Fig. 14).
Flow resistance values (Manning's n) used in the model were 0.030 and 0.040 for the river channel and floodplain, respectively, and these increased tenfold for depths below 0.40 m to maximum values at ground level. Drying and wetting depths of 0.2 and 0.1 m, respectively, were applied to levee-type and certain floodplain elements to disconnect inundated floodplain from river flows when water levels fall below the ground surface. For the remaining floodplain elements, substantially higher values of 3 to 5 m were used to dampen instabilities found to result from cyclical wetting and drying associated with close-to-steady conditions. The extent to which the modelling was required to simulate episodic drying and wetting of an extensive floodplain is apparent by the inundation range, being between ~17 and 111 km2.
The 3-year period from October 2008 to September 2010 was used for model calibration and verification, since it includes six events of varying magnitude: three were artificial end-of-dry season releases of up to ~630 m3/s (daily average), and the remaining were wet season releases between ~50 and 120 m3/s. The first year was used for calibration and the remaining to assess model performance. This 3-year period also provides reliable stage measurements compared with both prior, and more recent, times: the gauging of water levels in the floodplain has been historically challenging for the DWS, due to vandalism of equipment and the removal of fixed stations for agriculture (Kempen, 2014).
Figure 17 shows comparative plots of modelled (calibration and verification) and measured stage hydrographs for the six hydrometric stations (river and pan). Generally, good replications have been achieved in terms of peaks, rising and recession limbs when the river and pans are connected, recession of ponded levels in the pans, and low-flow stages in the river. A constant evapotranspiration rate of 4.0 mm is shown to produce satisfactory drawdown results, being almost identical to the WR2012 (WRC, 2017) annual average of 4.1 mm for this region.
Measured stage recessions in the pans (Tete, MandlaNkuzi and Nyamithi) all indicate rises in August 2009, which are attributed to inflows from the adjacent catchments and intercepted rainfall. Flows from adjacent catchments, many of which enter the Pongola River through pans, were modelled hydrologically at a monthly time-scale. These estimates were of insufficient accuracy, however, to be meaningfully applied as pan inflows, and were thus specified as direct river inputs.
For the Tete Pan, the MRL is lower after the October releases than following wet season inundation. A possible reason is due to increased vegetation cover during the naturally wet period, which may act to elevate the effective invert level through higher flow resistance and obstruction of return flow.
The modelled and measured low flow stages in the Pongola River at Lake View differ by ~0.5 m for the periods December 2008 to March 2009, and after April 2011. These deviations are attributed mainly to temporal changes in the hydraulic behaviour of the low-flow channel. For example, preceding the March 2009 release, a discharge of ~6.3 m3/s resulted in an average stage of ~26.5 m, whereas following the release, ~7 m3/s produced a stage some 0.5 m lower.
RMA2 was found to run reasonably efficiently for the modelling (22470 mesh elements), with the 1-year calibration simulation taking roughly 3 hours. The default time-step used in the simulations was about 4 hours, which is targeted at the dry season when changes are gradual; flow is confined to the active channel and the floodplain pans are ponded. Smaller time-steps down to 1 s were applied to facilitate convergence where necessary; convergence criteria were reasonably severe: 5 mm/s for velocity and 0.1 mm for water surface computations.
The previous studies of Phélines et al. (1973), Heeg and Breen (1982) and Basson et al. (2006) have contributed estimates of discharge required to inundate the major Pongola Pans. These values have been used in subsequent studies such as that of Lankford et al. (2010). A compilation of these estimates, together with those from this study, is provided in Table 2. Phélines et al. (1973) and Heeg and Breen (1982) provide measurement-based estimates, whilst the more recent studies involved modelling. The estimates of Heeg and Breen (1982) are provided as ranges, since initiation of pan filling was noted not to have occurred at the lower discharge, but took place at the higher value. It is likely that discharge estimates of Heeg and Breen (1982) incorporate previous estimates of Phélines et al. (1973), although this is not clear.
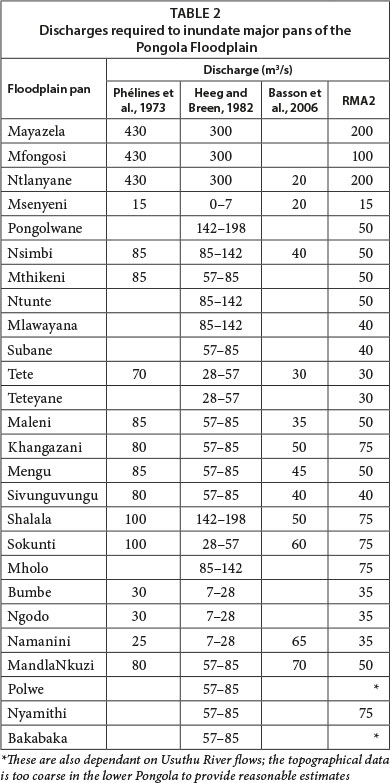
Overall, values from this and the 2006 modelling study are reasonably similar, although this study indicates generally higher discharges that are closer to those suggested by Heeg and Breen (1982). Exceptions are, however, for the Sokunti and MandlaNkuzi Pans. For the latter, initiation of pan filling from this study agrees with a gauged steady release. It is worth noting that geomorphological changes have taken place since the dam was commissioned: Basson et al. (2006) note that for 80 km analysed, the river has narrowed by 35%, with the greatest changes closest to the dam wall. Fluvial modifications have been brought about through dam closure combined with regular October flood releases over 2 decades, whose peaks exceed annual events (close to a 1:5 yr return period, Phélines et al., 1973). These are likely to have altered the hydraulic behaviour, and differences in discharge estimates over time are not unexpected. This, together with modelling uncertainties, dictates that the results of this hydrodynamic study, and the broader flow assessment (see Brown et al., 2018), should it be implemented, need to be implemented within a framework of adaptive management that involves monitoring.
The study of Phélines et al. (1973) indicated that flood peaks of ~120 m3/s with 3-day durations would be sufficient to replenish most of the pans. Heeg and Breen (1982) do not specify (peak) discharges per se, but identify the pans that require flooding at different times of the wet season. This RMA2 study provides the basis for estimating releases to achieve Heeg and Breen's (1982) suggestions (e.g. a release of 150 m3/s for 3 days has been applied, and tested, for flooding all the pans). Perhaps even more importantly, since these discharge-duration estimates existed a priori, this study allows changes in hydraulic behaviour, associated with different release patterns (or scenarios), to be quantified.
Model application
The model was run using discharge time series developed and provided by Aurecon (Pty) Ltd (DWS, 2015a) for naturalised and baseline conditions (Fig. 13), as well as for potential future scenarios that include all water resource demands from the dam (agricultural, inter-catchment transfers, irrigation and municipal/domestic). The latter were coupled with four different high-flow release patterns for the downstream floodplain. Hydrological time series simulations were based on monthly modelling using the Water Resources Yield Model (WRYM) inherited from the PRIMA IAAP 10 Study (TPTC, 2011). Naturalised monthly discharges were disaggregated for hydrodynamic modelling using historic hydrometric data from the upstream catchment. For baseline and future scenarios, MODSIM was used to simulate daily releases from Jozini Dam.
The simulated time series extends from 1951 to 2004, but this period was reduced to the most recent 15 years for hydrodynamic simulations, giving more acceptable run times of about 24 hours.
Post-processing RMA2 results for analyses in the DRIFT DSS
The standard output from a RMA2 simulation is a binary results file that may be graphically displayed and post processed using RMAPLT. The large spatial extent of the Pongola Floodplain, length of record simulated and number of time series analysed (natural, baseline and 7 scenarios), meant that it was necessary to develop software to automate the post-processing of results for further analysis in the DRIFT (Downstream Response to Imposed Flow Transformation) DSS (decision support system). A results file for selected floodplain nodes was created. For each of the contiguous floodplain sites (which incorporate the major pans in Table 2), site-specific 25 m-gridded DEM data were generated. These were combined with stage levels to compute 56 site-specific geometric data files, with each containing tabulated relationships between stage and the following 10 parameters:
•Pan/s: inundated area, average depth, area with depth range 1.0-1.5 m, and area with depth range greater than 1.0 m
•Floodplain: inundated area and area with depth range 0.2-1.0 m
•Pan/s and floodplain: inundated volume, area, average depth and area with depth range 0.2-0.6 m
Geometric relationships were then combined with daily stage time series (for selected nodes per site) to generate site-specific time series for each of the 10 parameters listed above. Example excerpts from the results files, which are the hydrodynamic basis for further analyses in DRIFT, are given in DWS (2015b). Maximum retention levels for the pans provide the spatial delineation between pan and floodplain inundation. The depth ranges (or classes) used above were identified as constituting critical (hydraulic) habitat for indicator vegetation species and/or fish guilds (see Brown et al., 2018)
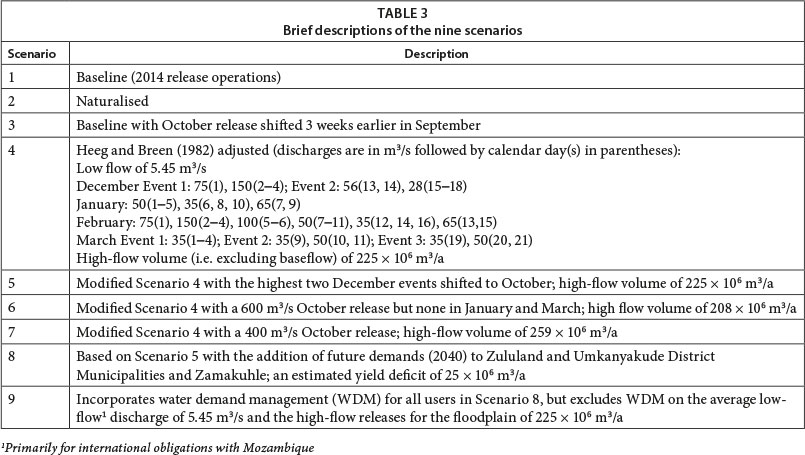
Scenarios
Seven potential future water-use scenarios (Table 3) were constructed and their time series of daily releases from the Jozini Dam modelled by Aurecon (DWS, 2015a). The first 5 scenarios (Scenarios 3 to 7) include the same existing demands (inter-catchment transfers, irrigation and municipal/domestic), but coupled with different high-flow release patterns for the downstream floodplain. This allowed the impacts of different flow releases on the ecological condition and linked sociological use of the floodplain to be assessed (using DRIFT). The additional two scenarios (8 and 9) include future demands (2040) with Scenario 3's socio-ecological flow regime.
The suggested flow pattern of Heeg and Breen (1982) has been used as the basis for Scenario 4 and modifications of it (Scenarios 5 to 7). Heeg and Breen (1982 p. 87) provided the following description of flow patterns for the Pongola Floodplain, noting that experimental changes for optimisation should follow:
1.'Raise to flood all pans in December, hold 3 days, drop to normal river level to drain and follow by 2 days at 56 cumec flow and 4 days at 28 cumec flow. This should affect flushing and allow fish migration.
2.Raise to flood Tete [Pan], oscillate water level about this point to flood subsistence lands. Such oscillations would probably range between flooding Mthikeni at highest level and maintaining the Namanini-Bumbe-Ngodo complex at high flood level, and can probably, with the use of inflatable weirs, be done on base flow and overspill alone, although some water release may be necessary.
3.Raise level to flood all pans during February, hold for 5 days and return to 2 above.
4.Drop to level of Namanini-Bumbe-Ngodo during March. Oscillate about this point, raising to level of Tete [Pan] perhaps once or twice.
5.Unimpeded flow April - November.'
Heeg and Breen (1982) estimated this annual release at 41 × 106 m3/a, and allude to the principal of adaptive management concerning the effect of this release pattern on the environment, agricultural and other developments. The levels and flows suggested result in a substantially higher volume than their estimate, and there is also no clear indication what constitutes 'normal river levels', 'base' and 'unimpeded flows'. It needs to be noted that these recommendations pre-date instream flow requirements for river maintenance, which was first addressed nationally in 1987 through two workshops (Ferrar, 1989; Bruwer, 1991). The high flow volume is 225 × 106 m3/a, calculated from the differences between daily releases and a low flow of 5.45 m3/s to meet international obligations with Mozambique. Environmental water requirements (EWR) estimated using the Reserve Desktop Model (Hughes and Münster, 2000) for an Ecological State C, range between 2.4 and 6.4 m3/s for maintenance low flows, which are close to the values given by Hughes (2000) of 2.1 and 6.6 m3/s.. The release to meet international obligations accounts for 172 × 106 m3/a, whilst a constant release of 2.4 m3/s requires 66 × 106 m3/a. All other demands (viz. inter-catchment transfers, irrigation and domestic/municipal) account for 117 × 106 m3/a.
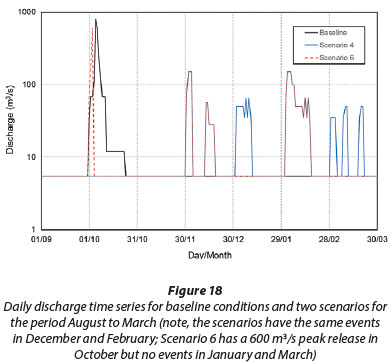
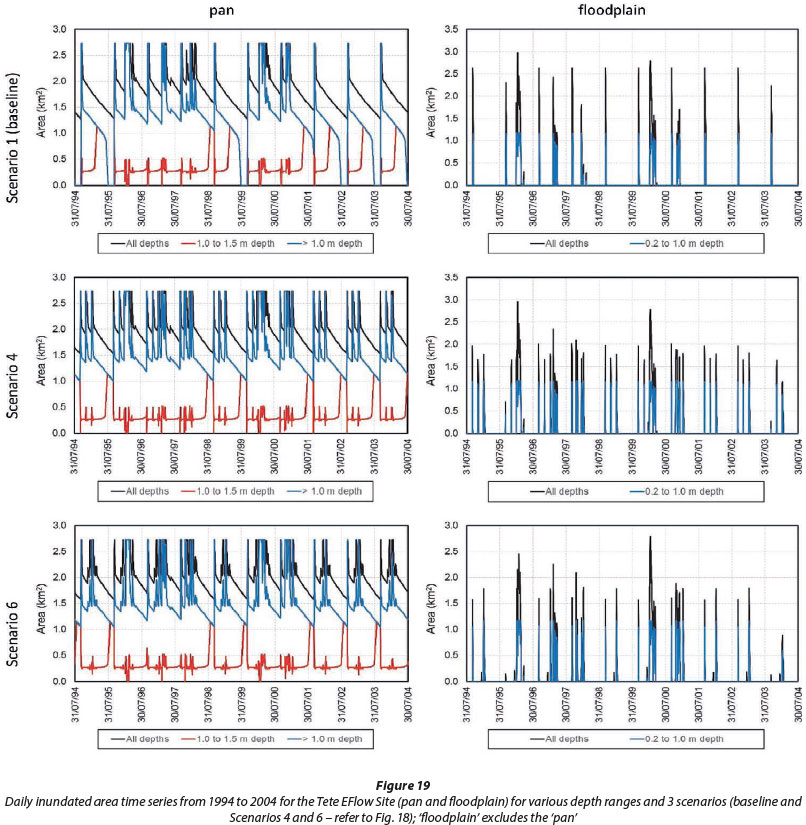
The hydrodynamic model was used to simulate downstream inundation for the nine hydrological scenarios in Table 3, with tributary and Usuthu River flows maintained at the historical (PD) situation. Of these scenarios, two selected ones (for clarity), together with baseline conditions (viz. essentially the October release) are plotted in Fig. 18. Example time-series plots of inundated area for the Tete EFlow (environmental flow) Site (pan and floodplain) for five selected hydraulic parameters and three scenarios including baseline, are provided in Fig. 19. Hydraulic parameters provide drivers for ecosystem indicators and were used in the DRIFT DSS described by Brown et al. (2018). For example, couch grass (Cynodon dactylon) is optimally inundated by pan water depths in the range 1.0 to 1.5 m; flood-dependent benthic fish guilds are linked to the number of days that floodplain water depths are in the range 0.2 to 1.0 m.
SUMMARY AND RECOMMENDATIONS
Four computational Pongola Floodplain models have been developed since 1979, including cell-based, 1d and 2d approaches. The varied successes of previous modelling studies attest to this ambitious task, given that the ~130 km2 system is characterised by a complex mosaic of meandering river channels, levees, and floodplains interspersed with numerous pans (~150 identified by La Hausse, 1987) and wetlands.
The RMA2 2d model used in this study was parameterised and calibrated using existing information, including: a bathymetric survey and the national 25 m-resolution DEM; discharge records from the Pongola River downstream of Jozini Dam, and from two stations on the Usuthu River; and stage records from two river stations along the lower Pongola River and from four pans within the floodplain. Stage records from the period 2008 to 2010 were used for model calibration and verification, and verification produced generally good replications in terms of peaks, rising and recession limbs, recession of ponded pan water-levels, and low-flow river stages. The RMA2 modelling represents an advancement of previous hydrodynamic studies and contributes to an improved understanding of the floodplain's hydraulic behaviour. Based on this study, RMA2 was subsequently used to model the hydrodynamics of the 594 km2 Elephant Marsh Ramsar site in Malawi, described by Birkhead et al. (2017).
Two-dimensional modelling of topographically and hydraulically complex floodplain systems, such as the Pongola, requires an accurate DEM. Any further sensible improvements to the modelling would require a more accurate floodplain survey, such as that provided by light detection and ranging (LiDAR). After this study was completed, the existence of LiDAR data for the Usuthu River and adjacent wetlands and pans was noted, but post-dated its use. Improved model calibration would be achieved by monitoring stage fluctuations in additional major pans, in response to regulated release patterns. This could be accomplished by using temporarily installed (inexpensive) loggers.
Model application was for the 15-year period 1990 to 2004, and simulations included naturalised, present management (2014), and 7 potential dam operational scenarios. Results were post-processed to provide tabulated daily time series for 11 hydraulic parameters for 56 contiguous EFlow sites - which incorporate pan, floodplain and combined regions. The hydraulic parameters included average depth; inundated area; inundated area with a specific depth range; and inundated volume.
The companion paper by Brown et al. (2018) describes a holistic EFlows assessment using DRIFT, that analysed the various flow permutations (scenarios) to recommend an environmentally and socially sustainable management option for the floodplain.
ACKNOWLEDGEMENTS
The successful development of the RMA2 hydrodynamic model for the Pongola River and Floodplain was most reliant on the advice and guidance of Ian King, and his resolute commitment to make refinements to the source code to enhance its application in this study. His efforts and enthusiasm are greatly appreciated. We also acknowledge the Department of Water and Sanitation, specifically Mark Kempen for extracting available information on the floodplain and fielding numerous queries; Jane Mogaswe, Elias Nhlapo and Mangaroo Natasha for hydrological data; Beason Mwaka and Celiwe Ntuli for providing data from the Basson et al. (2006) study; the Chief Directorate National Geo-spatial Information (Department of Rural Development and Land Reform), specifically Sue Kirschner, for DEM data and supporting documentation; the daily hydrology used in the model application was provided Anton Sparks (Aurecon, South Africa); the Swaziland Department of Water Affairs, specifically Petros Simelane for supplying observed records for gauges on the Usuthu River; and Mike Coke for providing literature from the 1970s and 1980s, photographs from the late-1960s, and background to the historic calculations for initiation of pan inundation. We also thank two anonymous reviewers for their positive and helpful critiques.
ACRONYMS
cumec m3/s
CFGEN ConFig GENerator
EFlow environmental flow
MRL maximum retention level
PD present day
RMA Resource Management Associates
RMAPLT RMA PLoT
RMAGEN RMA geometry GENerator
× 106 m3/a million cubic metres per annum
REFERENCES
AKL F, EL-AZIZY I, AZEEM AM and NASSER GA (2016) Environmental hydrodynamics mitigation of Burullus Lake in Egypt. Int. J. Sci. Eng. Invest. 5 (59) 83-90. URL: http://www.ijsei.com/archive-55916.htm (Accessed 1 June 2017) [ Links ]
ANDERSON RL (2009) Fluvial dynamics of the Usuthu River and Banzi Pan, Ndumu Game Reserve. BSc. Hons dissertation, University of Pretoria. [ Links ]
BASSON GR, DENYS F and BECK JS (2006) Pongolapoort Dam flood releases operational analysis: Socio-hydrological investigation, historical flood releases and mathematical modelling. Report to the Department of Water Affairs and Forestry, Pretoria on Project 2003-321 by ASP Technology (Pty) Ltd. 130 pp. [ Links ]
BASSON GR (2011) Investigation of mitigation measures for the Usuthu River breach at Ndumo which affects the international border between South Africa and Mocambique: River Hydraulics and Fluvial Morphology. Report to Beuster, Clarke and Associates by ASP Technologies (Pty) Ltd. 22 pp. [ Links ]
BECK JS and BASSON GR (2003) The hydraulics of the impacts of dam development on the river morphology. WRC Report No. 1102/1/03. Water Research Commission, Pretoria. [ Links ]
BIRKHEAD AL, REINECKE MK and BROWN CA (2017) Climate resilient livelihoods and sustainable natural resources management in the Elephant Marsh, Malawi - hydromorphology. Streamflow Solutions cc and Southern Waters Ecological Research and Consulting cc in association with MRag (UK). https://doi.org/10.13140/rg.2.2.31459.04640 [ Links ]
BROWN C, JOUBERT A, TLOU T, BIRKHEAD A, MARNEWECK G, PAXTON B and SINGH, A (2018) The Pongola Floodplain, South Africa - Part 2: Holistic environmental flows assessment. Water SA 44 (4) 746-759. [ Links ]
BRUWER C (ed) (1991) Flow Requirements of Kruger National Park Rivers. Department of Water Affairs and Forestry, Technical Report TR149. DWAF, Pretoria. 141 pp. [ Links ]
COKE M (1970) The water requirements of the Pongola Floodplain Pans. Proc. 1970 "Water for the future" Convention, Pretoria. [ Links ]
DONNEL BP (2011) Users Guide to RMA2 WES Version 4.5. US Army, Engineer Research and Development centre, Waterways Experiment Station, Coastal and Hydraulics Laboratory. 298 pp. [ Links ]
DWA (Department of Water Affairs, South Africa) (1987) Mathematical model of the hydraulics of the Pongola River Flood Plain. DWA, Pretoria. [ Links ]
DWA (Department of Water Affairs, South Africa) (2012) 2012 flood release at Jozini Dam. Department of Water Affairs, Hydrology KZN Midmar Dam. DWA, Pretoria. 15 pp. [ Links ]
DWAF (Department of Water Affairs and Forestry, South Africa) (2000) Preliminary Reserve and Resource Class determination for Quaternary Catchment W44E. DWAF, Pretoria. [ Links ]
DWAF (Department of Water Affairs and Forestry, South Africa) (2008) Artificial flood release at Pongolapoort Dam 2008 - Hydro activities. DWAF, Pretoria. 34 pp. [ Links ]
DWS (Department of Water and Sanitation, South Africa) (2015a) Resource Directed Measures: Reserve determination study of selected surface water and groundwater resources in the Usutu/Mhlathuze Water Management Area. Hydrology Specialist Report. Prepared by Tlou Consulting (Pty) Ltd. Authors: Görgens A, Howard G and Sparks A (Aurecon South Africa (Pty) Ltd) [ Links ]
DWS (Department of Water and Sanitation, South Africa) (2015b). Resource Directed Measures: Reserve determination study of selected surface water and groundwater resources in the Usutu/Mhlathuze Water Management Area. Pongola Floodplain - EWR Report. Prepared by Tlou Consulting (Pty) Ltd. Authors: Brown C, Birkhead A, Joubert A, Tlou T, Marneweck G, Paxton B and Singh A. Appendix B: Example of post-processing results. DWS, Pretoria. 233 pp. [ Links ]
FERRAR AA (ed.) (1989) Ecological Flow Requirements for South African Rivers. South African National Scientific Programmes Report Number 162. Council for Scientific and Industrial Research, Pretoria. 118 pp. [ Links ]
FULTON JW and WAGNER CR (2014) Calibration of a two-dimensional hydrodynamic model for parts of the Allegheny, Monongahela, and Ohio Rivers, Allegheny County, Pennsylvania. US Geological Survey Scientific Investigations Report. 2013-5145. 41 pp. [ Links ]
HAN DH (2014) Computer simulation of sea water pollution. Int. J. Environ. Monit. Anal. 2 (5) 266-271. https://doi.org/10.11648/j.ijema.20140205.16 [ Links ]
HEEG J and BREEN CM (1982) Man and the Pongolo Floodplain. A report of the Committee for Inland Water Ecosystems National Programme for Environmental Sciences. South African National Scientific Programmes Report no. 56. June 1982. 117 pp. Council for Scientific and Industrial Research, Pretoria. URL: http://hdl.handle.net/10204/2417 (Accessed 1 June 2017). [ Links ]
HUGHES DA (2000) Desktop Reserve determination for the Pongola River downstream of the Pongolapoort Dam. Specialist report to the Preliminary Reserve and Resource Class determination for Quaternary Catchment W44E. Department of Water Affairs and Forestry, Pretoria. 5 pp. [ Links ]
HUGHES DA and MÜNSTER F (2000) Hydrological information and techniques to support the determination of the water quantity component of the Ecological Reserve for rivers. WRC Report No. TT 137/00. Water Research Commission, Pretoria. [ Links ]
JONES DA (2011) The transition from earlier hydrodynamic models to current generation models. Master of Science, Department of Civil and Environmental Engineering, Brigham Young University. 108 pp. URL: https://ceen.et.byu.edu/sites/default/files/snrprojects/623-douglas_a_jones-2011-ejn.pdf (Accessed 1 June 2017). [ Links ]
KEMPEN M (2014) Personal correspondence, 2 October 2014 to 23 February 2015. Mr M Kempen, Department of Water and Sanitation, Midmar Dam, Kwazulu-Natal, South Africa. [ Links ]
KING IP (2017) Resource Modelling Associates: The RMA Modelling Suite - latest release and demo information, overview, history, references, user documents and technical aspects. URL: http://ikingrma.iinet.net.au/ (Accessed 1 June 2017). [ Links ]
KING J and LOUW D (1998) Instream flow assessments for regulated rivers in South Africa using the Building Block Methodology. Aquat. Ecosyst. Health Manage. 1 (2) 109-124. https://doi.org/10.1016/S1463-4988(98)00018-9 [ Links ]
LA HAUSSE de LALOUVIÉRE P (1987) A toponymic survey of the waterbodies of the Uphongola (Pongola) Floodplain area, northern Zululand. INR Working Paper No. 24. Institute of Natural Resources, University of Natal, Pietermaritzburg. [ Links ]
LANKFORD B, PRINGLE C, DICKENS C, LEWIS F, CHHOTRAY M, MANDER M, GOULDEN M, NXELE Z and QUAYLE L (2010) The impacts of ecosystem services and environmental governance on human well-being in the Pongola region, South Africa. Report to the Natural Environment Research Council. University of East Anglia and Institute of Natural Resources, London, Norwich, UK and Pietermaritzburg, South Africa. 140 pp. https://doi.org/10.1080/09640568.2011.567127 [ Links ]
LEE J-S and JULIEN PY (2012) Utilizing concept of vegetation freeboard equivalence in river restoration. Int. J. Contents 8 (3) 34-41. https://doi.org/10.5392/IJoC.2012.8.3.034 [ Links ]
LE ROUX F (2008) Report on the Pongolapoort Acoustic Doppler Regatta 2007. Department of Water Affairs and Forestry, Division Hydrometry - Gauteng Region. 19 pp. [ Links ]
MARNEWECK G (2014) Personal correspondence, 13 November 2014 to 16 March 2015. Mr G Marneweck, Wetland Consulting Services (Pty) Ltd, Pretoria, South Africa. [ Links ]
NGI (2011) Standard for Digital Elevation Model Data. Chief Directorate National Geo-spatial Information, Department of Rural Development and Land Reform. Doc. ref. QLAS.SD.3_v1. 14 pp. NGI, Cape Town. [ Links ]
NORTON WR, KING IP and ORLOB GT (1973) A finite element model for Lower Granite Reservoir. Report prepared for the Walla Walla District, US Army Corps of Engineers, Walla Walla, Washington. [ Links ]
PHÉLINES RF, COKE M and NICOL SM (1973) Some biological consequences of damming the Pongola River. Commission Internationale Des Grands Barrages, Madrid, 1973. 173-189. [ Links ]
PITMAN WV and WEISS HW (1979) A numerical hydraulic model of the Pongola flood plain. Report no. 2/79. Hydrological Research Unit, University of Witwatersrand, Johannesburg. 32 pp. [ Links ]
RSA (Republic of South Africa) (1998) National Water Act. Act No. 36 of 1998. Government Gazette 19182. Government Printer, Cape Town. [ Links ]
SALOMON LDA (2010) Study for the implementation of the permanent solution in the Lower Usuthu Breach. Supported by Beuster, Clark and Associates; Técnica and UEM. Draft Inception Report. 42 pp. Salomon LDA, Maputo, Mozambique. [ Links ]
SALOMON LDA (2011) Study for the Implementation of the Permanent Solution in the Lower Usuthu Breach. Supported by Beuster, Clark and Associates; Técnica and UEM. Draft Design Report. 73 pp. [ Links ]
SAMMANY MS and MOUSTAFA AM (2011) Adaptation of surface water modelling system for sediment transport investigations in Lake Nassar. Nile Basin Water Sci. Eng. J. 4 (1) 71-85. [ Links ]
SHEWCHUK JR (undated) Triangle: Engineering a 2D Quality Mesh Generator and Delaunay Triangulator. School of Computer Science, Carnegie Mellon University. URL: http://www.cs.cmu.edu/~quake/triangle.html (Accessed 1 June 2017). [ Links ]
TONYES SG, WASSON RJ, MUNKSGAARD NC, EVANS KG, BRINKMAN R and WILLLIAMS DK (2017) Understanding coastal processes to assist with coastal erosion management in Darwin Harbour, Northern Territory, Australia. IOP Conf. Ser.: Earth Environ. Sci. 55. https://doi.org/10.1088/1755-1315/55/1/012012 [ Links ]
TPTC (Tripartite Permanent Technical Committee) (2011) PRIMA IAAP 10: System Operating Rules for the Incomati and Maputo Watercourses. Report by Aurecon South Africa to the Tripartite Permanent Technical Committee. TPTC, Pretoria. [ Links ]
VAN VUUREN L (2009) Pongolapoort Dam: development steeped in controversy. The Water Wheel 8 (3) May/June 2009 23-27. [ Links ]
VETSCH D, ROUSSELOT P, VOLZ C, VONWILLER L, PETER S, EHRBAR D, GERBER M, FAEH R, FARSHI D, MUELLER R and VEPREK R (2014) BASEMENT, Version 2.4. Laboratory of Hydraulics, Glaciology and Hydrology (VAW). ETH Zurich. URL: http://www.basement.ethz.ch/ (Accessed 1 June 2017). [ Links ]
WADESON R (2006) Lower Usuthu River - Diversion Channel Scoping Report. Report Prepared for the Department of Water Affairs and Forestry of South Africa. November 2006. DWAF, Pretoria. [ Links ]
WRC (Water Research Commission, South Africa) (2017) Water Resources of South Africa, 2012 study (WR2012). URL: https://waterresourceswr2012.co.za (Accessed 1 June 2017). [ Links ]
WHITTINGTON M, MALAN G and PANAGOS MD (2013) Trends in waterbird diversity at Banzi, Shokwe and Nyamithi pans, Ndumo Game Reserve, South Africa. Ostrich 84 (1) 2. [ Links ]
WURBS RA (1994) Computer models for water resources planning and management. Report for the US Army Corps of Engineers, IWR Report 94-NDS-7. URL: http://www.dtic.mil/cgi-bin/GetTRDoc?AD=ADA295807 (Accessed 1 June 2017). 218 pp. [ Links ]
YIN Y, QI YQ, MAO QW, TONG JQ and YU HB (2010) Numerical simulation of tidal current In Zhanjiang Harbor using SMS/RMA2 Model. The Twentieth International Offshore and Polar Engineering Conference, 20-25 June 2010, Beijing. China International Society of Offshore and Polar Engineers. URL: http://www.isope.org/publications/proceedings/ISOPE/ISOPE%202010/data/toc.htm (Accessed 1 June 2017). [ Links ]
Received 25 August 2017
Accepted in revised form 27 September 2018
* To whom all correspondence should be addressed. e-mail: streamflow@icon.co.za

