


Services on Demand
Article
 English (pdf)
 Article in xml format
 Article references
Indicators

Related links
-
 Cited by Google
 -
 Similars in Google
Share

 Permalink
Water SA
On-line version ISSN 1816-7950
Print version ISSN 0378-4738
Water SA vol.44 n.4 Pretoria Oct. 2018
http://dx.doi.org/10.4314/wsa.v44i4.12
ORIGINAL ARTICLES
Monitoring water use efficiency of irrigated sugarcane production in Mpumalanga, South Africa, using SEBAL
A Singels I, II, III, *; C JarmainII, IV; E Bastidas-ObandoV, VI; FC OlivierI; AL ParaskevopoulosI
ISouth African Sugarcane Research Institute, Private Bag X02, Mount Edgecombe, 4300, South Africa
IISchool of Agricultural, Earth and Environmental Sciences, University of Kwazulu-Natal, Private Bag X01, Scottsville, 3209, South Africa
IIIDepartment of Plant and Soil Sciences, University of Pretoria, Private Bag X20, Hatfield 0028, South Africa
IVCentre for Geographical Analysis (CGA), Department of Geography and Environmental Studies, University of Stellenbosch, Private Bag X1, Matieland, Stellenbosch, 7600, South Africa
VeLEAF, Hesselink van Suchtelenweg 6, 6703 CT Wageningen, The Netherlands
VIDelft University of Technology, Stevinweg 1, 2600 GA Delft, The Netherlands
ABSTRACT
The objective of this study was to assess the accuracy, spatial variation and potential value of remote sensing (RS) estimates of evapotranspiration (ET) and biomass production for irrigated sugarcane in Mpumalanga, South Africa. Weekly ET and biomass production were estimated from RS data from 2011 to 2013 using the Surface Energy Balance Algorithm for Land (SEBAL). Ground estimates of canopy interception of photosynthetically active radiation (FPAR) and aerial biomass were compared to RS estimates. ET was estimated with a surface renewal (SR) system in one field. Evaporation coefficient (Kc) values were calculated from ET and reference grass evaporation. Remote sensing FPAR and biomass estimates compared well with field measurements (R2 = 0.89 and 0.78). SEBAL ET estimates exceeded SR estimates by 5 mm/week, while full canopy Kc values for SEBAL compared better with literature values than with SR Kc values. SEBAL estimates of ET and biomass were regarded as reliable. Considerable spatial variation was observed in seasonal RS ET (1 034 ± 223 mm), biomass (45 ± 17 t/ha) and biomass water use efficiency (WUEBIO, defined as dry biomass produced per unit of ET) (4.1 ± 1.0 kg/m3). About 32% of sugarcane fields had values below economic thresholds, indicating an opportunity to increase productivity. Actual yields correlated well with WUEBIO values, suggesting that this may be used for monitoring crop performance and identifying areas that require remedial treatment.
Keywords: remote sensing, sugarcane, irrigation, evapotranspiration, biomass, water use efficiency, SEBAL
INTRODUCTION
Worldwide there is a need to use resources for agricultural production more efficiently to promote long-term sustainability of industries and the communities they support. Production of sugarcane, a major food and bio-energy crop, often relies on irrigation, and there is a need to ensure efficient use of valuable irrigation water. Water use efficiency (WUE) can be defined as the amount of crop produced (total biomass or product) per unit of crop water use, or evapotranspiration (ET). Reliable information on recent and current ET, crop growth and WUE are needed to optimize production of irrigated sugarcane. Low ET (i.e. ET below the potential rate as determined by atmospheric evaporative demand) and low crop growth rates could indicate soil water deficit caused by under-irrigation or ineffective irrigation scheduling. Low crop growth rates in the presence of high crop water use rates (low WUE) could be an indication of other yield-limiting factors such as weed, pest and/or disease pressures, or nutrient deficiency. Timeous indications of such conditions can help direct remedial actions.
ET and crop growth can be estimated using crop simulation models with weather and soil water input data measured at a point. However, this method is not widely applied operationally to assist farmers and other users in agricultural water management due to its complexity. It also does not provide spatial information on ET and crop growth over large areas or within fields. Model estimates that use remotely sensed information allow the generation and analysis of spatial information on ET and crop growth. Examples of these are the Surface Energy Balance Algorithm for Land (SEBAL) described by Bastiaanssen et al. (1998) and Mapping Evapotranspiration with Internalized Calibration (METRIC) described by Allen et al. (2007).
There are few examples of this type of application in sugarcane. Yang et al. (1997) estimated sugarcane ET from a remotely-sensed Normalized Difference Vegetation Index (NDVI) and canopy temperature, and found that it was a practical means for assessing within-field variation in sugarcane ET. Immerzeel et al. (2008) used SEBAL estimates of sugarcane ET (resolution of 1 km) for a catchment in south India to calibrate a hydrological model, which was then used to estimate sugarcane WUE (average of 2.9 kg cane/m3 of ET). Hellegers et al. (2009) used SEBAL to estimate ET, biomass production and WUE for several crops, including sugarcane, in the Mpumalanga Province of South Africa (SA). The accuracy of remote sensing (RS) methods for estimating ET and biomass production of sugarcane needs to be assessed through comparison with reliable ground-based estimates, before this technology can be applied confidently to support the operational management of irrigated sugarcane production. Mark and Luckson (2010) claim good agreement between SEBAL estimates of ET with ground measurements for sugarcane in Zimbabwe, but it is not clear how ground estimates were determined. Hernandez et al. (2014) compared sugarcane ET estimates from SEBAL and other RS-based algorithms (Teixeira, 2010) with the weather-based FAO56 method (Allen et al. 1998) and found agreement for full canopy cover ET. RS estimates were higher than FAO estimates for partial canopy cover ET. Ruhoff et al. (2013) compared sugarcane ET estimates from the MOD16 algorithm and MODIS (Moderate Resolution Imaging Spectroradiometer) data to eddy covariance measurements, and found a root mean square error of about 0.5 mm/d, with negligible bias. We could not find any evidence in the literature of ground-truthing of sugarcane biomass RS estimates.
In SA, the sugar industry makes an important contribution to the national economy. In 2014, about 35% of the sugarcane crop was produced under full irrigation in Mpumalanga and in the northern parts of KwaZulu-Natal Province (Singels et al. 2015). SA is a water-scarce country and there is mounting pressure on the limited water available in these areas. Agriculture is subject to increasing scrutiny from policy makers and environmentalists, putting the sugar industry under increasing pressure to demonstrate efficient and effective use of water.
This paper reports on:
-
The accuracy of (i) fractional interception of photosynthetic active radiation (FPAR) estimated from RS reflectance data, and (ii) SEBAL estimates of weekly ET, ET deficit (ETdef, defined as the difference between potential and actual ET) and biomass production (TDM) by comparing them to estimates derived from ground-based measurements
-
The spatial variation of SEBAL estimates of seasonal ET, ETdef, TDM and WUE and their linkage with actual production
-
The potential of using spatial information to support the management of irrigated sugarcane production in Mpumalanga
METHODS
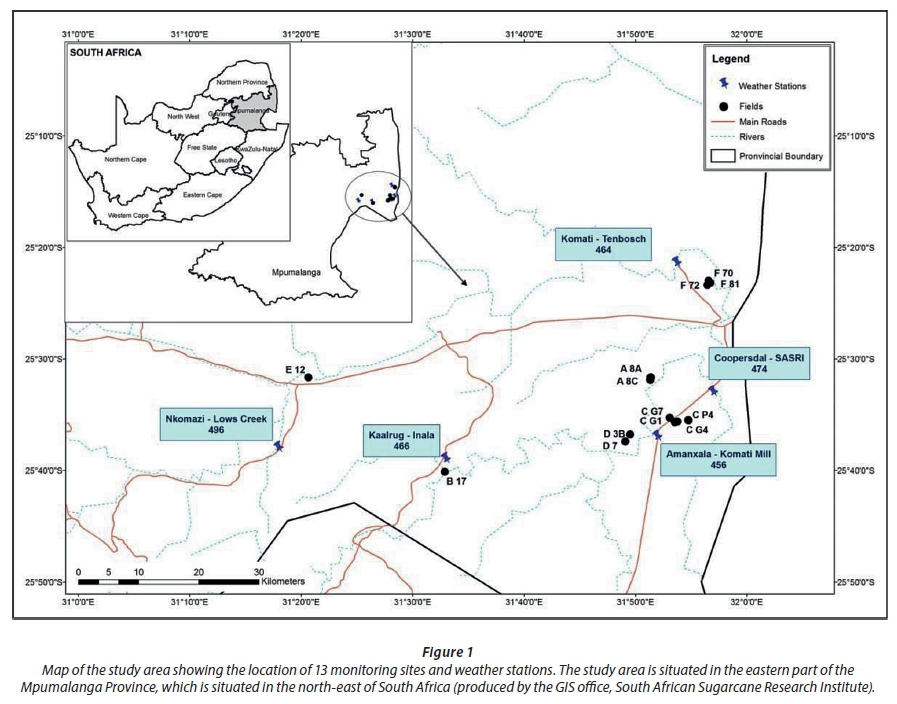
Study area
The sugarcane producing areas in Mpumalanga represented the greater study area. Sugarcane is exclusively produced under irrigation in this area, and cane is delivered to the Malalane and Komati mills, operated by RCL Foods. The area is characterized by very hot summers and mild winters, with a mean annual rainfall and evaporation (FAO grass reference, Allen et al. 1998) of about 600 and 1 350 mm, respectively.
There were over 4 000 fields of sugarcane in the study area in 2012, varying in size from hundreds of hectares to less than 5 ha. The average field size is 8.7 ha. Crops are typically harvested in the dry period between April and December, inclusive, at a crop age of about 12 months. Crops are irrigated with a variety of systems (portable overhead, centre pivot and drip) using water from the Crocodile, Komati and Lomati rivers. These have annual irrigation allocations of 1 300, 995 and 850 mm, respectively, when water supply is adequate.
Field monitoring
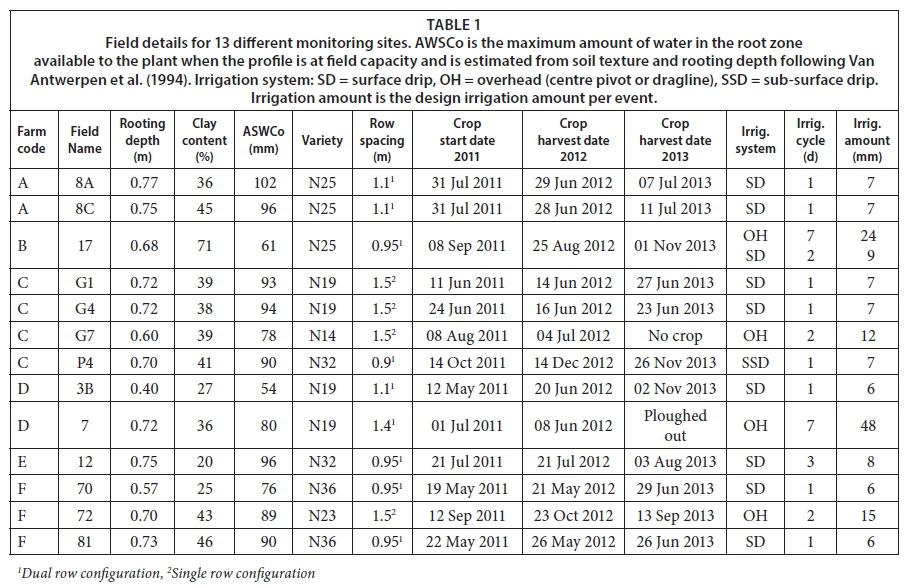
Thirteen sugarcane fields in the study area (Fig. 1, Table 1) were selected for monitoring crop growth and soil water status over the study period. Daily ET was measured in one field (Field G1 on Farm C) from December 2011 to December 2012.
Evapotranspiration
The surface renewal (SR) method (Mengistu and Savage, 2010) was installed in Field G1 (Farm C) to estimate sugarcane ET from 1 December 2011 to 21 November 2012 (51 weeks). The SR method estimates the sensible heat flux density (H) and, combining this with measurements of net radiation (Rn) and soil heat flux (G), the latent energy (LE) (and ET) is estimated as a residual using the shortened energy balance equation:
LE = Rn - G - H (1)
H was estimated following Jarmain et al. (2009) as:
H = α ρ Cp [a/(s+l)] z (2)
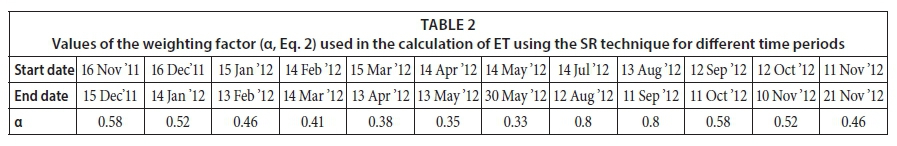
where α is the weighting factor (dimensionless), z the measurement height (in m), Cp the specific heat capacity of air at constant pressure (J·kg-1·K-1), ρ the density of air (kg·m-3), a and s+l are the amplitude (in °C), and inverse ramp frequency (in s) as determined from air temperature structure functions (Van Atta, 1977).
High frequency (8 Hz) measurements of air temperature were performed using unshielded and naturally ventilated fine-wire thermocouples (0.75 µm). Temperature structure functions (Van Atta, 1977) were formed by lagging temperature data by 0.4 s for cane lower than 1 m (14 Sep 2012) and by 0.8 s for cane higher than 1 m (Eltayeb, 2010; Mengistu and Savage, 2010). Monthly values of α ranged from α = 0.8 for young cane to α = 0.33 for old cane (see Table 2). The α values for cane younger than 3 months (14 Jul 12 - 11 Sep 12) were based on a calibration against OPEC (open path eddy covariance) ET estimates conducted on Field G1 over the period 25 July to 17 September 2012 (Jarmain et al., 2014). Values for older cane were derived from unpublished data (Olivier, 2014).
SR equipment was non-functional for 14 weeks out of the 51-week period. For these periods ET data were estimated using the linear relationship between available SR ET data and the corresponding FAO56 grass reference evaporation (Eo, Allen et al., 1998), calculated from daily data captured at a nearby weather station (Komati SASRI research farm, 25.55°S; 31.95°E about 7 km from Field G1). The crop evaporation coefficient (Kc, defined as the ratio between ET and Eo), was also calculated for the period with available ET data and compared to published values.
Crop growth
FPAR is defined as the fraction of incoming PAR that is absorbed by the green canopy and can be estimated on the ground by measuring incoming PAR radiation (PARi), PAR transmitted through the crop canopy (PARt) and PAR reflected by the crop surface (PARr):
FPAR = (PARi - PARt − PARr)/PARi (3)
FPAR can also be expressed as a function of the fractions of incoming radiation that is transmitted (TPAR) and reflected (RPAR):
FPAR = 1 - TPAR - RPAR (4)
where TPAR = PARt/PARi and RPAR = PARr/PARi. PARi and PARt were measured using a portable line quantum sensor (Model AccuPAR LP80, Decagon Devices, Pullman, USA) at approximately monthly intervals in 3 positions in each of the validation fields. One reading of PARi and 10 readings of PARt were taken per position. PARr was not measured and it was assumed that it equalled 0.08 of the fraction of PAR that was not transmitted through the green canopy (1 - TPAR), based on unpublished observations (Tweddle, 2017). Ground estimates of FPAR were therefore calculated using Eq. 5:
FPAR = (1 - 0.08) (1 - TPAR) (5)
Aboveground biomass components were sampled destructively 2 to 3 times throughout the growing season in each field. Three 5 m row sections were randomly selected to determine the stalk population. Within each section, 5 representative cane stalks were cut and removed. Biomass samples were partitioned into leaf material and millable stalk material. Fresh samples of each component were weighed. Sub-samples of these were weighed, dried and weighed again to determine the dry matter content of each component. Dry leaf mass and dry stalk mass were calculated as the product of fresh mass and dry matter content of the relevant component. Dry above-ground biomass (ADM) was taken as the sum of dry leaf mass and dry stalk mass. At harvest, cane yield (fresh mass basis) was determined from mill delivery data. Delivered cane was analysed for dry matter content, which allowed the derivation of stalk dry mass yield.
A preliminary investigation showed that that the average cane yield for a field, as determined from mill deliveries, were mostly significantly lower than the cane yield determined from destructive samples taken from selected spots in the field, prior to the actual harvest. This was an indication that there were areas in the field that had lower ADM yields, and that the field-sampled estimates of average yields of the different biomass components (stalk and leaf mass) were overestimated. It was therefore deemed necessary to adjust observed ADM data. This was done by multiplying the observed ADM value for a given field by the average (over the two seasons) ratio of mill determined cane yield to the last field sample of cane yield taken. If the time difference between the last sample and the harvest date for a given field and season was more than one month, the adjustment ratio determined for the other season for that field was used. This was the case for 4 fields in 2012. In one case (Field 7) no suitable field sample data were available to estimate an adjustment factor, and the overall average adjustment factor for all fields (0.78) was used.
Soil water content
Soil water status were monitored with capacitance probes from Aquacheck (Pty) Ltd (Durbanville, SA) in all fields listed in Table 1. Probe installation and data capture and processing to produce daily average plant available soil water content for the soil profile (ASWC) are fully described by Paraskevopoulos and Singels (2014). The ASWC data were used to calculate a drought stress index (DSI) and a waterlogged stress index (WLI):
DSI = 1/N Σ (١ - Fvd) (6)
Fvd = ASWC/(0.5 ASWCo) with Fvd ≤ 1 (7)
WLI = 1/N Σ (١ - Fvw) (8)
Fvw = (SAT - ASWC)/(SAT - ASWCo)
when ASWCo ≤ ASWC ≤ SAT (9)
where N is the number of days with measured probe data within a given week (usually 7), SAT and ASWCo are the available water contents at saturation and field capacity respectively, and Fvd and Fvw represent the severity of drought and waterlogging stress, respectively (1 = no stress, 0 = severely stressed) on a given day.
Other field data
Agronomic information for the 2011/12 and 2012/13 seasons for all sugarcane fields in the Malalane and Komati mill supply areas were obtained from RCL Foods, while associated geographic information (field boundary data) were obtained from the SA Cane Growers' Association (Mpumalanga office).
Remote sensing
The SEBAL model was used to produce weekly datasets of ET, ETdef, ΔTDM, TDM and WUE (here defined as above-ground plus below-ground dry biomass produced per unit of ET, and renamed WUEBIO) for the period 3 November 2011 to 31 October 2012 for the greater study area. Weekly datasets were produced for sugarcane validation fields (Table 1) from 1 November 2012 to 2 October 2013. FPAR was also estimated for the validation fields at weekly intervals, for the period 3 November 2011 to 2 October 2013.
The SEBAL model
The SEBAL model calculates actual ET as the latent heat flux (LE) component of the surface energy balance (Eq. 1). The methodological framework for calculating each component of the energy balance equation is described by Zwart and Bastiaanssen (2007). Land surface temperature information at 30 m resolution is used to select the 'cold' pixels that correspond with H = 0 for water bodies and 'hot' pixels that correspond with H = Rn - G for bare, dry soil. The Penman-Monteith equation (Allen et al., 1998) is subsequently inverted to estimate surface resistance and subsequently 'actual' ET (mm/week). Potential ET (mm/week) is calculated assuming minimum surface resistance for well-watered conditions. The difference between potential ET and actual ET gives ETdef (mm/week).
Biomass production (ΔTDM in t/ha per week) in SEBAL is based on the absorbed photosynthetically active radiation and light use efficiency (ε in g/MJ) defined as:
ΔTDM = FPAR · PAR · ε · 10-2 (10)
FPAR is typically derived from the NDVI. Linear relationships were proposed by Asrar et al. (1984) for wheat, and by Bastiaanssen and Ali (2003) and Johnson and Trout (2012) for a variety of crops. Morel et al. (2014) and Zhang et al. (2015) reported linear regressions for sugarcane (FPAR = 1.383 NDVI - 0.333 and FPAR = 1.312 NDVI - 0.19, respectively). In this paper the equation from Bastiaanssen and Ali (2003) was used:
FPAR = -0.161+ 1.257 NDVI (11)
Parameter ε in Eq. 11 is the product of the maximum light use efficiency under optimal conditions (ε ' in g/MJ) and surface resistance scalar that accounts for the effects of suboptimal temperature and water status. The value of ε ' (3.7 g/MJ) was determined through trial and error calibration on ground estimates of ADM for the 2011/12 season.
SEBAL input data
SEBAL requires information captured in the visible, near-infrared (NIR) and thermal infrared range of the electromagnetic spectrum, spatially extrapolated (gridded) meteorological data and a digital elevation map as inputs.
Data from the Disaster Monitoring Constellation (DMC) sensor (reference) were combined with data from the MODIS and other satellites to calculate ancillary data such as incoming radiation.
The DMC sensor acquired data for the study area at a 22 m spatial resolution in the visible (green, red) and NIR ranges. The DMC data were resampled to 30 m spatial resolution and used to calculate the surface albedo and NDVI. An investigation revealed that atmospherically corrected NDVI values derived from DMC (NDVIDMC) differed slightly from NDVI values derived from Landsat 7 Enhanced Thematic Mapper Plus (ETM+) surface reflectance data products (NDVILS7). This difference was observed when matching field average values from 9 DMC cloud-free images with 9 Landsat 7 ETM+ images captured within 3 days of the DMC capture date, over the period March 2012 to June 2013. A relationship between NDVIDMC and NDVILS7 (NDVILS7 = (NDVIDMC + 0.0334)/0.9003, R2 = 0.95 n = 91) was used to adjust the NDVIDMC values used for estimating FPAR.
Composites images for 14-day periods were produced from available DMC images for the periods 1 November to 31 October 2012 (26), 13 December 2012 to 26 December 2012 (1) and 14 February 20 to 3 to 11 September 2013 (15). For the other periods, DMC images were not available. Data from the last available composite image were used for these. Pixels with clouds were visually identified and manually removed from each composite image.
MODIS land surface temperature data acquired at 1 km spatial resolution were resampled to 250 m resolution, after which the relationship of surface albedo and adjusted NDVI values derived at 30 m, with thermal information at 250 m, was used to scale the land surface temperature to 30 m resolution. Images were acquired at weekly intervals from 1 November 2011 to 2 October 2013. For the 100 weeks covering this period, 75 MODIS images were with cloud-free information for the study area. For the remaining 25 weeks with cloud cover, MODIS thermal information from the most recent cloud-free week were used. The images are described in Dost (2013).
Meteorological data (temperature, relative humidity and wind speed) for 9 weather stations were taken from the National Oceanic and Atmospheric Administration (NOAA) database (details in Jarmain et al., 2014). The data were interpolated for the study area and used as input variables in the Penman-Monteith equation for deriving the surface resistance and for calculating ET.
Analysis of remotely sensed data
For the comparison of RS estimates of FPAR, ET, ETdef and TDM estimates against ground measurements, the SEBAL weekly raster data were first transformed to field average values. Field average weekly ΔTDM was then accumulated over the relevant growing period to derive TDM values, with the initial value set equal to the first ground measurement in 2011. Accuracy of RS estimates was assessed by visual and statistical comparison with ground estimates.
For regional analysis of SEBAL output data for the entire sugarcane producing area, the weekly raster data were summed over the period 3 November 2011 to 31 October 2012 for ET, ETdef and ΔTDM and averaged for WUEBIO.
SEBAL data were also compared to observed cane yield for all fields that had SEBAL coverage over the full growing season, i.e., fields that were cut back after 1 October 2011 and were harvested before 31 October 2012. For this, weekly raster data was transformed into field average values. Field average weekly ET, ETdef and ΔTDM were then accumulated over the relevant growing period to derive seasonal totals, while field average weekly WUEBIO was averaged over the relevant growing period.
RESULTS AND DISCUSSION
Validation with field data
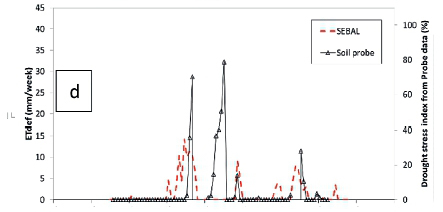
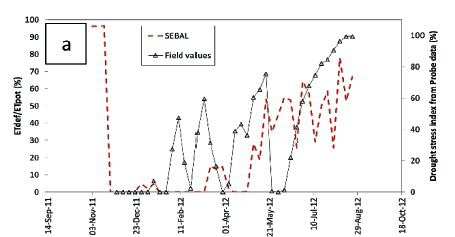
Figure 2 compares RS estimates of FPAR, and SEBAL estimates ET, ETdef and TDM, against ground observations for Field G1. Similar comparisons of FPAR, ETdef and TDM were also performed for the 12 other validation fields.
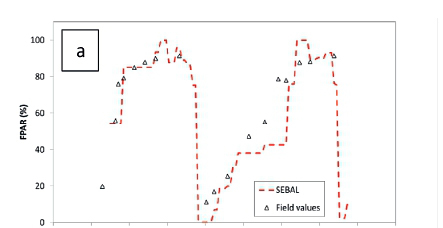


RS estimates of FPAR mostly compared excellently with ground estimates for Field G1 for both seasons. Large differences only occurred during periods of missing data (shown as period with no change in RS FPAR over time in Fig. 2a). Where RS data were available the estimates compared very well with field measurements (y = 0.88x - 2.7, R2 = 0.95, n = 7).
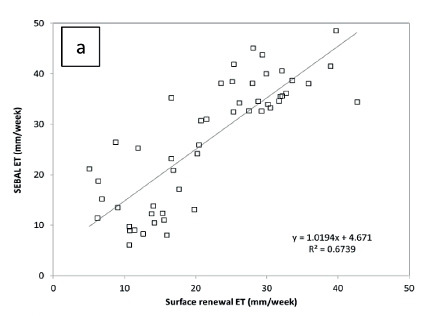
There was reasonable agreement between SEBAL and SR ET estimates (R2 = 0.67) although SEBAL estimates are mostly higher than SR estimates (Fig. 2b and 3a). The average difference between SEBAL ET and SR ET values was 5.1 mm/week when data from both seasons were considered, a difference of about 24% of the mean SR ET value. This bias contradicts results from other studies. Ground validation of RS ET estimates for sugarcane by Ruhoff et al. (2013) and Hernandez et al. (2014) show better accuracy and little bias. The study by Bhattarai et al. (2016) on other crops found errors of less than 1 mm/d for SEBAL and METRIC, with little bias. Allen et al. (2007) also found very little bias in METRIC estimates of seasonal ET for irrigated meadow and sugar beet.
The average Kc values for the SEBAL and SR ET estimates for the period of full canopy cover (measured FPAR > 0.8) was 1.2 and 0.9, respectively. The SEBAL Kc value agrees well with values determined for sugarcane through lysimetry (Kc = 1.1 Oliver and Singels 2012; Kc = 1.25 Win et al. 2014; Kc = 1.25 De Cardoso et al., 2015) and the Bowen ratio (Kc = 1.25, Inman-Bamber and McGlinchey, 2003). Zhang et al. (2015) reported very low mid-season Kc values of about 0.8 using the eddy covariance method, and ascribed this to the inappropriate parametrization of the reference ET equation for tropical conditions. Hernandez et al. (2014), in a remotely sensed surface energy balance study, found maximum Kc values for irrigated sugarcane that ranged from 0.9 to 1.3.
We therefore conclude that SEBAL estimates of ET are reliable and that the SR method likely underestimated actual ET. A possible cause is the uncertainty associated with α (Eq. 2) values used for cane older than 3 months. It highlights the need for site-specific and crop age specific calibration of the SR method.
SEBAL estimates of TDM compared very well to ground estimates of ADM for Field G1 for both seasons (Fig 2c).
ETdef reflects the impact of sub-optimal crop water status on ET, as influenced by soil, crop and atmospheric factors. Soil water supply as determined by soil water content and rooting density, as well as atmospheric evaporative demand, determine stomatal behaviour and hence the ability of the plant to transpire at the potential rate. No direct validation of ETdef estimates with ground measurements was possible. Instead, these estimates were compared to DSI and WLI values derived from measured soil water content, which do not account for the aforementioned crop and atmospheric factors.
ETdef estimates for Field G1 compared reasonably well with DSI as determined from soil probe measurements (Fig 2d). SEBAL indicated a period of positive ETdef towards the end of the 2012 season, coinciding with a period when irrigation was withheld to improve sucrose content of the cane. DSI only increased at the end of this period. The SEBAL information suggest that ET was affected (and water stress developed) sooner than the soil water measurements suggested. This could be due to sparse rooting deeper in the soil profile. Soil probe placement could also have played a role. In this case, a probe was placed close to a drip emitter and thus sampled the wettest part of the cropping area. In the subsequent ratoon crop, soil probe data showed dry soil conditions initially in the emerging crop, while SEBAL did not indicate any drought effects on ET. An explanation for this is that the large proportion of the soil profile was dry after extraction of water by the previous crop, while the top soil with most of the roots of the new ratoon was relatively wet from drip irrigations, ensuring a favourable water status for the crop. SEBAL indicated 4 short periods of drought stress in the ratoon crop, two of which are corroborated by probe data. This confirms the observation that, for established crops with deep roots, SEBAL indicated drought effects before soil water measurements indicated them. SEBAL estimated ETdef was not well correlated to periods of observed waterlogging by soil moisture probes (Fig. 2e). Similar trends were observed for the other fields, with SEBAL often indicating reduced ET (and therefore reduced growth) when root zone average soil water values did not. It is interesting to note that it should be possible to calibrate the threshold ASWC and evaporative demand values where ET reductions commence for different soils using SEBAL data. This could improve overall crop model accuracy and irrigation management.
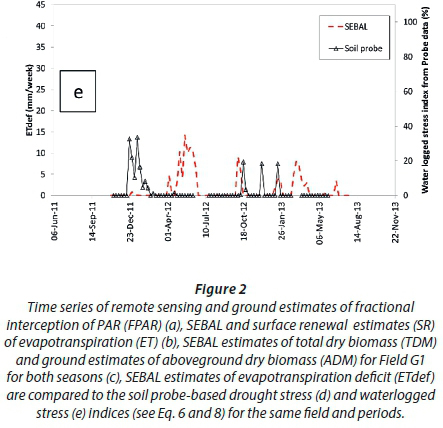
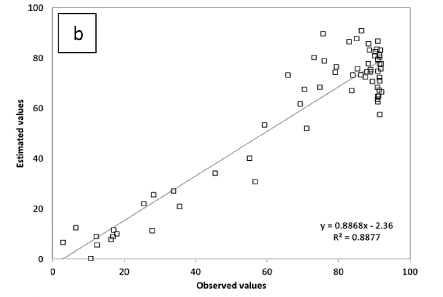
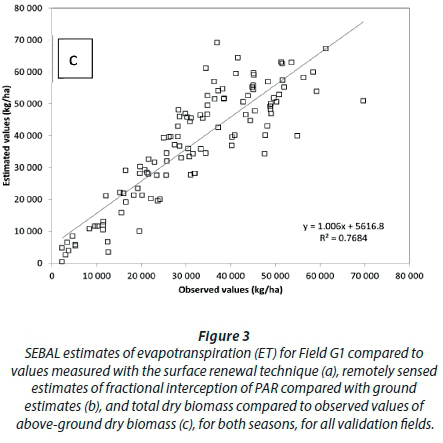
Validation results combined for all fields are summarized in Fig. 3.
RS FPAR estimates compared very well with ground estimates, especially for values below 80% (Fig. 3b). NDVI saturation causes some variation in RS estimates for ground values of FPAR exceeding 80%. Overall, there seems to be a tendency to slightly underestimate ground estimates of FPAR by about 2.2 units and an adjustment to Eq. 8 could improve estimates of low FPAR values.
Theoretically, SEBAL TDM estimates should be higher than ground estimates of ADM to account for the root fraction that is not included in ADM values. Validation results show that this was indeed the case, as was demonstrated by an intercept of 14.6 t/ha for the 2011/12 season. This overestimation amounted to 30% of TDM for low values to about 15% of TDM at high values. The latter value agrees well with a documented root fraction of 12% in mature crops (Singels and Bezuidenhout 2002). The overestimate for small crops suggests that young crops partition more to roots than do older crops, which is generally accepted (Singels and Bezuidenhout 2002). When data from both seasons are considered, the SEBAL model performed remarkably well (Fig. 3c), considering the extent of missing data in the second season. Again, SEBAL TDM estimates were mostly higher than ADM estimates, by on average with 5.6 t/ha (28% at TDM = 20 and 11% at TDM = 50 t/ha). We conclude that SEBAL is able to reliably estimate biomass growth for irrigated sugarcane using ε' = 3.7 g/MJ. This value is slightly higher than the value of 3.45 g/MJ reported by Morel et al. (2014). It compares well with values quoted in the literature (typically 3.2 to 3.6 g/MJ assuming that PAR makes up 50% of global radiation - see Singels et al., 2005), considering that these refer to aboveground biomass only.
Regional analysis of seasonal estimates
The spatial distribution of seasonal (weekly values for sugarcane pixels accumulated from 3 November 2011 to 31 October 2012) estimates of ET, ETdef, biomass production and WUEBIO are displayed in Fig. 4.
Evapotranspiration
The accumulated ET ranged from 1 000 to 1 600 mm per season for the sugarcane fields located in the north-eastern and central regions of the study site (Fig. 4a) where good irrigation infrastructure and crop management prevails. In the southern region, accumulated ET values ranged between 600 and 1 000 mm/season, where crop and water management are suboptimal with poorly maintained or under-designed irrigation infrastructure (Cronje, 2014). Actual ET values of 1 000 to 1 300 mm per season are frequent and typically correspond with areas owned by large commercial growers. Values below 1 000 mm can be considered indications of suboptimal crop performance, possibly due to low canopy cover and/or drought stress. Forty per cent of the fields in the Malalane mill supply area (MSA) and 53% of the fields in the Komati MSA had ET estimates below this benchmark. Average ET values from this study compare well with those estimated for this area by Hellegers et al. (2009) (1 050 mm) and Bezuidenhout et al. (2006) (1 016 mm).
Evapotranspiration deficit
Accumulated ETdef values of between 100 and 200 mm occurred frequently (Fig. 4b). Areas delivering to the Malalane mill typically had lower ETdef than the areas delivering to the Komatipoort mill (Fig 4b). The Malalane area is slightly cooler and wetter and also receives a higher irrigation allocation than the Komatipoort area.
Biomass production
Large commercial fields in the central and north-eastern regions showed high accumulated biomass values (> 40 t/ha). Small-scale grower fields in the western and southern regions mostly had lower biomass production, possibly due to suboptimal irrigation and fertilizer applications. Seasonal biomass of 35 t/ha, equivalent to about 90 t/ha of cane, can be considered a break-even value. Thirty per cent of the sugarcane area in the Malalane MSA had biomass estimates lower than this threshold, while the corresponding number for Komati MSA was 34%. Hellegers et al. (2009) found average biomass values of 55 to 59 t/ha for sugarcane in the same area using the SEBAL method, although implemented in a different way.
Biomass water use efficiency
Seasonal average WUEBIO values were homogenous over the area, with a large proportion between 3 and 5 kg/m3. Small-scale grower fields often had WUEBIO values of less than 3 kg/m3.
Average WUEBIO values calculated from the SEBAL estimates of TDM and ET reported by Hellegers et al. (2009) for sugarcane in the same area equal about 5.4 kg/m3, which is higher than the average values found in this study (4.2 kg/m3). WUE is normally quoted in units of fresh cane yield per unit of ET (WUECY), which can be converted to WUEBIO assuming a stalk fraction of 57% and stalk dry matter content of 25%. WUEBIO values derived from ground measurements for well managed crops range from 2.6 to 5.2 kg/m3 (WUECY = 6 to 12 kg/m3) (Olivier and Singels, 2003; Kingston, 1994; Thompson, 1976).
WUEBIO values below 3.5 kg/m3 (WUECY = 8 kg/m3) can be considered low and indicate inefficient conversion of ET to biomass, possibly due to agronomic limitations such as weeds, pests and diseases, nutrient deficiencies, poor crop stand or high levels of evaporation from the soil. Olivier and Singels (2015) demonstrated that sugarcane WUE can be improved by alleviating these limitations. Twenty-four per cent of the sugarcane area in the Malalane MSA had values below this threshold (3.5 kg/m3), while the corresponding number for the Komati MSA was 22%. These areas can then be targeted by extension and technical services for corrective action.
Relationships between actual cane yield and SEBAL seasonal estimates
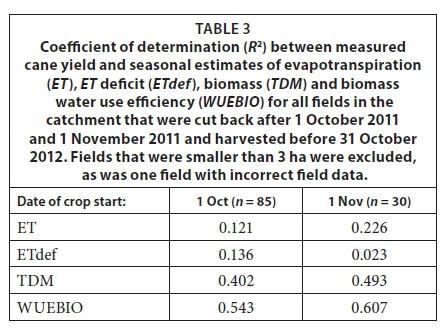
Correlations between seasonal SEBAL estimates and actual yields for all fields in the catchment for which the growing season closely matched the period of available SEBAL data, are shown in Table 3. The relationships are weak for ET and ETdef. These weak correlations are possible because fields with poor crop stands and resultant low yields could have high non-beneficial ET (evaporation from exposed soil surface or transpiration from weeds) and low ETdef. SEBAL estimates of TDM and WUEBIO were better correlated, with the latter explaining about 60% of the variation in yield for fields that started after 1 November 2011 (commencement date of SEBAL data). Better correlation might be achieved if only data captured during the period of active stalk growth is considered, rather than data captured for the entire growing period, which includes the canopy formation period and the maturation period when little stalk growth and yield formation takes place. The good correlations with yield found for TDM and WUEBIO is encouraging, as these parameters can be used to identify poorly performing fields as the season progresses, so that extension activities and remedial actions can be prioritized for these cases.
Potential value of SEBAL information to support sugarcane production management
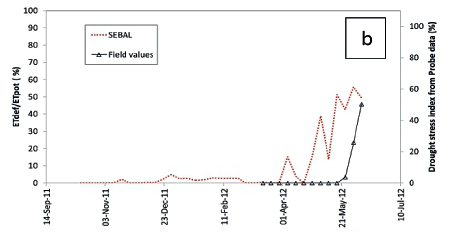
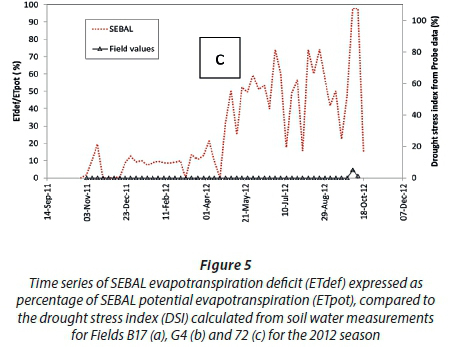
This section explores the potential of SEBAL ETdef information to provide early warning of drought stress by reviewing data for the 2012 season for three contrasting fields (Fig. 5).
For Field B17, which yielded only 69 t/ha in 2012, ETdef remained low during the first part of the growing season, and then increased to vary between 5 and 10 mm/week from about May 2012 for the remainder of the growing season (Fig. 5a). This period corresponded to a period of persistent high values of DSI, which is indicative of low soil water status. Although the DSI data suggest that dry soil conditions may have existed before then, the SEBAL data for this period (February and March) suggested that this had no impact on crop ET. As pointed out earlier, this could be because DSI data do not account for rooting and evaporative impacts on crop water status. The low yield and prolonged period of drought stress was caused by a lack of water supply. In theory, the SEBAL information could have alerted managers to the problem early, enabling a speedy response to minimize the negative impact.
In contrast, Field G4, which yielded 125 t/ha, showed no significant ETdef for most of the season and only late in the season, after April 2012, did SEBAL indicate some drought stress (Fig. 5b). SEBAL drought stress indications commenced in early April, well before soil probe data suggested stress in late May. This discrepancy was probably caused by the placement of the probe close to drip emitters in the wettest part of the cropping area. This period of perceived drought stress coincided with the period during which the farmer intentionally imposed mild drought stress by withholding irrigation to slow down growth and promote sugar accumulation. The SEBAL estimates of ETdef have the potential to optimize this very important management process by providing near real-time estimates of the water status of the crop.
Although SEBAL ETdef data suggest that Field 72 experienced drought stress through most of the second half of the growing season (Fig. 5c), the soil probe data and the excellent observed yield of 141 t/ha did not support this. This field flowered heavily, and it is presumed that the emerging flowers interfered with the reflectance signal. This requires further investigation and possible adjustment of the SEBAL algorithm.
CONCLUSIONS
The validation study showed that RS FPAR estimates compared well with ground estimates (R2 = 0.89). SEBAL estimates of ET compared reasonably well with SR estimates (R2 = 0.67), but exceeded SR on average by about 5 mm/week (24%). SEBAL Kc values for the full canopy period compared better with values reported in the literature than SR Kc values, and it was therefore concluded that SEBAL ET estimates for irrigated sugarcane were reliable. SEBAL generally indicated ET deficits before soil water records suggested water stress, suggesting that crop water uptake could have been limited by stomatal closure through sparse rooting and/or high evaporative demand. This information could be used to improve crop model parameters and support irrigation management. The good agreement between SEBAL estimates of dry biomass with measured aboveground dry biomass (R2 = 0.78) suggest that SEBAL could possibly be used to estimate field-level sugarcane biomass production. This is an important step towards estimating cane and sugar yields.
The regional analysis revealed considerable spatial variation in all the parameters, with a substantial proportion (about 32%) well below the economic threshold, especially in resource-constrained small-scale production areas. Hence there is great potential to increase WUE, productivity and profitability.
Seasonal estimates of ET and ETdef were poorly correlated with observed cane and sucrose yields, suggesting that factors other than water, such as poor crop stands, suboptimal nutrition, weed pressure and pest and disease damage, may have played a role. Seasonal estimates of TDM and WUEBIO were better correlated with actual yields. Results suggest that WUEBIO may be a good parameter to monitor crop performance and identify areas for prioritisation of resources to rectify problems. It is noteworthy that during the execution of this research project, the RCL Foods extension service in Mpumalanga identified WUEBIO as the most useful SEBAL information to support their work. The data was assessed in near real-time through an interactive website to identify fields in the area that required attention.
This study for first time provided quantitative information on the accuracy of high-resolution SEBAL estimates of sugarcane ET, ETdef, TDM and WUEBIO at weekly and seasonal time scales, as well as spatial variation of seasonal values in the study area. The regional analysis of spatial estimates showed potential for improving crop productivity and water use efficiency in the study area. Estimated seasonal WUEBIO was demonstrated to be a reliable indicator of sugarcane yield.
The impact of missing remote sensing data on the accuracy of SEBAL estimates was not investigated here but could be reason for concern. More sophisticated data patching routines for cloudy periods and accessing the latest sensors that have become available need to be explored.
ACKNOWLEDGEMENTS
The South African Sugarcane Research institute (SASRI), the University of KwaZulu-Natal, the Water Research Commission (WRC) and the Department of Agriculture, Forestry and Fisheries (South Africa) have provided funding for this research as part of a WRC research project (Jarmain et al., 2014). Contributions by SASRI field technicians (crop monitoring), Pieter Cronje of RCL Foods (farmer liaison), and participating sugarcane farmers are gratefully acknowledged.
REFERENCES
ALLEN RG, PEREIRA LS, RAES D and SMITH M (1998) Crop evapotranspiration. Guidelines for computing crop water requirements. FAO Irrigation and Drainage Paper No. 56. FAO, Rome. [ Links ]
ALLEN RG, TASUMI M, MORSE A, TREZZA R, WRIGHT JL, BASTIAANSSEN W, KRAMBER W, LORITE I and ROBISON CW (2007) Satellite based energy balance for mapping evapotranspiration with internalized calibration (METRIC) - Applications. J. Irrig. Drain. Eng. 133 395-406. https://doi.org/10.1061/(ASCE)0733-9437(2007)133:4(395) [ Links ]
ASRAR G, FUCHS M, KANEMASU ET and HATFIELD JL (1984) Estimating absorbed photosynthetic radiation and leaf area index from spectral reflectance in wheat. Agron. J. 76 300-306. https://doi.org/10.2134/agronj1984.00021962007600020029x [ Links ]
BHATTARAI N, SHAW SB, QUACKENBUSH LJ, IM J and NIRAULA R (2016) Evaluating five remote sensing based single-source surface energy balance models for estimating daily evapotranspiration in a humid subtropical climate. Int. J. Appl. Earth Observ. Geoinf. 49 75-86. https://doi.org/10.1016/j.jag.2016.01.010 [ Links ]
BASTIAANSSEN WGM and ALI A (2003) A new crop yield forecasting model based on satellite measurements applied across the Indus Basin, Pakistan. Agric. Ecosyst. Environ. 94 321-340. https://doi.org/10.1016/S0167-8809(02)00034-8 [ Links ]
BASTIAANSSEN WGM, MENENTI M, FEDDES RA and HOLTSLAG AAM (1998) A remote sensing surface energy balance algorithm for land (SEBAL). 1. Formulation. J. Hydrol. 212 198-212. https://doi.org/10.1016/S0022-1694(98)00253-4 [ Links ]
BEZUIDENHOUT CN, LECLER NL, GERS C and LYNE PWL (2006) Regional-based estimates of water use for commercial sugarcane in South Africa. Water SA 32 219-222. [ Links ]
CRONJE P (2014) Personal communication. February 2014. Dr Pieter Cronje, RCL Foods, Malalane. [ Links ]
DE CARDOSO GG, DE OLIVEIRA RC, TEIXEIRA MB, DORNELES MS, DOMINGOS RMO and MEGGUER CA (2015) Sugar cane crop coefficient by the soil water balance method. Afr. J. Agric. Res. 10 2407-2414. https://doi.org/10.5897/AJAR2015.9805 [ Links ]
DOST R (2013) WatPLAN spatial earth observation monitoring for planning and water allocation in the international Incomati Basin [FP/2007-2012] - 262949. Final Publishable Summary Report submitted to the European Community's Seventh Framework Programme (FP72007-2012). [ Links ]
ELTAYEB SN (2010) Sensible heat flux estimation under unstable conditions for sugarcane using temperature variance and surface renewal. Unpublished PhD thesis, University of KwaZulu-Natal, Pietermaritzburg, South Africa. [ Links ]
HELLEGERS PJGJ, SOPPE R, PERRY CJ and BASTIAANSSEN WGM (2009) Combining remote sensing and economic analysis to support decisions that affect water productivity. Irrig. Sci. 27 243-251. https://doi.org/10.1007/s00271-008-0139-7 [ Links ]
HERNANDEZ FBT, NEALE CMU, TEIXEIRA AH DE C and TAGHVAEIAN S (2014) Determining large scale actual evapotranspiration using agrometeorological and remote sensing data in the Northwest of São Paulo State, Brazil. Acta Hort. 1038 263-270. https://doi.org/10.17660/ActaHortic.2014.1038.31 [ Links ]
INMAN-BAMBER NG and MCGLINCHEY MG (2003) Crop coefficients and water-use estimates for sugarcane based on long-term Bowen ratio energy balance measurements. Field Crops Res. 83 125-138. https://doi.org/10.1016/S0378-4290(03)00069-8 [ Links ]
IMMERZEEL WW, GAUR A and ZWART SJ (2008) Integrating remote sensing and a process-based hydrological model to evaluate water use and productivity in a south Indian catchment. Agric. Water Manage. 95 11-24. https://doi.org/10.1016/j.agwat.2007.08.006 [ Links ]
JARMAIN C, SINGELS A, BASTIDAS-OBANDO E, PARASKEVOPOULOS A, OLIVIER F, VAN DER LAAN M, TAVERNA-TURISAN D, DLAMINI M, MUNCH Z, BASTIAANSSEN W, ANNANDALE J, EVERSON C, SAVAGE M and WALKER S (2014) Water use efficiency of selected irrigated crops determined with satellite imagery. WRC Report No. TT 602/14. Water Research Commission, Pretoria. ISBN 978-1-4312-0573-8. [ Links ]
JARMAIN C, EVERSON CS, SAVAGE MJ, MENGISTU M and CLULOW AD (2009) Refining tools for evaporation monitoring in support of water resources management. WRC Report No. K5/1567/08. Water Research Commission, Pretoria. ISBN 978-1-77005-798-2. [ Links ]
JOHNSON LF and TROUT TJ (2012) Satellite NDVI assisted monitoring of vegetable crop evapotranspiration in California's San Joaquin Valley. Remote Sens. 4 439-455. https://doi.org/10.3390/rs4020439 [ Links ]
KINGSTON G (1994) Benchmarking yield of sugarcane from estimates of water use. Proc. Aus. Soc. Sug. Cane Technol. 16 201-209. [ Links ]
MARK M and LUCKSON M (2010) The relationship between satellite derived and ground measured sugar cane water use: The case of Hippo Valley Estates in Zimbabwe. J. Sustainable Dev. Afr. 12 191-216. [ Links ]
MENGISTU MG and SAVAGE MJ (2010) Surface renewal method for estimating sensible heat flux. Water SA 36 9-18. [ Links ]
MOREL J, TODOROFF P, BÉGUÉ A, BURY A, MARTINÉ JF and PETIT M (2014) Toward a satellite-based system of sugarcane yield estimation and forecasting in smallholder farming conditions: A case study on Reunion Island. Remote Sens. 6 6620-6635. https://doi.org/10.3390/rs6076620 [ Links ]
OLIVIER FC and SINGELS A (2003) Water use efficiency of irrigated sugarcane as affected by row spacing and variety. Proc. S. Afr. Sug. Technol. Ass. 77 347-351. https://doi.org/10.1016/j.fcr.2015.02.010 [ Links ]
OLIVIER FC and SINGELS A (2012) The effect of crop residue layers on evapotranspiration, growth and yield of irrigated sugarcane. Water SA 38 77-85. [ Links ]
OLIVIER FC (2014) Personal communication. 15 February 2014. Francois Olivier, South African Sugarcane Research Institute, Mount Edgecombe. [ Links ]
OLIVIER FC and SINGELS A (2015) Increasing water use efficiency of irrigated sugarcane production in South Africa through better agronomic practices. Field Crops Res. 176 87-98. [ Links ]
PARASKEVOPOULOS A and SINGELS A (2014) Integrating weather based crop modelling and soil water monitoring technologies to provide improved decision support for sugarcane irrigation management. Comput. Electron. Agric. 105 44-50. https://doi.org/10.1016/j.compag.2014.04.007 [ Links ]
RUHOFF AL, PAZ AR, ARAGAO LEOC, MU Q, MALHI Y, COLLISCHONN W, ROCHA HR and RUNNING SW (2013) Assessment of the MODIS global evapotranspiration algorithm using eddy covariance measurements and hydrological modelling in the Rio Grande basin. Hydrol. Sci. J. 58 1658-1676. https://doi.org/10.1080/02626667.2013.837578 [ Links ]
SINGELS A, LESLIE GW, MCFARLANE SA, MILES N, GABRIEL A and NICHOLSON R (2015) South African sugarcane production in 2014/15 from an agricultural perspective. Proc. S. Afr. Sug. Technol. Ass. 88 1-22. [ Links ]
SINGELS A and BEZUIDENHOUT CN (2002) A new method of simulating dry matter partitioning in the Canegro sugarcane model. Field Crops Res. 78 151-164. https://doi.org/10.1016/S0378-4290(02)00118-1 [ Links ]
SINGELS A, DONALDSON RA and SMIT MA (2005) Improving biomass production and partitioning in sugarcane: theory and practice. Field Crops Res. 92 291-303. https://doi.org/10.1016/j.fcr.2005.01.022 [ Links ]
TEIXEIRA AH DE C (2010) Determining regional actual evapotranspiration of irrigated crops and natural vegetation in the São Francisco river basin (Brazil) using remote sensing and Penman-Monteith equation. Remote Sens. 2 1287-1319. https://doi.org/10.3390/rs0251287 [ Links ]
THOMPSON GD (1976) Water use by sugarcane. S. Afr. Sug. J. 60 593-600; 627-635. [ Links ]
VAN ANTWERPEN R, MEYER JH and JOHNSTON MA (1994) Estimating water retention of some Natal sugar belt soils in relation to clay content. Proc. S. Afr. Sug. Technol. Ass. 68 75-79. [ Links ]
VAN ATTA CW (1977) Effect of coherent structures on structure functions of temperature in the atmospheric boundary layer. Arch. Mech. 29 161-171. [ Links ]
TWEDDLE P (2017) Personal communication, 15 October 2017. Dr Peter Tweddle, South African Sugarcane Research Institute, Mount Edgecombe. [ Links ]
WIN SK, ZAMORA OB and THEIN S (2014) Determination of the water requirement and Kc values of sugarcane at different crop growth stages by lysimetric method. Sugar Technol. 16 286-294. https://doi.org/10.1007/s12355-013-0282-1 [ Links ]
YANG X, ZHOU Q and MELVILLE M (1997) Estimating local sugarcane evapotranspiration using Landsat TM image and a VITT concept. Int. J. Remote Sens. 18 453-459. https://doi.org/10.1080/014311697219196 [ Links ]
ZHANG HH, ANDERSON RG and WANG D (2015) Satellite-based crop coefficient and regional water use estimates for Hawaiian sugarcane. Field Crops Res. 180 143-154. https://doi.org/10.1016/j.fcr.2015.05.023 [ Links ]
ZWART SJ and BASTIAANSSEN WGM (2007) SEBAL for detecting spatial variation of water productivity and scope for improvement in eight irrigated wheat systems. Agric. Water Manage. 89 287-296. https://doi.org/10.1016/j.agwat.2007.02.002 [ Links ]
Received 13 February 2018
Accepted in 21 September 2018
* To whom all correspondence should be addressed. e-mail: abraham.singels@sugar.org.za

