


Services on Demand
Article
 English (pdf)
 Article in xml format
 Article references
Indicators

Related links
-
 Cited by Google
 -
 Similars in Google
Share

 Permalink
Water SA
On-line version ISSN 1816-7950
Print version ISSN 0378-4738
Water SA vol.44 n.4 Pretoria Oct. 2018
http://dx.doi.org/10.4314/wsa.v44i4.09
ORIGINAL ARTICLES
Distribution of polychlorinated biphenyl along the course of the Buffalo River, Eastern Cape Province, South Africa, and possible health risks
A YahayaI, II, *; OA AdenijiI, II; OO OkohI, II; SP SongcaIV; AI OkohI, III
ISAMRC Microbial Water Quality Monitoring Center, University of Fort Hare, Alice, South Africa
IIDepartment of Chemistry, University of Fort Hare, Alice 5700, South Africa
IIIApplied and Environmental Microbiology Research Group, Department of Biochemistry and Microbiology, University of Fort Hare, Alice 5700, South Africa
IVDepartment of Chemistry, University of Zululand, Private Bag X1001 Kwadlangezwa 3886, South Africa
ABSTRACT
Humans and wildlife are vulnerable to the toxicity of semi-volatile and persistent organic pollutants such as polychlorinated biphenyls (PCBs). Neither the distribution of these pollutants nor their seasonal variation has ever been determined in the Buffalo River. Thus, the occurrence and concentration of 19 PCBs was assessed in King William's Town (KWT), Izele (IZ), Zwelitsha (ZW), Maden (MD), Mdantsane (MSN) and Buffalo River estuary (BRE), all on the Buffalo River in the Eastern Cape Province of South Africa. Water samples were subjected to liquid-liquid extraction for PCBs, after which the compounds were separated and quantified on gas chromatography with electron capture detection. The PCBs differ in concentration from below detection limit (BDL) to 482 ng·L−1 in summer and BDL to 2 383 ng·L−1 in autumn. While the order of congeners increases during the summer from KWT > IZ > ZW > MD > MSN > BRE, the distribution in autumn followed the order BRE > IZ > ZW > KWT > MSN > MD. The total levels of PCBs at all the sites during summer were below the World Health Organization (WHO) permissible level of 500 ng·L−1 recommended for humans, but were exceeded at all the sampling sites in autumn except at MD. The evaluated risk with respect to cancer was lower than the acceptable threshold (10-6), whereas hazard quotients were slightly higher than the maximum threshold (of 1) stated by the United States Environmental Protection Agency (USEPA). The compounds are known to be toxic to humans and animals. The results appear to show that the exposure levels of the compounds were safe for humans and animals. Further studies are recommended in order to make a definitive conclusion.
Keywords: organic pollutants, polychlorinated biphenyls, pollution, water, solvent extraction
INTRODUCTION
Anthropogenic activities are the major source of persistent organic pollutants (POPs). They are resistant to photolytic, biological and chemical breakdown. (Wonga et al., 2005). They are highly toxic, characterized by long persistence in the environment, low solubility in water, and are lipophilic (Wong et al., 2005). POPs are usually volatile and are transported in the environment in low amounts through movement in water and air, besides migration with animals (Vosloo and Bouwman, 2005). They are basically classified into 3 categories: pesticides, industrial chemicals and by-products (El-Shahawi et al., 2010). Polychlorinated biphenyls (PCBs) and hexachlorobenzene (HCB) are categorized as industrial chemicals (El-Shahawi et al., 2010). PCBs are used for fluid heat exchange in electrical transformers and capacitors (Lu et al., 2015; Huang et al., 2014; El-Shahawi et al., 2010), and create hazards to human and environmental health owing to their tendency to bioaccumulate and biomagnify in food production processes (Ozcan et al., 2009; Ramos et al., 1995; Derouiche et al., 2007; Rissato et al., 2006; Salem et al., 2014; Grimm et al., 2015; Kampire et al., 2017).
PCBs contain 209 congeners, of which 130 possibly occur during industrial processes such as the production of capacitors, adhesives, paints, transformers and plasticizers (Derouiche et al., 2007; Hope et al., 1997; Jacquet et al., 2014; Kim et al., 2010; Li et al., 2014). The organic contaminants usually find their way into the aquatic environment through various means including run-off, atmospheric deposition, and leakage from landfills containing industrial and/or municipal wastes, amongst others (Megahed et al., 2015; Kampire et al., 2017). Movement of PCBs from water to soil/sediment, or vice versa, could lead to gathering of dregs in farm products and water meant for human and animal consumption (Derouiche et al., 2007).
South Africa is a developing country with a heavy industrial presence. Large quantities of PCB congeners are in use in South Africa, both in private residences and industries (Kanzari et al., 2012), however, the appropriate facilities for destroying them after use are scarce; hence they penetrate the environment in one way or the other after disposal (Kampire et al., 2017). Organic pollutants, including PCBs, are in most cases discharged as effluents into water bodies through industrial activities and the caulking process at some estuaries (RHP, 2003). Previous studies centring on the status of some POPs in the aquatic environments of South Africa have been reported (Bouwman et al., 1990; Bouwman, 2003; Das et al., 2008; Nieuwoudt et al., 2011). A number of researchers have recently addressed the concentrations of PCBs in certain water bodies in the country. For instance, Pieters (2007) assessed the status of PCBs, dibenzofurans and dioxins in the sediment samples collected from some rivers and estuaries in South Africa using GC/MS. Their findings indicated that the concentrations of the pollutants were extremely high in 7 of the 22 sites investigated, with southern Gauteng Province recording the highest value (17.8 ng·kg−1 TEQ). Other locations found with high levels included Swartkops Estuary, Umgeni River mouth, Modderfontein Spruit, Riet Spruit channel, Loch Vaal, Hartbeespoort Dam and Crocodile River.
Similarly, the levels of freely dissolved PCBs and two other classes of POPs, and their variation patterns across seasons in the water compartment of Hartbeespoort Dam, South Africa, were investigated by Amdany et al. (2014). The results of their analysis ranged from 38 pg·L−1 to 150 pg·L−1, and higher concentrations for most of the compounds examined were generally observed in winter than in other seasons of the year. Similarly, Kampire et al. (2017) determined the concentrations of 6 indicator PCBs (28, 52, 101, 138, 153 and 180) in surface sediments collected from North End Lake in Port Elizabeth, said to be the major recipient of runoff, industrial waste, and urban effluents from the surrounding suburbs, using gas chromatography-mass spectrometry (GC/MS). The total concentrations obtained varied between 1.60 and 3.06 ng·g−1 dry weight (dw), with major contributions received from the most chlorinated samples.
A related work carried out in the northern region of the continent was also documented. Megahed et al. (2015) assessed the levels for 10 PCB congeners in water samples obtained along the course of the River Nile, Egypt, by means of GC coupled with an electron capture detector (ECD). The concentrations of the organic contaminants in the water samples ranged from 14 - 20 μg·L−1. Most predominant was PCB-138 and more frequent at the sample sites were the extremely chlorinated ones. They also observed that the carcinogenic risk level was above the permissible range for all the age categories. Hence, the Egyptian population using the river water were considered to be at risk of developing cancer.
The pollution of the Buffalo River located in the Eastern Cape extends beyond the estuary leading to serious adverse impacts on marine and coastal ecosystems. The river traverses major towns and villages such as King William's Town, Izele, Zwelitsha, Mdantsane and East London, carrying with it pollutants from domestic as well as industrial wastes. Some impoundments are built on this river which supplies water and other economic benefits to the nearby communities. One of the impoundments is the Laing Dam which supplies water to the towns of Zwelitsha, Bhisho, Berlin and parts of Mdantsane. A 50-year-old textile factory discharges its wastes into the Buffalo River upstream of the Laing Dam, and led to the death of a large number of aquatic animals in 2003 (RHP, 2003). Previous pollution investigations on the river and its estuary include physicochemical and microbiological qualities (Dallas, 2008; Chigor et al., 2013), assessment of levels of heavy metals (RHP, 2004), pesticides (Fatoki and Awofolu, 2003; Yahaya et al., 2017) and total petroleum hydrocarbons (Adeniji et al., 2017) in various environmental media. However, reports on the status of polychlorinated biphenyls in the environmental compartments of the river are not available. The aims of this study were therefore to assess the distribution of PCBs in the surface water of Buffalo River and also to evaluate the level of health risk to humans.
MATERIALS AND METHODS
Description of the sampling sites
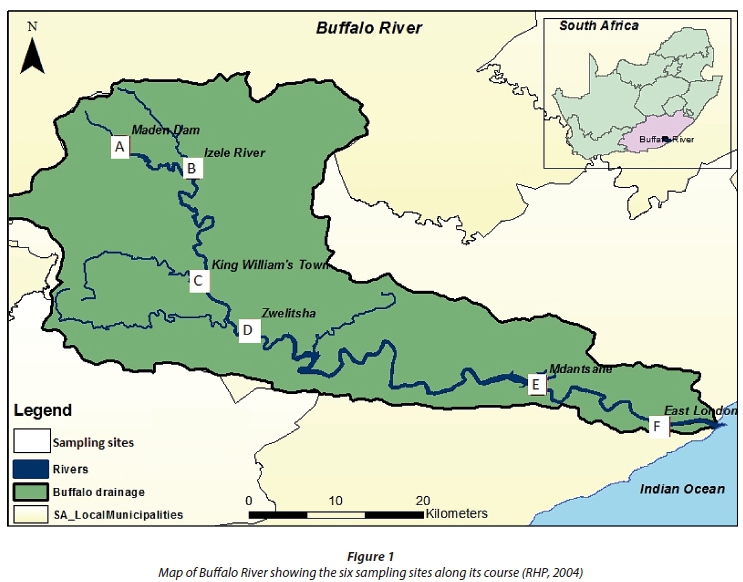
The Buffalo River, which is approx. 126 km long has its source in the Amathole Mountains and has 4 impoundments along its course, namely, Laing, Maden, Rooikrantz and Bridle Drift dams, providing water, nutritional and other economic benefits for communities such as King Williams Town, Zwelitsha and Mdantsane townships through which it passes before finally draining into the Indian Ocean in East London through its estuary. East London is a city with a considerable number of industries located along the course of the river into which hazardous industrial and domestic wastes as well as agricultural run-offs are discharged. A map indicating the sampling points is shown in Fig. 1
The latitude and longitude of the sampling points are 33°01′50.28″S and 27°51′29.01″E for Buffalo River Estuary (BRE), 32°58′53.65″S and 27°41′1.30″E for Mdantsane (MSN), 32°55′50.33″S and 27°25'50.01″E for Zwelitsha (ZW), 32°52′46.30″S and 27°22′54.36″E for King William's Town (KWT), 32°45′49.50″S and 27°22′27.08″E for Izele River (IZ) , 32°44′23.54″S and 27°17′57.49″E for Maden Dam (MD).
Reagents and standards
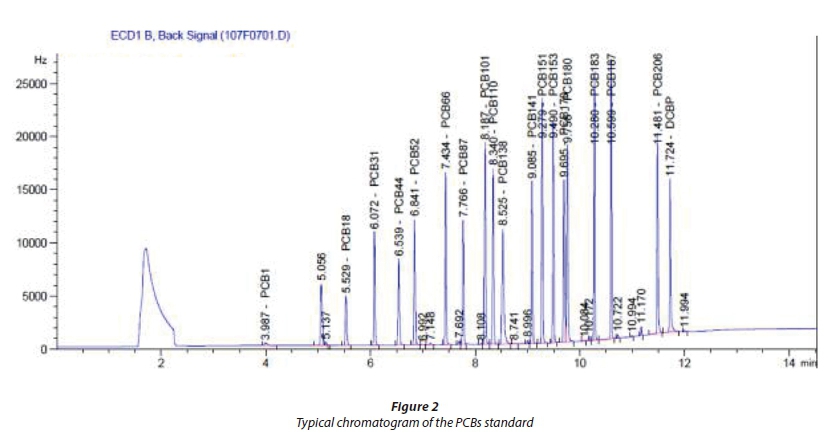
A standard mixture containing 19 PCB congeners, as shown in Table 1, and decachlorobiphenyl (DCBP) used as surrogate standard were obtained from Ultra Scientific Analytical Solution, USA.

The HPLC grade n-hexane, dichloromethane and acetone used for the extraction and clean-up were sourced from Sigma Aldrich (Czech Republic) while analytical grade sulphuric (98%) and hydrochloric (37%) acids were procured from Merck (Germany). Ultra-pure nitrogen (99.99%) and helium gases for extraction and chromatographic analysis were supplied by Afrox Limited, South Africa.
All sample bottles, separating funnels, column and glass wares were washed with soap and dried in an oven at 150°C. Glass vials were washed with soap, soaked in acetone for 24 h and dried in an oven at 150°C. Silica gel used for this work was activated in the oven at 150°C and cooled in a desiccator before use.
Sample collection
Grab samples of surface water were collected into 3 different amber glass bottles (1 L) from 100 mm depth and emptied into pre-cleaned dark brown bottles. This was done for each of the 6 sites from which samples were taken. Sampling was done between 7:00 and 10:00, in triplicate from 3 sampling points across the 6 locations, from December 2015 to May 2016. Each sample was preserved with 5 mL of 98% sulphuric acid and water (1:1 ratio) and immediately transported in an ice-chest at 4°C to the laboratory for chemical analysis (USEPA, 2007). There was a halt in sample collection, particularly in IZ, ZW and KWT, due to the drought experienced in the winter period.
Extraction and clean-up
About 500 mL of the water samples from each of the 5 sites (MD, IZ, KWT, ZW and MSN) was spiked with 1 mL of 10 μg·mL−1 surrogate standard (Decachlorobiphenyl) and extracted 3 times with 30 mL of dichloromethane in a 1 L separating funnel (Ge et al., 2013). All samples were concentrated to about 3 mL in a rotary evaporator, solvent exchanged with 40 mL of n-hexane, re-concentrated and subjected to column clean-up (Ge et al., 2014; Pérez-Carrera et al., 2007; USEPA, 2007)
About 3 mL of the n-hexane extract was transferred into a 250 mL separating funnel (in fume hood) and 6 mL of a mixture of sulphuric acid and water (1:1) was added. The mixture was allowed to separate for about 1 min into layers. The aqueous phase was drained off while the organic portion was retained in the separating funnel. About 5 mL of 5% aqueous potassium permanganate was added to the organic fraction and left to separate for a period of 2 min in the separating funnel. The organic layer was then drained out and passed through a glass chromatographic column (10 mm i.d × 30 cm) packed with a slurry made of 4 g of deactivated silica gel and 2 g of anhydrous sodium sulphate on top. The column was pre-washed with 10 mL n-hexane, after which the sample extract was eluted with 40 mL of n-hexane, concentrated to about 2 mL with a rotary evaporator at 37°C and analysed with gas chromatography with electron capture detection (GC-ECD) (Megahed et al., 2015; Yu et al., 2014, USEPA, 2007; USEPA, 2006).
Instrumental analysis
The PCB congeners were analysed using an Agilent 7820A GC coupled with ECD. The helium gas was used as a carrier under a continuous gas flow rate of 3.5 mL·min−1. About 1 µL of extract was injected at ٢٥٠°C into the chromatograph with capillary column HP-5 (30 m × 0.25 mm × 0.25 µm). The oven temperature was maintained at 110°C for 0.1 min, ramped at 25°C·min−1 to 200°C held for 0.5 min, then at 10°C·min−1 to 240°C (held for 0.5 min) and finally ramped at 30°C·min−1 to 325°C (held for 3 min). The runtime was 14.53 min and the detector temperature was 350°C, using nitrogen gas as make up at 30 mL·min−1 (Smith and Lynam, 2012).
Method of quantification
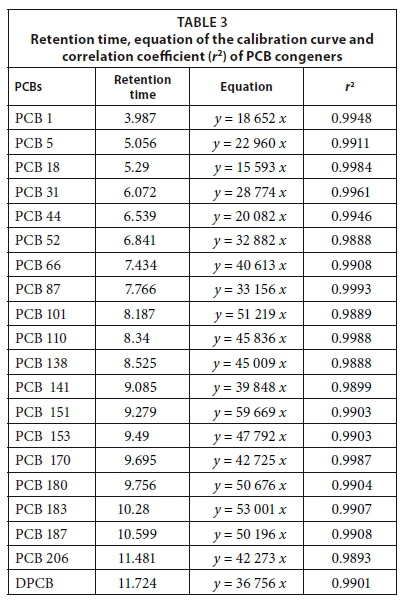
Stock solution of 19 PCB congeners (100 μg·mL−1 in 1 mL) standard mixture was diluted in acetone to prepare working standard solutions calibrated for a range between 10 and 600 ng·mL−1. A decachlorobiphenyl (DCBP) solution (1 000 μg·mL−1 in 1 mL) was also diluted to 100 μg·mL−1 before being combined with the PCB standard for serial dilution into different concentrations for instrument calibration. The response factor was generated using Agilent Chemstation software and all the analyte and calibration curves were subsequently plotted by the instrument. The plots revealed a linear trajectory, with correlation coefficients that varied from 0.9888 to 0.9993 (Table 2). The 19 PCBs in the sample extracts were thereafter quantified using the prepared calibration curves (Sibiya, 2012; Adeniji et al., 2017; Yahaya et al., 2017).
Quality assurance
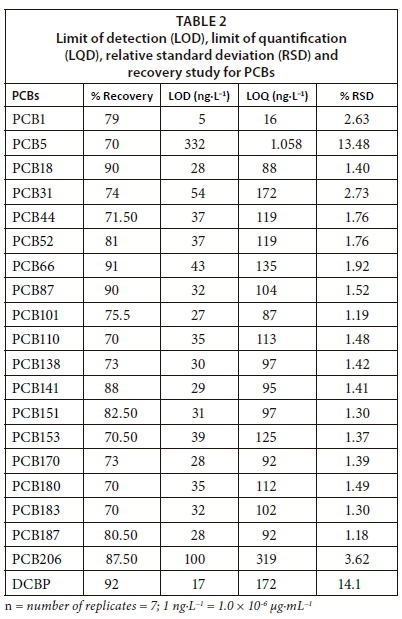
All samples and double-distilled water were spiked with 10 μg·mL−1 of surrogate standard (DCBP) to monitor the extraction efficiency, and percentage recoveries of surrogate were used to calculate the final concentrations of the compounds of interest in the sample extracts (Sibiya, 2012). A middle level PCB standard mixture (10 μg·mL−1) was run 7 times for estimation of the limits of quantification (LOQ), the limits of detection (LOD) and the relative standard deviation (RSD) (Sibiya, 2012; DOE, 1997).
Risk assessment
Risk assessments of the analytes were carried out in accordance with standard methods using average daily dose (ADD), and hazard quotient (HQ) (Lohmann et al., 2007; Pawelczyk, 2013; Ge et al., 2014; Megahed et al., 2015).
The evaluation of ADD was done as expressed in Eq. 1 below.
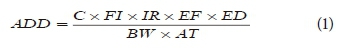
where ADD = intake exposure level (mg·kg−1·day−1); C = average concentration of PCBs (mg·L−1); FI = fraction ingested (0.98). IR = daily water intake based on age group: 0-6 yr = 0.3 L·day−1; 7-17 yr = 1 L·day−1; adult = 1.4 L·day−1. EF = exposure frequency = 365 day·yr−1. ED = exposure duration based on age group: 0-6 years = 6; 7-17 years = 11; adult = 30. BW = average body weight: 0-6 years = 15 kg; 7-17 yr = 46 kg; adults = 70 kg. AT = averaging times in days: AT (0-6 yr) = 2 190 days; AT (7-17 yr) = 4 015 days; AT (adult) = 10 950 days (Megahed et al., 2015).
Furthermore, the hazard quotient was estimated using Eq. 2 as shown below.

where RfD = reference dose = 2.00 × 10⁻⁵ mg·kg=1·day=1 and HQ is unitless.
In the same vein, cancer risk was calculated for the contaminants as demonstrated in Eq. 3.

In this case, DI = daily input (2 L·day−1); ED = exposure duration (30 yr), BW = body weight (60 kg); CSF = cancer slope factor (0.07 mg·kg−1·day−1); CF = conversion factor (10-6); AT = average life span: (70 yr, for all age group). All the estimated values were therefore in agreement with standard methods (ECETOC, 2016; AMEC, 2010; Bozek et al., 2009; Hamilton et al., 2003; ECETOC, 2001; USEPA, 1992) as reported by Megahed et al. (2015) and Yahaya et al. (2017) in their previous works.
Statistical analysis
Analysis of variance (ANOVA), mean, standard deviation and regression analysis were done using MINTAB version 12.11 application software (p < 0.05).
RESULTS
Quality assurance
The surrogate recoveries for PCBs in the samples were between 55% and 95% but ranged from 70% to 92% in the double-distilled water. The signal to noise ratio of the method was higher than 5 (WDNR, 1996; Megahed et al., 2015; Yahaya et al., 2017) and relative standard deviation was acceptably low, ranging between 1.18% and 14.1% (Zang et al., 2013; Amdany et al., 2014; Kampire et al., 2017). Moreover, the limits of detection and quantitation were obtained in ng·L−1 as shown in Table 2. The retention times, correlation coefficients (r2), linear equations and PCB standard mixtures were used for the calculation of concentrations and calibration curve as shown in Table 3 and Fig. 2.
Levels of PCBs in the Buffalo River
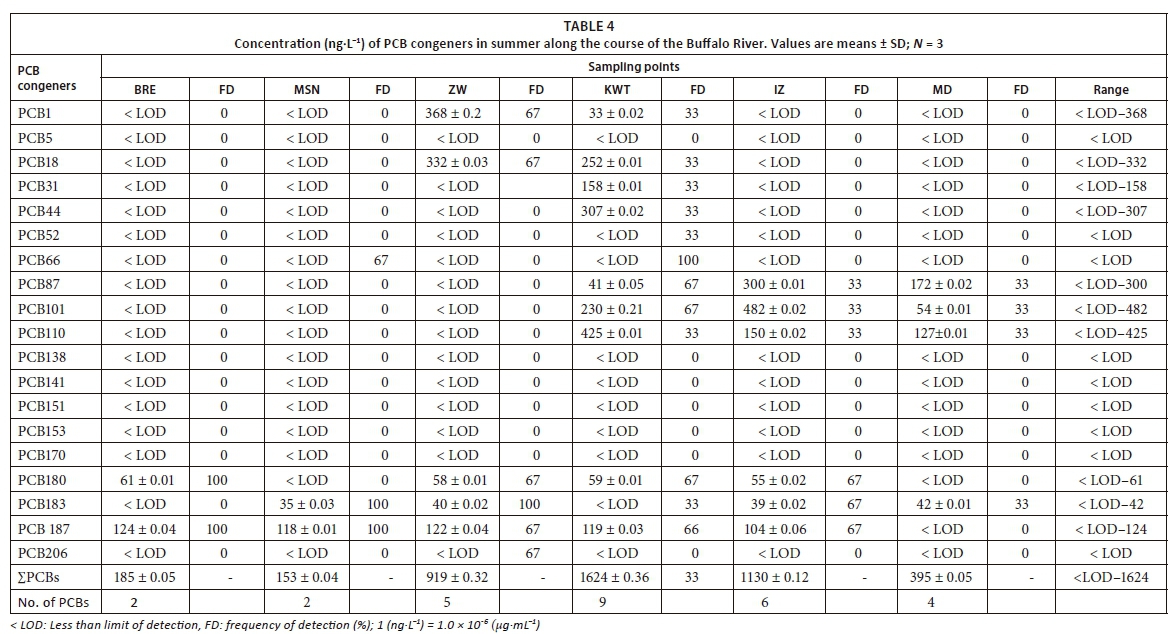
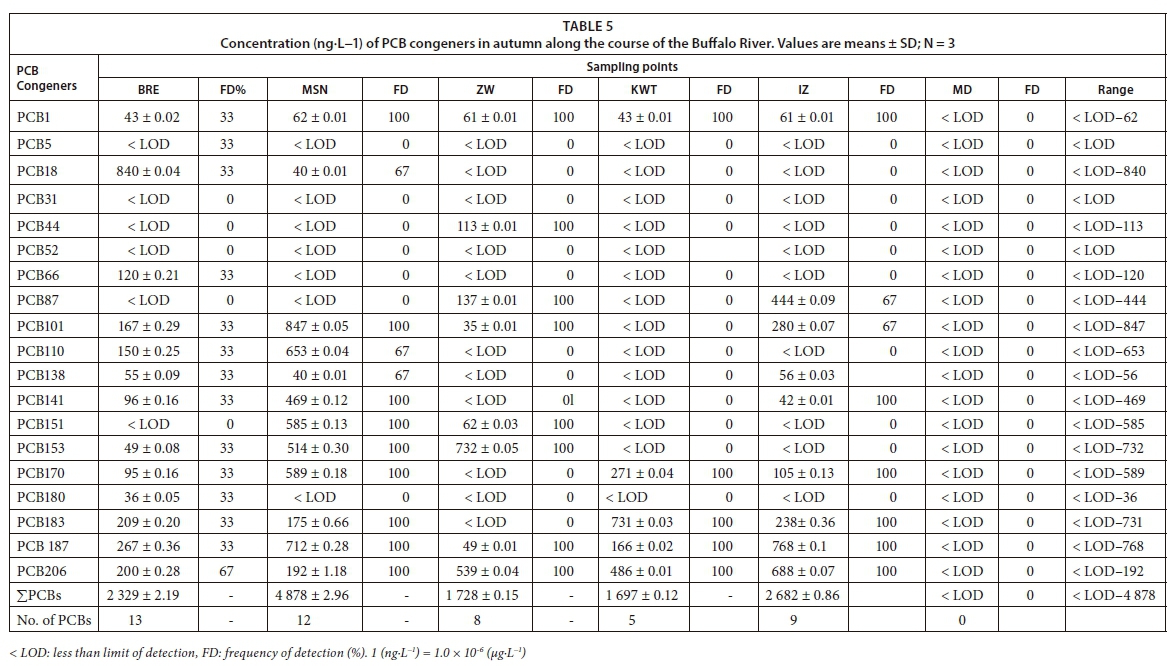
The number of PCB congeners detected at all of the sampling sites in summer was between 2 and 9 (Table 4). PCB 101, which had the highest concentration, was present at all the sites except MD. 11% of the total concentration of PCBs were detected at BRE and MSN. The total concentration of PCBs at IZ where maximum concentration was found ranged from below limit of detection (< LOD) to 482 ng·L−1. The frequency of detection of PCB 180, 183 and 187 was 100% at some sampling points in summer. In autumn, there was a remarkable increase in the number of PCBs detected from the 6 sampling locations (Table 5). At MSN, most of the analytes were 100% present but varied in detection frequency at other sites from 33% to 100%. The total PCB concentration varied from < LOD to 4 878 ng·L−1.
The organic pollutants were more dispersed in summer than autumn. The highest level of PCBs in summer was recorded at KWT and the lowest at MSN. By contrast, the maximum and minimum concentrations in autumn were obtained at MSN and MD, respectively.
DISCUSSION
Level and spatial variation of PCBs in the water samples
The increase in PCB levels in autumn, especially for PCBs 18 and 170 could be due to industrial effluent discharge which was carried into the water body by rain (Xu et al., 2016; Megahed et al., 2015; Kalajzic et al., 1998). Furthermore, heavy PCB congeners (e.g. PCB 101) were detected at high concentrations in summer and autumn. This may be attributed to the input from municipal and industrial effluent discharge, including caulking (BRE, 2016; Zhang et al., 2004).
The higher level of PCBs in autumn at MSN could be as a result of rainfall, leaching from refuse at the dumpsite, waste release from Mdantsane sewage works, and the Potsdam treatment works that drains into the river. During the period of sampling, the water was noticeably green in colour, which could possibly be related to the discharge of waste from a food processing factory and a textile industry, entering through minor streams like Tindeli, Sitotana and Shangani that flow through Mdantsane into the Bridle Drift Dam (Chigor et al., 2013; RHP, 2003; RHP, 2004).
Similarly, the concentrations were relatively higher in autumn than in summer at ZW. Suspected close sources of pollution to the sampling locations include influx of wastes from agricultural farm lands, refuse dumpsites, sewage outfalls and aerated treatment ponds (Yadav et al., 2015; Sarkar et al., 2008). Higher concentrations recorded in autumn might be attributed to possible precipitation and sweeping of higher concentrations of pollutants into the water body as the level of rainfall increased. Similarly, the higher temperatures experienced in summer could have enhanced degradation of organic pollutants, resulting in the decreased concentrations witnessed in the water phase (RHP, 2004; Adeniji et al., 2017; Yahaya et al., 2017).
Furthermore, the high concentration of PCBs detected at KWT could be due to industrial effluent from a textile factory, an old tannery irrigation site and a saw mill, domestic waste, as well as sewage disposed from KWT into the water body (Fatoki and Awofolu, 2003; Olujimi et al., 2012; Bouraie et al., 2011). It has been reported that decomposition of PCBs decreases with an increase in the amount of chlorine (Duan et al., 2015; Huang et al., 2015). More so, previous findings showed that light PCBs, such as those with 2, 3 or 4 chlorine atoms, volatilized from the topmost water level. This could explain the presence of heavy PCBs such as the hexa-, hepta-, octa- and nona-chlorobiphenyls that were found in high concentrations in the autumn (Gui et al., 2014; Ge et al., 2014; Huang et al., 2014; Lohmann et al., 2007). Temperature, pH and oxidation reactions could be responsible for variation in concentrations of the analytes across the seasons of the year (RHP, 2004).
The river water at Izele town was also found to have higher concentrations of the congeners in autumn than summer, possibly because of the influx of domestic and agricultural wastes, and less volatilization in this season (Kishida, 2013; Toan, 2015; Fatoki and Awofolu, 2003).
Although, MD is often assumed to be pristine in view of the low number of anthropogenic impacts relative to other parts of the catchment, long-distance air transport of these pollutants from the suburb are suspected (Chao et al., 2014; Ren et al., 2014; Hung et al., 2013; Adeniji et al., 2018). The sum total concentrations of PCBs in summer and autumn were high when compared with findings reported for other studies in South Africa, China, Iran, USA and Brazil, but in summer the results were lower, and in autumn were higher than findings reported from Egypt (Megahed et al., 2015) and Spain (Prieto et al., 2007). Previous work on PCB concentrations in a surface water in Johannesburg, South Africa, reported concentrations that ranged from 21 to 120 ng·L−1 (Amdany et al., 2014). Seasonal variations have also been reported. For example, Hassan et al. (2013) reported 10-250 ng·L−1 and 20-390 ng·L−1 in cold and warm seasons, respectively, in Iran, whereas 3.17-6.09 ng·L−1 in winter and 0.19-0.99 ng·L−1 in summer were reported in China (Ge et al., 2014), and 0.02-0.5 ng·L−1 for surface water in Brazil (Pérez-Carrera et al., 2007), 3 884-4 314 ng·L−1 for Spain (Prieto et al., 2007), 0.31-42.75 ng·L−1 in the USA's Lake Ontario (Oliveira et al., 2011) and a high value of 5 344 ng·L−1 was reported for the River Nile, Egypt (Megahed et al., 2015).
The essence of monitoring PCB-contaminated water is to reduce the health risk to humans as well as wildlife (Hope et al., 2008). A target value of 500 ng·L−1 has been recommended by the United States Environmental Protection Agency (USEPA) as the permissible limit (USEPA, 2012). The PCB concentration determined along the course of Buffalo River in autumn was however higher than the USEPA-recommended maximum limit, except for the value obtained from the Maden Dam.
Risk assessment
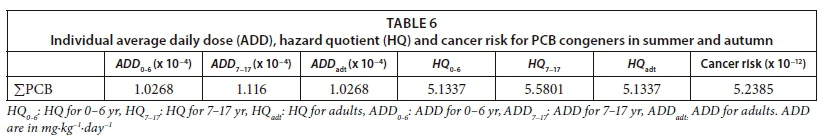
The period of exposure to organic pollutants is a key factor to be considered in assessing the health risk of a living organism (Sethajintanin and Anderson, 2006; Budroe et al., 2002). The Hazard Quotient (HQ), is the ratio of possible health exposure to a pollutant and the level at which no health effect is expected; if HQ is less than 1 then no health effects at the level of exposure are indicated (ECETOC, 2016; Megahed et al., 2015; AMEC, 2010; Hamilton et al., 2003; ECETOC, 2001; USEPA, 1992). The HQ of this river body was generally above 1. Since the HQ, ADD and LADD were above the permissible limit of 10-4, there are high ecological and health risks (USEPA, 2009; USEPA-IRIS, 2007).
HQs obtained across the sampling sites were generally higher than 1 for all the PCB congeners. The value obtained for age group 7-17 years was higher than for other two categories (Table 6), indicating that people within this group are likely to experience more detrimental effects of non-carcinogenic risk as a result of exposure to water polluted by PCBs than others. However, the cancer risk value estimated as shown in Table 6 was extremely low compared to the acceptable range of 10−4 to 10−6 for all the pollutants. Therefore, there is less likelihood of anyone developing cancer by ingesting the Buffalo River water, especially those in the rural areas who have less access to the public water supply (EPA, 1993, 2005; Megahed et al., 2015; ECETOC, 2016).
CONCLUSION
The concentrations of PCBs in the samples were found to be generally higher than the World Health Organization drinking water (WHO) and USEPA-recommended permissible limits at the six monitored locations, respectively. Although, there is not a likelihood of the users of Buffalo River water developing cancer, high levels of these chemicals in the water imply high exposure risk to the immediate communities subsisting on resources from the water as well as to the general population, since the pollutants will disperse up to several kilometres from the contamination source and may persist for decades, given their high half-lives. Hence, there is a need for strict control and regulations on the use and safe disposal of these organic chemicals in order to safeguard the health of the inhabitants of the communities in the neighbourhood of the river. To the best of our knowledge this was the first time the distribution of these compounds in this river was determined and the risks were assessed.
ACKNOWLEDGEMENTS
The authors are very grateful to the South African Medical Research Council (SAMRC) and National Research Foundation (NRF) for the funds provided for this research.
CONFLICT OF INTEREST
We state that no conflicts of interest exist in respect to publishing these research findings.
REFERENCES
ADENIJI AO, OKOH OO and OKOH AI (2017) Petroleum hydrocarbon profiles of water and sediment of Algoa Bay, Eastern Cape, South Africa. Int. J. Environ. Res. Public Health 14 (10) 1263. https://doi.org/10.3390/ijerph14101263 [ Links ]
ADENIJI AO, OKOH OO and OKOH AI (2017) Petroleum hydrocarbon fingerprints of water and sediment samples of Buffalo River Estuary in the Eastern Cape Province, South Africa. J. Anal. Meth. Chem.2017 Article ID 2629365 13 pp. https://doi.org/10.1155/2017/2629365 [ Links ]
AMDANY R, CHIMUKA L, CUKROWSKA E, KUKUČKA P, KOHOUTEK J and VRANA B (2014) Investigating the temporal trends in PAH, PCB and OCP concentrations in Hartbeespoort Dam, South Africa, using semipermeable membrane devices (SPMDs). Environ. Monit. Assess. 40 (3) 425-436. [ Links ]
AMEC Earth and Environmental (2010) AMEC Human Health Risk Assessment. Enbridge Northern Gateway Project. Calgary, Alberta. URL: https://www.ceaa.gc.ca/050/documents_staticpost/human_health_risk_assessment.pdf (Assessed 10th December, 2016). [ Links ]
BOURAIE MM, EL-BARBARY AA and YEHIA M (2011) Determination of organochlorine pesticide (OCPs) in shallow observation wells from El-Rahawy Contaminated Area, Egypt. Environ. Res. Eng. Manage. 3 (57) 28-38. [ Links ]
BOUWMAN H (2003) POPs in South Africa: The handbook of environmental chemistry. Persistent Org. Pollut. 3 (0) 297-320. https://doi.org/10.1007/10751132_11 [ Links ]
BOUWMAN H, COOPAN RM, REINECKE AJ and BECKER PJ (1990) Levels of DDT and metabolites in breast milk from KwaZulu mothers after DDT application for malaria control. Bull. World Health Organ. 68 761-768. [ Links ]
BOZEK F, ADAMEC V, NAVRATIL J, KELLNER J, BUMBOVA A and DVORAK JLB (2009) Health risk assessment of air contamination caused by polycyclic aromatic hydrocarbons from traffic. Proc. Recent Advances in Environment, Ecosystems and Development. URL: www.wseas.us/e-library/conferences/2009/tenerife/EED/EED-16.pdf (Accessed 10 December 2016). 104-108. [ Links ]
BRE (2016) Buffalo River Estuary, East London. Draft Situation Assessment Report: 30-48. Eastern Cape, South Africa. http://www.cesnet.co.za. (Accessed 20 December 2016). [ Links ]
BUDROE JD, FOWLES JR, POLAKOFF J, FAUST JB, RABOVSKY J, LAM R, COLLINS JF, MARTY MA, MYCROFT FJ and ALEXEEFF GV (2002) Air Toxics Hot Spots Program. Risk Assessment Guidelines. Part II. Technical support document for describing available cancer potency factors. April 1999. California Environmental Protection Agency. URL: https://oehha.ca.gov/media/downloads/crnr/hsca2.pdf (Accessed 15 November 2016). [ Links ]
CHAO HR, LIN DY, CHEN KY, GOU YY, CHIOU TH, LEE WJ, CHEN SJ and WANG LC (2014) Atmospheric concentrations of persistent organic pollutants over the Pacific Ocean near southern Taiwan and the northern Philippines. Sci. Total Environ. 51 (9) 491-492. http://dx.doi.org/10.1016/j.scitotenv.2014.03.017 [ Links ]
CHIGOR VN, SIBANDA T and OKOH AI (2013) Variations in the physicochemical characteristics of the Buffalo River in the Eastern Cape Province of South Africa. Environ. Monit. Assess. 185 (10) 8733-8747. https://doi.org/10.1007/s10661-013-3208-1 [ Links ]
DALLAS H (2008) Water temperature and riverine ecosystems: An overview of knowledge and approaches for assessing biotic responses, with special reference to South Africa. Water SA 34 (3) 393-404. [ Links ]
DAS SK, ROUTH J and ROYCHOUDHURY A (2008) Sources and historic changes in polycyclic aromatic hydrocarbon input in a shallow lake, Zeekoevlei, South Africa. Org. Geochem. 39 1109-1112. https://doi.org/10.1016/j.orggeochem.2008.04.005 [ Links ]
DEROUICHE A, DRISS MR, MORIZUR JP and TAPHANEL MH (2007) Simultaneous analysis of polychlorinated biphenyls and organochlorine pesticides in water by headspace solid-phase microextraction with gas chromatography-tandem mass spectrometry. J. Chromatogr. A 1138 (2) 231-243. https://doi.org/10.1016/j.chroma.2006.10.064 [ Links ]
DUAN X, ZHANG G, RONG L, FANG H, HE D and FENG D (2015) Spatial distribution and environmental factors of catchment-scale soil heavy metal contamination in the dry-hot valley of Upper Red River in southwestern China. Catena 135 59-69. https://doi.org/10.1016/j.catena.2015.07.006 [ Links ]
DOE (Department of Ecology, Washinton State) (1997) Department of Ecology: Analytical Methods for Petroleum Hydrocarbons. Washington State Department of Ecology Toxics Cleanup Program and the Ecology Environmental Laboratory. 1-137. URL: http://www.ecy.wa.gov/programs/tcp/cleanup.html (Accessed 20 July 2015). [ Links ]
ECETOC (2001) Exposure Factors Sourcebook for European Population. ECETOC, Brussels, Belgium. URL: www.ecetoc.org/wp-content/uploads/2014/08/ECETOC-TR-079.pdf (Accessed 5 December 2016). [ Links ]
ECETOC (2016) Guidance for effective use of human exposure data in risk assessment of chemicals. ECETOC, Brussels, Belgium. URL: http://www.ecetoc.org/taskforce/guidance-for-effective-use-of-human-exposure-data-in-risk-assessment-of-chemicals/ (Accessed 5 December 2016). [ Links ]
EL-SHAHAWI MS, HAMZA A, BASHAMMAKH A S and AL-SAGGAF WT (2010) An overview on the accumulation, distribution, transformations, toxicity and analytical methods for the monitoring of persistent organic pollutants. Talanta 80 (5) 1587-1597. http://dx.doi.org/10.1016/j.talanta.2009.09.055 [ Links ]
FATOKI R and AWOFOLU O (2003) Persistent organochlorine pesticide residues in freshwater systems and sediments from the Eastern Cape, South Africa. Water SA 29 (3) 323-330. http://dx.doi.org/10.4314/wsa.v29i3.4934 [ Links ]
GE J, LIU M, YUN X, YANG Y, ZHANG M, LI QX and WANG J (2014) Occurrence, distribution and seasonal variations of polychlorinated biphenyls and polybrominated diphenyl ethers in surface waters of the East Lake, China. Chemosphere 103 256-262. http://dx.doi.org/10.1016/j.chemosphere.2013.12.014 [ Links ]
GE J, WOODWARD LA, LI QX and WANG, J (2013) Distribution, sources and risk assessment of polychlorinated biphenyls in soils from the Midway Atoll, North Pacific Ocean. PLOS One 8 (8) 1-7. https://doi.org/10.1371/journal.pone.0071521 [ Links ]
GRIMM FA, HU D, KANIA-KORWEL I, LEHMLER HJ, LUDEWIG G, HORNBUCKLE KC, DUFFEL MW, BERGMAN A and ROBERTSON LW (2015) Metabolism and metabolites of polychlorinated biphenyls. Crit. Rev. Toxicol. 45 (3) 245-272. https://doi.org/10.3109/10408444.2014.999365 [ Links ]
GUI D, YU R, HE X, TU Q and WU Y (2014) Tissue distribution and fate of persistent organic pollutants in Indo-Pacific humpback dolphins from the Pearl River Estuary, China. Mar. Pollut. Bull. 86 (2) 266-273. http://dx.doi.org/10.1016/j.marpolbul.2014.07.007 [ Links ]
HAMILTON DJ, AMBRUS Á, DIETERLE RM, FELSOT AS, HARRIS CA, HOLLAND PT, KATAYAMA A, KURIHARA N, LINDERS J, UNSWORTH J and WONG SS (2003) Regulatory limits for pesticide residues in water (IUPAC Technical Report). Pure Appl. Chem. 75 (8) 1123-1155. https://doi.org/10.1351/pac200375081123 [ Links ]
HASSAN J, NEJATKHAH P and DARABI E (2013) Polychlorinated biphenyls hot and cold seasons distribution in see water sediment and fish samples in the Khour-e-Mousa (Mah-Shahr), Iran. Chemosphere 90 (9) 2477-2482. http://dx.doi.org/10.1016/j.chemosphere.2012.11.006 [ Links ]
HOPE B, SCATOLINI S, TITUST E and COTTER J (1997) Distribution patterns of polychlorinated biphenyl congeners in water, sediment and biota from Midway Atoll (North Pacific Ocean). Mar. Pollut. Bull. 34 (7) 548-563. https://doi.org/10.1016/S0025-326X(96)00180-4 [ Links ]
HOPE BK (2008) A model for the presence of polychlorinated biphenyls (PCBs) in the Willamette River basin (Oregon). Environ. Sci. Technol. 42 (16) 5998-6006. https://doi.org/10.1021/es8000213 [ Links ]
HUANG S, HE S, XU, H, WU P, JIANG R, ZHU F, LUAN T and OUYANG G (2015) Monitoring of persistent organic pollutants in seawater of the Pearl River Estuary with rapid on-site active SPME sampling technique. Environ. Pollut. 200 149-158. http://dx.doi.org/10.1016/j.envpol.2015.02.016 [ Links ]
HUANG Y, LI J, XU Y, XU W, CHENG Z, LIU J, WANG Y, TIAN C, LUO C and ZHANG G (2014) Polychlorinated biphenyls (PCBs) and hexachlorobenzene (HCB) in the equatorial Indian Ocean: Temporal trend, continental outflow and air-water exchange. Mar. Pollut. Bull. 80 (2) 194-199. http://dx.doi.org/10.1016/j.marpolbul.2014.01.007 [ Links ]
HUNG H, MACLEOD M, GUARDANS R, SCHERINGER M, BARRA R, HARNER T and ZHANG G (2013) Toward the next generation of air quality monitoring: Persistent organic pollutants. Atmos. Environ. 80 591-598. https://doi.org/10.1016/j.atmosenv.2013.05.067 [ Links ]
JACQUET R, MIÈGE C, SMEDES F, TIXIER C, TRONCZYNSKI J, TOGOLA A, BERHO C, VALOR I, LLORCA J, BARILLON B, MARCHAND P and COQUERY M (2014) Comparison of five integrative samplers in laboratory for the monitoring of indicator and dioxin-like polychlorinated biphenyls in water. Chemosphere 98 18-27. http://dx.doi.org/10.1016/j.chemosphere.2013.09.011 [ Links ]
KALAJZIC T, BIANCHI M, MUNTAU H and KETTRUP A (1998) Polychlorinated biphenyls (PCBs) and organochlorine pesticides (OCPs) in the sediments of an Italian drinking water reservoir. Chemosphere 36 (7) 1615-1625. https://doi.org/10.1016/S0045-6535(97)10035-2 [ Links ]
KAMPIRE E, RUBIDGE G and ADAMS JB (2017) Characterization of polychlorinated biphenyls in surface sediments of the North End Lake, Port Elizabeth, South Africa. Water SA 43 (4) 646-654. https://doi.org/10.1007/s11356-011-0582-5 [ Links ]
KANZARI F, SYAKTI AD, ASIA L, MALLERET L, MILLE G, JAMOUSSI B, ABDERRABBA M and DOUMENQ P (2012) Aliphatic hydrocarbons, polycyclic aromatic hydrocarbons, polychlorinated biphenyls, organochlorine, and organophosphorous pesticides in surface sediments from the Arc River and the Berre lagoon, France. Environ. Sci. Pollut. Res. 19 (2) 559-576. https://doi.org/10.1007/s11356-011-0582-5 [ Links ]
KIM K, SON SH, KIM K, KIM K and KIM YC (2010) Environmental effects of supercritical water oxidation (SCWO) process for treating transformer oil contaminated with polychlorinated biphenyls (PCBs). Chem. Eng. J. 165 (1) 170-174. https://doi.org/10.1016/j.cej.2010.09.012 [ Links ]
KISHIDA M (2013) Distribution characteristics and source identification of polychlorinated dibenzo-p-dioxin and dibenzofurans, and dioxin-like polychlorinated biphenyls in the waters from River Kanzaki, running through Osaka urban area, Japan. J. Environ. Sci. 25 (3) 441-451. http://dx.doi.org/10.1016/S1001-0742(12)60091-6 [ Links ]
LI QL, WANG X, LIU YL, CHEN XF, WANG ML and ZHAO RS (2014) Feasibility of metal-organic nanotubes coated fibers for solid-phase microextraction of polychlorinated biphenyls in water samples. J. Chromatogr. A 1374 58-65. http://linkinghub.elsevier.com/retrieve/pii/S002196731401838X [ Links ]
LOHMANN R, BREIVIK K, DACHS J and MUIR D (2007) Global fate of POPs: Current and future research directions. Environ. Pollut. 150 (1) 150-165. https://doi.org/10.1016/j.envpol.2007.06.051 [ Links ]
LU Q, FUTTER MN, NIZZETTO L, BUSSI G, JRGENS MD and WHITEHEAD PG (2015) Fate and transport of polychlorinated biphenyls (PCBs) in the River Thames catchment - insights from a coupled multimedia fate and hydrobiogeochemical transport model. Sci. Total Environ. 572 1461-1470. https://doi.org/10.1016/j.scitotenv.2016.03.029 [ Links ]
MEGAHED AM, DAHSHAN H, ABD-EL-KADER MA, ABD-ELALL AMM, ELBANA MH, NABAWY, E and MAHMOUD HA (2015) Polychlorinated biphenyls water pollution along the River Nile, Egypt. Sci. World J. Article ID 389213 1-7. http://dx.doi.org/10.1155/2015/389213 [ Links ]
NIEUWOUDT C, PIETERS R, QUINN L, KYLIN H, BORGEN AR and BOUWMAN H (2011) Polycyclic aromatic hydrocarbons (PAHs) in soil sediment from industrial, residential, and agricultural areas in central South Africa: An initial assessment. Soil Sediment Contam. 20 188-204. https://doi.org/10.1080/15320383.2011.546443 [ Links ]
OLIVEIRA T, SANTACROCE G, COLEATES R, HALE S, ZEVIN P and BELASCO B (2011) Concentrations of polychlorinated biphenyls in water from US Lake Ontario tributaries between 2004 and 2008. Chemosphere 82 (9) 1314-1320. http://dx.doi.org/10.1016/j.chemosphere.2010.12.012 [ Links ]
OLUJIMI OO, FATOKI OS, ODENDAAL JP and DASO AP (2012) chemical monitoring and temporal variation in levels of endocrine disrupting chemicals (priority phenols and phthalate esters) from selected wastewater treatment plant and freshwater systems in Republic of South Africa. Microchem. J. 101 11-23. http://dx.doi.org/10.1016/j.microc.2011.09.011 [ Links ]
OZCAN S, TOR A and AYDIN ME (2009) Determination of selected polychlorinated biphenyls in water samples by ultrasound-assisted emulsification-microextraction and gas chromatography-mass-selective detection. Anal. Chim. Acta 647 (2) 182-188. https://doi.org/10.1016/j.aca.2009.06.037 [ Links ]
PAWELCZYK A (2013) Assessment of health risk associated with persistent organic pollutants in water. Environ. Monit. Assess. 185 497-508. https://doi.org/10.1007/s10661-012-2570-8 [ Links ]
PÉREZ-CARRERA E, LEÓN VML, PARRA AG and GONZÁLEZ-MAZO E (2007) Simultaneous determination of pesticides, polycyclic aromatic hydrocarbons and polychlorinated biphenyls in seawater and interstitial marine water samples, using stir bar sorptive extraction-thermal desorption-gas chromatography-mass spectrometry. J. Chromatogr. A 1170 (2) 82-90. https://doi.org/10.1016/j.chroma.2007.09.013 [ Links ]
PIETERS R (2007) An assessment of dioxins, dibenzofurans and PCBs in the sediments of selected freshwater bodies and estuaries in South Africa. PhD thesis, North-West University. 184 pp. [ Links ]
PRIETO A, ZULOAGA O, USOBIAGA A, ETXEBARRIA N and FERNÁNDEZ LA (2007) Development of a stir bar sorptive extraction and thermal desorption-gas chromatography-mass spectrometry method for the simultaneous determination of several persistent organic pollutants in water samples. J. Chromatogr. A 1174 (2) 40-49. https://doi.org/10.1016/j.chroma.2007.07.054 [ Links ]
RAMOS L, BLANCH GP, HERNFINDEZ L and GONZFILEZ MJ (1995) Recoveries of organochlorine compounds (polychlorinated biphenyls, polychlorinated dibenzo-p-dioxins and polychlorinated dibenzofurans) in water using steam distillation-solvent extraction at normal pressure. J. Chromatogr. A 690 243-249. https://doi.org/10.1016/0021-9673(94)00983-G [ Links ]
REN J, WANG X, XUE Y, GONG P, JOSWIAK DR, XU B and YAO T (2014) Persistent organic pollutants in mountain air of the southeastern Tibetan Plateau: Seasonal variations and implications for regional cycling. Environ. Pollut. 194 210-216. http://dx.doi.org/10.1016/j.bej.2014.03.021 [ Links ]
RIVER HEALTH PROGRAMME (2003) RHP Draft Technical Report: Buffalo River Monitoring, 2003. (March): Eastern Cape, South Africa. 1-275. www.dwaf.gov.za/iwqs/rhp/state_of_rivers.html (Accessed 20 December 2014). [ Links ]
RIVER HEALTH PROGRAMME (2004) RHP Draft Technical Report: Buffalo River Monitoring, 2004 (October): Eastern Cape, South Africa. 1-115. URL: www.dwaf.gov.za/iwqs/rhp/state_of_rivers/ecape_04/BuffRiverRepFnl.pdf (Accessed 20 December 2014). [ Links ]
RIVER HEALTH PROGRAMME (2004) RHP. State of rivers report: Buffalo river system. Technical Report. Department of Water Affairs and Forestry, Pretoria, South Africa. 102 pp. [ Links ]
RISSATO SR, GALHIANE MS, XIMENES VF, DE ANDRADE RMB, TALAMONI JLB, LIBÂNIO M, DE ALMEIDA MV, APON BM and CAVALARI AA (2006) Organochlorine pesticides and polychlorinated biphenyls in soil and water samples in the northeastern part of São Paulo State, Brazil. Chemosphere 65 (11) 1949-1958. https://doi.org/10.1016/j.chemosphere.2006.07.011 [ Links ]
SALEM DMA, EL SIKAILY A and EL NEMR A (2014) Organochlorines and their risk in marine shellfish collected from the Mediterranean coast, Egypt. Egypt. J. Aquat. Res.40 (2) 93-101. https://doi.org/10.1016/j.ejar.2014.03.004 [ Links ]
SARKAR SK, BHATTACHARYA BD, BHATTACHARYA A, CHATTERJEE M, ALAM A, SATPATHY KK and JONATHAN MP (2008) Occurrence, distribution and possible sources of organochlorine pesticide residues in tropical coastal environment of India: An overview. Environ. Int. 34 1062-1071. https://doi.org/10.1016/j.envint.2008.02.010 [ Links ]
SETHAJINTANIN D and ANDERSON KA (2006) Temporal bioavailability of organochlorine pesticides and PCBs. Environ. Sci. Technol. 40 (12) 3689-3695. https://doi.org/10.1021/es052427h [ Links ]
SIBIYA PN (2012) Modification, development and application of extraction methods for PAHs in sediments and water. PhD thesis, University of Johannesburg. 227 pp. [ Links ]
SMITH D and LYNAM K (2012) Analysis and confirmation of PCBs in fish tissue with Agilent J & W DB-35ms and DB-XLB GC Columns Application Note. 1-14. URL: https://www.agilent.com/cs/library/applications/5990-6236EN.pdf (Accessed 14 July 2015). [ Links ]
TOAN VD (2015) Residue of select organochlorine pesticides in sediment from Vietnam's CauBay River and their impact on agricultural soil and human health. Pol. J. Environ. Stud. 24 (1) 301-306. [ Links ]
USEPA (United States Environmental Protection Agency) (2012) USEPA Edition of the Drinking Water Standards and Health Advisories. 1-20. URL: http://water.epa.gov/action/advisories/drinking/upload/dwstandards2012 (Accessed 10 October 2016). [ Links ]
USEPA (United States Environmental Protection Agency) (2009) USEPA National Primary and Secondary Drinking Water Regulations: 1-6. URL: http://www.epa.gov/safewater/EPA816-F-09-004. (Accessed 10 October 2016). [ Links ]
USEPA (United States Environmental Protection Agency) (2007) USEPA Organochlorine Pesticides by Gas Chromatography (Method 8081B), the Scope and Application. USEPA, Washington DC. URL: https://www.epa.gov/sites/production/files/2015-12/documents/8081b.pdf (Accessed 10 October 2016). [ Links ]
USEPA (United States Environmental Protection Agency) (2007) Integrated Risk Information System. USEPA-IRIS Drinking water standards and health advisories table. USEPA, Washington DC. 1-30. URL: www.epa.gov/iris (Accessed 15 December 2016). [ Links ]
USEPA (United States Environmental Protection Agency) (2006) USEPA Standard Operating Procedures for Routine Analysis of PCBs in Water, Soil and Sediment Samples by GC-ECD. USEPA, Washington DC. URL: https://semspub.epa.gov/work/HQ/175405.pdf (Accessed 10 October 2014). [ Links ]
USEPA (United States Environmental Protection Agency) (2005) USEPA Guidelines for Carcinogen Risk Assessment. USEPA, Washington DC. URL: http://www.epa.gov/raf/publications/pdfs (Accessed 20 October 2016). [ Links ]
USEPA (United States Environmental Protection Agency) (1992) USEPA Guidelines for Exposure Assessment, Federal Register. USEPA, Washington DC. URL: http://cfpub.epa.gov/ncea/cfm/recordisplay. Cfmdeid015263 (Accessed 20 October 2016). [ Links ]
USEPA (United States Environmental Protection Agency) (1993) Provisional Guidance for Quantitative Risk Assessment of PAH. EPA/600/R-93/089. USEPA, Washington DC. [ Links ]
WDNR (Wisconsin Department of Natural Resources). Analytical Detection Limit Guidance and Laboratory Guide for Determining Method Detection Limits. 1996 PUBL-TS-056-96. URL: http://dnr.wi.gov/regulations/labcert/documents/guidance/-lodguide.pdf (Accessed 5 October 2017). [ Links ]
WONG M, LEUNG A, CHAN J, CHOI M (2005) A review on the usage of POP pesticides in China, with emphasis on DDT loadings in human milk. Chemosphere 60 740-752. [ Links ]
WORDS K (1998) USEPA Procedures for Wastewater Analyses by Packed Column GC and HPLC. Bulletin 775E.URL: https://www.sigmaaldrich.com/content/dam/sigma-aldrich/docs/Supelco/Bulletin/4486.pdf (Accessed 10 December 2016). [ Links ]
XU EG, BUI C, LAMERDIN C and SCHLENK D (2016) Spatial and temporal assessment of environmental contaminants in water, sediments and fish of the Salton Sea and its two primary tributaries, California, USA, from 2002 to 2012. Sci. Total Environ. 559 130-140. http://dx.doi.org/10.1016/j.scitotenv.2016.03.144 [ Links ]
YADAV IC, DEVI NL, SYED JH, CHENG Z, LI J, ZHANG G and JONES KC 2015. Current status of persistent organic pesticides residues in air, water, and soil, and their possible effect on neighboring countries: A comprehensive review of India. Sci. Total Environ. 511 123-137. http://linkinghub.elsevier.com/retrieve/pii/S0048969714017434 [ Links ]
YAHAYA A, OKOH OO and ADENIJI AO (2017) Occurrences of organochlorine pesticides along the course of the Buffalo River in the Eastern Cape of South Africa and its health implications. Int. J. Environ. Res. Public Health 1372 (14) 1-16. [ Links ]
YU Y, LI Y, SHEN Z, YANG Z, MO L, KONG Y and LOU I (2014) Occurrence and possible sources of organochlorine pesticides (OCPs) and polychlorinated biphenyls (PCBs) along the Chao River, China. Chemosphere 114 136-143. https://doi.org/10.1016/j.chemosphere.2014.03.095 [ Links ]
ZAMXAKA M, PIRONCHEVA G and NYO M (2004) Microbiological and physico-chemical assessment of the quality of domestic water sources in selected rural communities of the Eastern Cape Province, South Africa. Water SA 30 333-340. https://doi.org/10.4314/wsa.v30i3.5081 [ Links ]
ZANG H, YUAN J, CHEN X, LIU C, CHENG C and ZHAO R (2013) Hollow fiber-protected metal-organic framework materials as micro-solid-phase extraction adsorbents for the determination of polychlorinated biphenyls in water samples by gas chromatography-tandem mass spectrometry. Anal. Meth. 5 (18) 4875-4882. https://doi.org/10.1039/c3ay40305j [ Links ]
ZHANG L, THIBODEAUX L, JONES L and LOHMANN R (2015) Simulation of observed PCBs and pesticides in the water column during the North Atlantic bloom experiment. Environ. Sci. Technol. 49 13760-13767. https://doi.org/10.1021/acs.est.5b00223 [ Links ]
ZHANG Z, HUANG J, YU G and HONG H (2004) Occurrence of PAHs, PCBs and organochlorine pesticides in the Tonghui River of Beijing, China. Environ. Pollut. 130 249-261. https://doi.org/10.1016/j.envpol.2003.12.002 [ Links ]
Received 2 June 2017
Accepted 20 September 2018
* To whom all correspondence should be addressed. e-mail: yahayaabdulrazaq2012@gmail.com.

