


Servicios Personalizados
Articulo
 Inglés (pdf)
 Articulo en XML
 Referencias del artículo
Indicadores

Links relacionados
-
 Citado por Google
 -
 Similares en Google
Compartir

 Permalink
Water SA
versión On-line ISSN 1816-7950
versión impresa ISSN 0378-4738
Water SA vol.44 no.4 Pretoria oct. 2018
http://dx.doi.org/10.4314/wsa.v44i4.08
ORIGINAL ARTICLES
Mapping of water-related ecosystem services in the uMngeni catchment using a daily time-step hydrological model for prioritisation of ecological infrastructure investment - Part 2: Outputs
CJ HughesI, *; G de WinnaarII; RE SchulzeI; M ManderIII; GPW JewittI, IV
ICentre for Water Resources Research, University of KwaZulu-Natal, Rabie Saunders Building, Carbis Road, Pietermaritzburg, South Africa
IIGroundTruth Water, Wetlands and Environmental Engineering, 9 Quarry Road, Hilton, South Africa
IIIFutureWorks, The Southern Right, Brenton on Sea, Knysna, South Africa
IVUmgeni Water Chair of Water Resources Management
ABSTRACT
South Africa is a semi-arid country which frequently faces water shortages, and experienced a severe drought in the 2016 and 2017 rainfall seasons. Government is under pressure to continue to deliver clean water to the growing population at a high assurance of supply. Studies now show that the delivery of water may be sustained not only through built infrastructure such as dams and pipelines, but also through investment in ecological infrastructure (EI). Part 1 of this paper in 2 parts concentrated on the role of EI in delivering water-related ecosystem services, as well as the motivation for this study, and the methods used in modelling and mapping the catchment. Part 2 explores and illustrates the current level of delivery of water-related ecosystem services in different parts of the catchment, with potential hydrological benefits of rehabilitation and protection of EI in the uMngeni catchment. The Mpendle, Lions River, Karkloof, Inanda and Durban sub-catchments are important areas for the generation of streamflows which accumulate downstream (i.e. water yield in the catchment) when annual totals are considered. Modelled annual sediment yield (in tonnes) from naturally vegetated areas is most severe in the lower catchment areas with steeper slopes such as Inanda, and in the high-altitude areas which have both steeper slopes and higher rainfall. The central and eastern parts of the uMngeni catchment were found to contribute the greatest yield of sediment from degraded areas with low protective vegetation cover. This combined modelling and mapping exercise highlighted areas of priority ecosystem service delivery, such as higher altitude grassland areas, which could be recommended for formal conservation, or protection under private partnerships. Generally, these areas confirm the intuitive sense of catchment stakeholders, but provide a robust and more defendable analysis through which water volumes are quantifiable, and potential investment into catchment interventions are justified.
Keywords: water, ecosystem services, hydrological modelling, ecological infrastructure, rehabilitation
INTRODUCTION
There is growing concern over the sustainability of water supply for various uses to the large economic centres of Durban and Pietermaritzburg in the province of KwaZulu-Natal (KZN) in South Africa. Southern Africa experienced a severe drought associated with an El Niño event in 2015/6, with exceptionally high temperatures and the lowest rainfall in 35 years in parts of the region, which has significant implications for water resources and for agriculture in particular - a key sector in KZN (SADC, 2016), and alternative methods of achieving water security are being sought.
This study is reported in two companion papers. Part 1 describes the setting up of a daily time-step hydrological model and land cover parameterisation (Hughes et al., 2018). The focus of this paper is to investigate which areas within the catchment currently supply high levels of water-related ecosystem service delivery, and will continue to do so if sustainably managed, as well as those areas which would provide the most significant service delivery improvements should they be rehabilitated. The key rehabilitation interventions could include grassland rehabilitation through improved management practices (livestock management, fire regime maintenance) and control of invasive alien plants (AIPs).
MATERIALS AND METHODS
The methods used for hydrological modelling and mapping for the identification of priority areas for water-related ecosystem service delivery are described in full by Hughes et al. (2018) and summarised below.
Model setup
The ACRU (Agricultural Catchments Research Unit) model (Schulze, 1995 and updates), which has been developed and used extensively in the uMngeni catchment by the University of KwaZulu-Natal and others, was used to model and map water-related ecosystem services. ACRU is a detailed process-based, daily time-step hydrological model, which is able to operate at an appropriate spatial scale for catchment and sub-catchment level water resources planning.
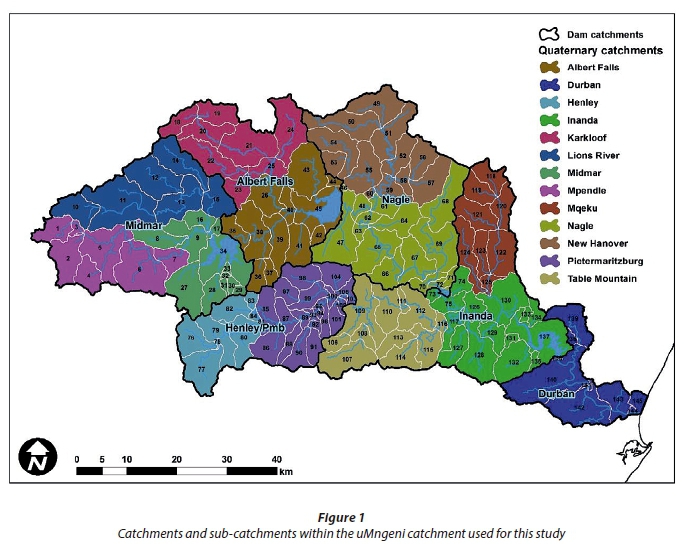
The uMngeni catchment was delineated into 145 sub-catchments (Fig. 1) by Warburton et al. (2010) and their delineation was followed in this study (Hughes et al., 2018). These sub-catchments range in area from 37 to 11 000 ha (i.e., 0.37 to 110 km2), and are differentiated on the basis of soils, altitude, topography, land cover, water management practices and gauging stations within the uMngeni catchment. The sub-catchments were all grouped within 13 quaternary catchments, largely aligning with the operational quaternary catchments used by the South African Department of Water and Sanitation for water resource planning purposes (Fig. 1, see Part 1: Hughes et al., 2018).
Each of the 145 sub-catchments was, in turn, further sub-delineated into hydrological response units (HRUs), primarily on the basis of discrete land cover types, including healthy natural vegetation, degraded lands and areas under IAPs. The 13 quaternaries were further grouped into 6 'dam' catchments to analyse different user groupings based on population clusters and areas supplied by each of the dams. In turn, it was possible to analyse the demand for ecosystem services from EI within each dam catchment. Daily time-series outputs from the ACRU model allow the user to analyse the delivery of water-related ecosystem services for each HRU within the sub-catchments over time (See Part 1 of this study).
Selection of outputs
The ACRU model produces a daily time series of a wide range of outputs. These time series can then be analysed to assess and map water-related ecosystem services for each HRU within each catchment. The following outputs were selected for detailed analysis, with reasons for their selection also given:
-
Runoff, which provides/supplies water within a year for domestic, industrial, ecological and recreational use, and is made up of the quickflow and baseflow from a sub-catchment (see below), and which when accumulated downstream is modelled and mapped as streamflow.
-
Baseflow, which maintains water supply during dry periods and maintains water quality by dilution of excess nutrients and waste and/or sustaining the ecosystems that assimilate pollutants; baseflow is the water which has infiltrated through the soil layers to recharge to the groundwater store which then discharges into the rivers to sustain their flows, particularly during the dry season.
-
Quickflow is the non-delayed stormflow, i.e., water available from the surface or near-surface on the same day as the rainfall event; much of this is captured by dams and sustains water supplies.
-
Sediment yield, which is the soil mobilised/eroded from the landscape portion of the catchment and deposited/transported in the channel portion of the catchment; high sediment loads can degrade river ecosystems and fill dams, reducing their storage capacity and reducing water security.
The potential improvements in water-related ecosystem service delivery following rehabilitation were calculated from the difference between the quantity of water or sediment generated per hectare for each degraded HRU (overgrazed or IAP-infested), and that from the same HRU under non-degraded natural vegetation. The results were than summarised for each HRU within the catchment and represented spatially using GIS. Complete restoration to pristine natural vegetation is highly unlikely, but this does give an indication of the potential quantity of benefits and where they are the greatest.
RESULTS AND DISCUSSION
Analysis of the land cover data indicated that the Inanda and Midmar Dam catchments have the highest proportion of healthy ecological infrastructure (i.e. intact grasslands, riparian zones, wetlands), covering approximately 60% of each respective area. The most transformed areas are Nagle and Durban. The relative presence of degraded vegetation and invasive alien wattle is highest within the Henley/Pietermaritzburg and Inanda Dam catchments (7%), according to the available dataset provided by Umgeni Water (see Part 1 of this study).
Dry-season baseflow
Since there is a lag in baseflow response, the winter dry season lows are only apparent later in the year. Thus, the average volumes have been accumulated for the months of August, September and October. The most important sub-catchments for sustained, dry-season baseflow delivery are the far west and higher altitude areas of the Mpendle and Lions River quaternary catchments, as well as the lower areas of the Nagle and Inanda quaternary catchments (Fig. 2a). Conservation and/or maintenance of these areas could assist in the delivery of water supply to ecosystems and especially communities who are reliant on run-of-river abstractions throughout the year, i.e., the ecological reserve.
The overall volume of dry-season baseflow and delivery per hectare is highest from natural vegetation (Fig. 2b), and much lower from degraded vegetation and IAP infested areas (Fig. 2 d,f). Owing to the loss of vegetation from the surface of degraded lands, interception and infiltration are reduced, and precipitation is likely to flow more directly off the surface as quickflow (see the next section), rather than infiltrating to the lower soil layers and becoming baseflow. In general, the model's simulation of higher water use by IAPs is consistent with other studies (Le Maitre et al., 2013; Everson et al., 2014), implying that less water is able to reach the lower soil layers, with the dry-season baseflow per hectare thus being lower (Fig. 2f) than for natural vegetation (Fig. 2b). However, as explained in Part 1, our assumption is that in their invasive form in the catchment, IAPs occur in stands that are less dense than those in managed plantations (as reported by Schulze and Schütte, 2014) and this is reflected in these results. Everson et al. (2014) found that wattle trees dried up the riparian zone entirely in their case study catchment, although this was in a small catchment entirely infested by wattles.
Following the hypothetical effective rehabilitation of the overgrazed HRUs to natural vegetation, the greatest benefits are to be gained in New Hanover, Mqeku and Nagle, which are in the lower altitude parts of the catchment (in the Savanna Biome), with a maximum potential gain of 260 m3/ha during the dry season. Following the rehabilitation of IAPs, the largest modelled benefits are to be gained in the high altitude, north-western parts of the catchment, although it should be noted that the coverage of wattle trees in the catchment used for this study is mainly concentrated in this area. The maximum potential gain is estimated to be 70 m3/ha (Fig. 3).
Although the improvements in dry season baseflow volumes per hectare do not appear large, it is important to note the value of this ecosystem service. Dry season baseflow, i.e., the sustained flow of water during the dry season, ensures that there is adequate water supply for ecosystem function, as well as human users during the months in which rain does not generally fall (winter in the uMngeni catchment). Baseflow is vital for the health of the ecosystem in terms of maintaining ecological processes such as the provision of animal habitats and refugia, assimilation of pollutants and nutrient cycling (Brauman et al., 2007).
The effective rehabilitation of degraded grasslands implies that there is improved vegetation cover, which results in increased interception of precipitation, but especially higher infiltration of precipitation and then percolation into the lower soil layers. This allows for baseflow accumulation and recharge of the groundwater store, which contributes to the sustainability of dry season water supply.
Quickflow
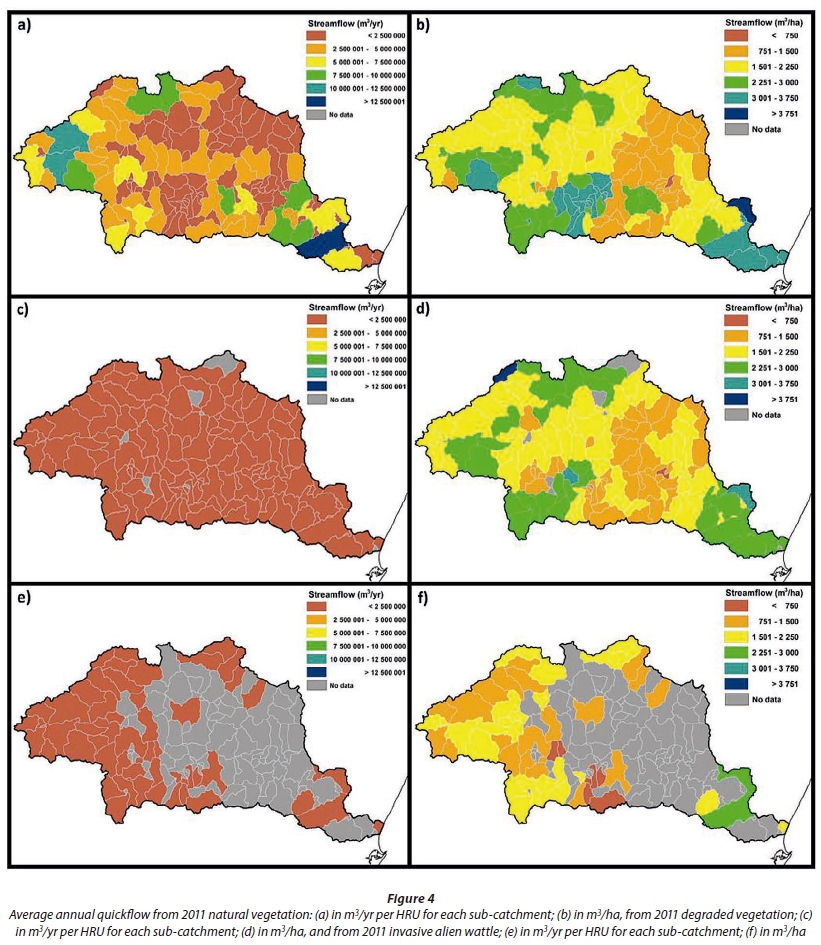
Annual quickflow volume is particularly high in the steeper, higher altitude areas of Karkloof, Mpendle and Lions River where rainfall is relatively high (Fig. 4a/b). It is also high in the lower parts of the uMngeni catchment such as in the Inanda and Durban Quaternaries, again where rainfall is relatively high. Important areas for quickflow generation are also located around the Albert Falls and Inanda Dams. This has implications, inter alia, for sediment delivery to these impoundments and loss of dam capacity, probably leading to an inability for dams to continue delivering water to a growing society in the long term, as stated in Part 1 of this study. Regulation of quickflow volumes through preservation of a healthy vegetation cover not only reduces excessive sediment generation and associated loss of nutrients (Brauman et al., 2007), but can also prevent flooding and associated risk to life and infrastructure.
Quickflow is higher per hectare from degraded vegetation (Fig. 4d) than from natural vegetation (Fig. 4b), highlighting that areas which have been denuded of vegetation do not allow for adequate retention of precipitation through infiltration, and that water flows in greater volumes off the surface, potentially also resulting in soil erosion and soil nutrient losses. The modelling and mapping also indicate that invasive IAPs reduce quickflow from the surface when compared with natural vegetation (Fig. 4f), potentially due to higher interception as well as higher transpiration rates resulting in surface soil moisture deficits which must first be replenished by rain before they lead to runoff, and higher canopy/litter interception.
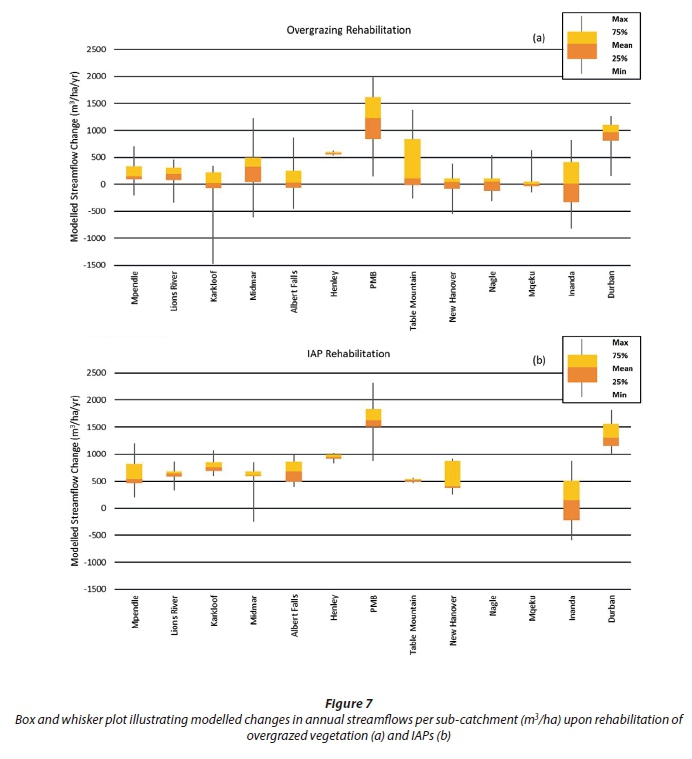
The amount of surface runoff increases with overgrazing due to the lack of vegetation and, as such, upon the rehabilitation of denuded areas the amount of surface runoff is reduced. This implies that upon rehabilitation, less precipitation will run off the surface, and more will be infiltrated and percolate to the lower layers of soil. The largest modelled reduction in surface runoff upon rehabilitation was found to be in the high-altitude grassland areas of Mpendle (median value of 700 m3/ha per year). Rehabilitation is furthermore likely to reduce the amount of high-energy runoff from the catchment, and prevent excessively high levels of sediment and nutrient mobilisation.
Rehabilitation of IAPs reduces the high rate of evapotranspiration, increasing the amount of available water and, in turn, the surface runoff (Fig. 5b) by up to 1 100 m3/ha per year. The greatest benefits are in the high-altitude areas of the Karkloof catchment.
Streamflow
The streamflow exiting into the river channel at the outlet of each sub-catchment is an indication of the water that is available for use for ecosystem function, domestic use and drinking water or irrigation. In the ACRU model, streamflow is a combination of the volumes of baseflow and quickflow produced within a sub-catchment, together with any runoff accumulated from upstream within a catchment based on the upstream to downstream sub-catchment flow paths.
As was the case for dry season baseflow and annual quickflow, the Mpendle, Lions River, Karkloof, Inanda and Durban Quaternary catchments are also important areas for the generation of accumulated streamflows when annual totals are considered (Fig. 6a). The Pietermaritzburg and Henley catchments are also sources of higher streamflow generation per hectare (Fig. 6b). Total streamflow volumes per month (Fig. 6c) appear to be low for the degraded catchments. However, this is due to their small size, which is why it is also important to view the results on a unit area basis (per hectare) (Fig. 6d). In certain parts of the uMngeni catchment, degraded vegetation provides a higher streamflow per hectare than healthy vegetation. However, the negative effects associated with higher quickflow from degraded vegetation (erosion, nutrient mobilisation, flooding risk) may outweigh the positive gains in streamflow. It may therefore be preferable to restore degraded vegetation to natural vegetation given the potential gains in baseflow and associated improvement in sustained water supply and quality during the dry-season.
Owing to the high water use by woody IAPs, as well as the reduction in the amount of available water in the catchment due to overgrazing (mainly in the below-ground layers of soil), the rehabilitation of these two forms of degradation is likely to result in an increase in overall water availability in the catchment. The greatest improvements in streamflow upon rehabilitation of overgrazed lands were found to be in the rapidly urbanising catchments around Pietermaritzburg and Durban (median values of around 1 000 m3/ha per year, Fig. 7). In terms of rehabilitation of IAP-infested areas, a similar pattern is evident, with a potential median increase of up to 1 600 m3/ha.
Sediment yield
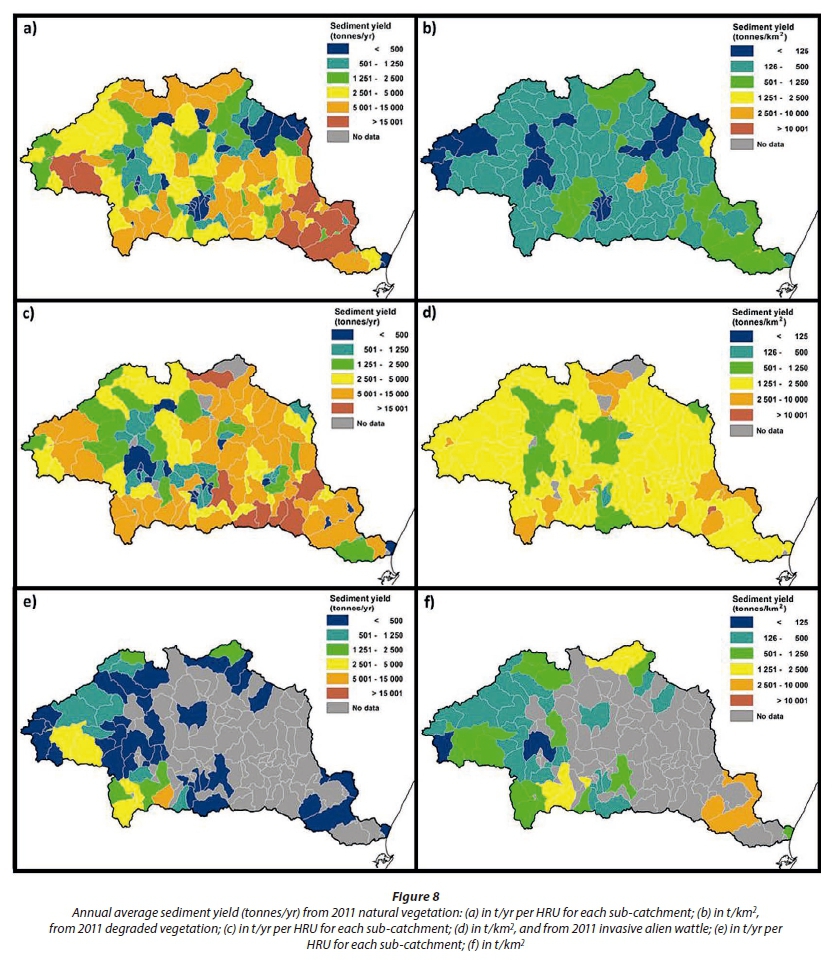
According to Msadala et al. (2010), measured natural sediment yield values for KwaZulu-Natal vary between 30 t/km2 per year and 1 037 t/km2 per year. This large range is based on geological variations within the region, with varied land uses from cattle farming to sugarcane farming (Msadala et al., 2010). Most of the uMngeni catchment has previously been mapped as having high, very high or extremely high erodibility according to the Revised Sediment Yield Map of Southern Africa (Rooseboom et al., 1992) and Le Roux et al. (2008). Modelled annual sediment yield (in tonnes) from naturally vegetated areas is most severe in the lower catchment areas with steeper slopes such as Inanda, and in the high-altitude areas which have steeper slopes and higher rainfall (Mpendle - Fig. 8a). The central and eastern parts of the uMngeni catchment were found to contribute the greatest yield of sediment from degraded areas with low protective vegetation cover (Fig. 8c).
Degraded land (Fig. 8d) produces considerably higher sediment yields per km2 when compared with natural vegetation and wattle-infested lands. Sediment yield per unit area is particularly severe towards the lower part of the catchment, notably around the urbanising areas of Pietermaritzburg and Durban. Wattle-infested areas produce slightly higher sediment yield per unit area than naturally vegetated areas, according to the modelling results. This indicates that IAPs, while reducing quickflow overall in a catchment, also cause a drying of the upper soil layer and associated mobilisation of soils, leading to higher sediment yields (Dye and Jarmain, 2004). Furthermore, A. mearnsii trees have been found to leave little ground cover in dense invasive stands (van der Waal et al., 2012), which leads to a low lower basal cover - an important parameter in the Modified Universal Soil Loss Equation which is used within the ACRU model to generate sediment yields.
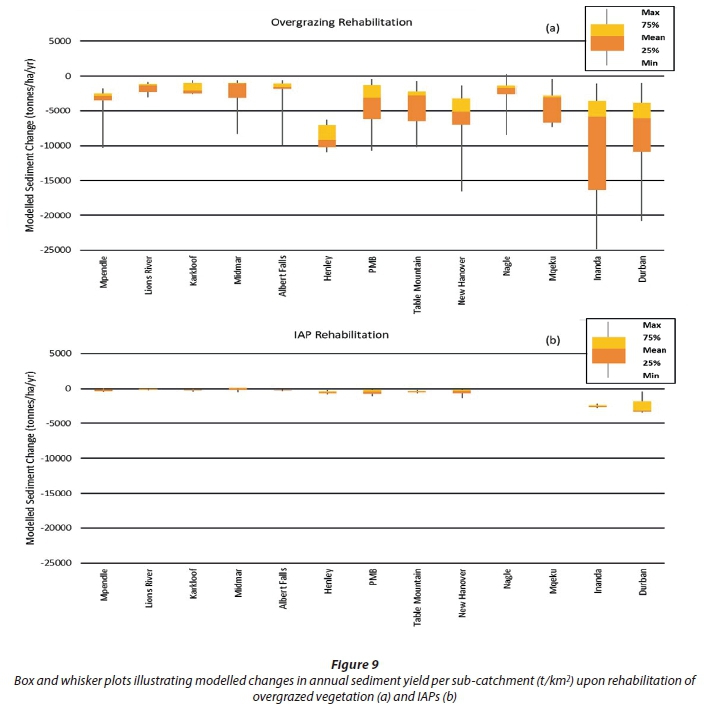
Based on the modelling results, the greatest reduction in sediment generation through rehabilitation of overgrazed land could be achieved near the coast, in the Inanda and Durban catchments (Fig. 9; median reduction of approximately 6 000 t/km2). This is highly pertinent as this area is undergoing extensive transformation in terms of industry and residential developments, and it is important that the sediment and nutrient balance be maintained to ensure natural ecosystem functionality and the health of the estuary downstream (Adams et al., 2016; Cooper, 1993). Upon removal of IAPs, benefits can be achieved, particularly in the coastal catchments, although these are not as high as those to be gained upon the rehabilitation of overgrazed lands.
Limitations of the study
The time and budget constraints did not allow for the explicit modelling of riparian zones and wetlands. In addition, the study was limited by the outdated spatial data related to the extent of IAP infestations in the catchment, but we did use the most reliable data available at the time. These factors are likely to have resulted in an underestimation the reductions in flows due to IAPs and the impacts of factors like sedimentation and reduced baseflows on floodplains and the benefits of their rehabilitation.
CONCLUSION
Water resources researchers are seeking to establish whether healthy ecological infrastructure in water-stressed catchments can be used to augment water supply and to protect vulnerable water source areas from further degradation and transformation. This combined modelling and mapping exercise highlighted areas of priority ecosystem service delivery such as higher altitude grassland areas, which could be recommended for conservation through various mechanisms such as biodiversity stewardship or land partnerships. In many cases, these areas confirm the intuitive sense of those familiar with the catchment, but provide a robust and more defendable analysis through which water volumes are quantifiable. It is also important to view these results in conjunction with water demand information and to hold a thorough, inclusive stakeholder interaction process such that the true benefits of water-related ecosystem service delivery may be assessed, and appropriate steps be taken in policy and planning processes, as well as that more detailed return on investment analyses can be undertaken.
According to the modelling results, significant gains in terms of water-related ecosystem services can be made upon rehabilitation of overgrazed lands, and those which have been invaded by Acacia mearnsii in particular. Dry season baseflow in the catchment could potentially be increased by up to 260 m3/ha for rehabilitation of overgrazed land (more than double), and accumulated streamflows by up to approximately 1 600 m3/ha per annum (~80% increase for the sub-catchment). The results indicate that for dry season baseflow volume improvements, the rehabilitation of overgrazed land produces the best results. In terms of streamflow, the removal of alien plants is likely to improve the delivery of water to the catchment most effectively, and for the entire catchment could significantly increase the annual streamflow. Bearing in mind that the coverage used in this study underestimates the current extent of IAPs, the gains provided through rehabilitation may be even higher. Rehabilitation of overgrazed lands provides land managers with a far better chance of reducing excessive sediment generation within the catchment when compared to IAP clearing, and could furthermore retain valuable nutrients and topsoil and prevent sedimentation of water courses, thereby extending the longevity of dams.
This study approach enabled us to spatially and quantitatively explore the primary hydrological and ecosystem effects of overgrazing and IAP proliferation (as outlined in Fig. 2 in Part 1) within the uMngeni catchment. Comparisons were possible at both sub-catchment scale (for different land covers) and across the entire catchment, thus allowing potential investors in EI to make informed decisions across different scales. Informed by stakeholder needs, such a comparative and spatial approach is recommended for catchment-wide infrastructure and land use planning for the sustained delivery of sufficient clean water to society.
ACKNOWLEDGEMENTS
This work was funded and supported by the Development Bank of South Africa's Green Fund and the South African Department of Environmental Affairs. The final report for this project is Jewitt et al. (2015), and this paper is drawn predominantly from Chapter 3 of this report. The authors wish to acknowledge the support for the wider project from the Water Research Commission through Project K5/2354, the South African National Biodiversity Institute (SANBI), FutureWorks, Umgeni Water, the Institute of Natural Resources, Kevan Zunckel, Prof Mathieu Rouget, Dr Benis Egoh, members of the Centre for Water Resources Research at the University of KwaZulu-Natal and Ezemvelo KZN Wildlife.
REFERENCES
ADAMS JB, COWIE M and VAN NIEKERK L (2016) Assessment of completed ecological water requirement studies for South African estuaries and responses to changes in freshwater inflow. WRC Report No. KV 352/15. Water Research Commission, Pretoria. [ Links ]
BRAUMAN KA, DAILY GC, DUARTE TKE and MOONEY HA (2007) The nature and value of ecosystem services: an overview highlighting hydrologic services. Annu. Rev. Environ. Resour. 32 67-98. https://doi.org/10.1146/annurev.energy.32.031306.102758 [ Links ]
COOPER JAG (1993) Sedimentation in a river dominated estuary. Sedimentology 40 (5) 979-1017. https://doi.org/10.1111/j.1365-3091.1993.tb01372.x [ Links ]
DYE P and JARMAIN C (2004) Water use by black wattle (Acacia mearnsii): implications for the link between removal of invading trees and catchment streamflow response: working for water. S. Afr. J. Sci. 100 (1-2) 40-44. [ Links ]
EGOH B, REYERS B, ROUGET M, RICHARDSON DM, LE MAITRE DC, VAN JAARSVELD AS (2008) Mapping ecosystem services for planning and management. Agric. Ecosyst. Environ. 127 (1) 135-140. https://doi.org/10.1016/j.agee.2008.03.013 [ Links ]
EVERSON CS, CLULOW AD, BECKER M, WATSON A, NGUBO C, BULCOCK H, MENGISTU M, LORENTZ S and DEMLIE M (2014) The long term impact of Acacia mearnsii trees on evaporation, streamflow, low flows and ground water resources: phase II-understanding the controlling environmental variables and soil water processes over a full crop rotation. WRC Report No. 2022/1/13. Water Research Commission, Pretoria. [ Links ]
EZEMVELO KZN WILDLIFE and GEOTERRAIMAGE (2013) 2011 KZN Province Land-cover mapping (from SPOT5 satellite imagery circa 2011): data users report and metadata (version 1d). Unpublished report, Biodiversity Research and Assessment, Ezemvelo KZN Wildlife, PO Box 13053, Cascades, 3202. [ Links ]
HUGHES CJ, DE WINNAAR G, SCHULZE RE, MANDER M and JEWITT GPW (2018) Mapping of water-related ecosystem services in the uMngeni catchment using a daily time-step hydrological model for prioritisation of ecological infrastructure investment -Part 1: Context and modelling approach. Water SA 44 (4) 577-589.https://doi.org/10.4314/wsa.v44i4.07 [ Links ]
JEWITT G, ZUNCKEL K, DINI J, HUGHES C, DE WINNAAR G, MANDER M, HAY D, PRINGLE C, McCOSH J and BREDIN I (eds.) (2015a) Investing in ecological infrastructure to enhance water security in the uMngeni River catchment. Green Economy Research Report No. 1. Green Fund, Development Bank of Southern Africa, Midrand, South Africa. [ Links ]
LE MAITRE DC, FORSYTH G, DZIKITI S and GUSH M (2013) Estimates of the impacts of invasive alien plants on water flows in South Africa. CSIR. Report Number: CSIR/NRE/ECO/ER/2013/0067/B. CSIR, Pretoria. [ Links ]
LE ROUX JJ, MORGENTHAL TL, MALHERBE J, PRETORIUS DJ and SUMNER PD (2008) Water erosion prediction at a national scale for South Africa. Water SA 34 (3) 305-314. [ Links ]
MSADALA V, GIBSON L, LE ROUX J, ROOSEBOOM A and BASSON GR (2010) Sediment yield prediction for South Africa: 2010 Edition. WRC Report No. 1765/1/10. Water Research Commission, Pretoria. [ Links ]
ROOSEBOOM A, VERSTER E, ZIETSMAN HL, LOTRIET HH (1992) The development of the new sediment yield map of South Africa. WRC Report No. 297/2/92. Water Research Commission, Pretoria. [ Links ]
SADC (2016) SADC Regional Situation Update on El Niño-Induced Drought. Issue 01, 15 May 2016. SADC, Gaborone. [ Links ]
SCHULZE RE (1995) Hydrology and Agrohydrology. WRC Report No. TT 69/95. Water Research Commission, Pretoria. 552 pp. ISBN 1 86845 136 4. [ Links ]
SCHULZE RE and SCHÜTTE S (2014) Complexities of streamflow reductions by commercial plantation forests under varying climatic scenarios. Paper presented at: 17th SANCIAHS National Hydrology Symposium, 1-3 September 2014, University of the Western Cape, Bellville. [ Links ]
VAN DER WAAL BW, ROWNTREE KM and RADLOFF SE (2012) The effect of Acacia mearnsii invasion and clearing on soil loss in the Kouga Mountains, Eastern Cape, South Africa. Land Degradation Dev. 23 (6) 577-585. https://doi.org/10.1002/ldr.2172 [ Links ]
WARBURTON ML, SCHULZE RE and JEWITT GPW (2010) Confirmation of ACRU model results for applications in land use and climate change studies. Hydrol. Earth Syst. Sci. Discuss. 14 2399-2414. https://doi.org/10.5194/hess-14-2399-2010 [ Links ]
Received 26 May 2017
Accepted 20 September 2018
* To whom all correspondence should be addressed. +27 79 707 7787; e-mail: catherinejhughes@outlook.com

