


Services on Demand
Article
 English (pdf)
 Article in xml format
 Article references
Indicators

Related links
-
 Cited by Google
 -
 Similars in Google
Share

 Permalink
Water SA
On-line version ISSN 1816-7950
Print version ISSN 0378-4738
Water SA vol.44 n.4 Pretoria Oct. 2018
http://dx.doi.org/10.4314/wsa.v44i4.05
ORIGINAL ARTICLES
Disaggregation of fixed time interval rainfall to continuous measured rainfall for the purpose of design rainfall estimation
OJ Gericke; JPJ Pietersen*
Unit for Sustainable Water and Environment, Department of Civil Engineering, Central University of Technology, Free State, Bloemfontein, South Africa
ABSTRACT
Design rainfall estimates are primarily used in single-event deterministic design flood estimation methods where estimates of the peak discharge are based on the critical storm duration or time of concentration (TC) of a catchment. Therefore, daily design rainfall depths used in flood estimations must either be decreased or increased from durations less than or longer than 24 hours to the design rainfall depths for a rainfall duration of TC. This paper presents the comparison of two South African methods used to convert or scale 1-day fixed time interval observed rainfall (08:00 to 08:00) to continuous measures of n-hour rainfall for selected TC durations at a quaternary catchment level, in the C5 secondary drainage region in South Africa as pilot case study. In each quaternary catchment, the annual maximum series (AMS) of the 1-day fixed time interval point rainfall were extracted, infilled, converted and scaled to appropriate continuous measures of TC-hour point rainfall using conversion factors (Adamson, 1981) and scaling factors (Smithers and Schulze, 2003), respectively. Thereafter, all the TC-hour observed point rainfall values were averaged to observed catchment rainfall at a quaternary catchment level using the Thiessen polygon method. In using the two methods to estimate continuous short-duration n-hour (TC ≤ 24 hours) and long-duration n-hour (TC > 24 hours) catchment rainfall from 1-day fixed time interval point rainfall, an acceptable (0.71 < r2 ≤ 0.86) and high (r2 ≥ 0.93) degree of association were achieved, respectively, despite the different approaches used in each method. Overall, the results confirmed that fixed time interval rainfall should be scaled to continuous measures of rainfall using the Smithers-Schulze scale invariance approach for various TC durations in the case study area. In comparison to the Adamson conversion methodology, the Smithers-Schulze scaling methodology is also based on a more extensive and recent rainfall database as incorporated in software for design rainfall estimation in modern flood hydrology practice in South Africa.
Keywords: observed rainfall, design rainfall, time of concentration, conversion factors, scaling factors
INTRODUCTION
Observed rainfall data in South Africa can be obtained from continuously recording rainfall stations or from daily rainfall stations where rainfall depths are recorded at a fixed daily interval (08:00 to 08:00). In South Africa, daily rainfall data are more abundant, reliable and generally have longer record lengths than the digitised sub-daily rainfall data, e.g., nearly 4 000 daily rainfall stations have record lengths of 20 years and longer, while more than 1 800 daily rainfall stations have more than 40 years of record (Smithers and Schulze, 2000b; 2004). Hence, due to the availability and quality of daily rainfall data, these datasets could be used to estimate design rainfall, especially in those cases where practitioners do not use the methodology and design rainfall estimation software as developed by Smithers and Schulze (2003; 2004). Design rainfall comprises of a depth of rain for a selected duration which is associated with a given annual exceedance probability (AEP) or return period (T) (Gericke and Du Plessis, 2011), and is primarily used in single-event deterministic design flood estimation methods where estimates of the peak discharge are based on the critical storm duration or time of concentration (TC) of a catchment, while the catchment is assumed to be at an 'average condition' and the hazard or risk associated with a specific event is reflected by the probability of the 1:T-year rainfall event resulting in a 1:T-year flood event (SANRAL, 2013). Hence, depending on the TC, and if only observed daily rainfall depths are considered or available, then design rainfall depths for a duration equal to TC could be estimated using the approaches developed by Adamson (1981) and Smithers and Schulze (2003), respectively.
Design rainfall for durations less than 24 hours is generally classified as short-duration design rainfall and is computed directly from continuously recorded rainfall, while long-duration design rainfall typically ranges between 1 and 7 days and can be computed from both continuously recorded and daily rainfall data. Estimates of short- and long-duration design rainfall can either be based on a single-site or regional approach (Smithers and Schulze, 2004). Several regional and national-scale studies in South Africa based on short durations and point rainfall data were conducted between 1945 and 2001, with the most significant contributions made by, e.g., Reich (1961; 1963), Adamson (1977; 1981), Alexander (1978), Midgley and Pitman (1978), Smithers (1996), Smithers and Schulze (2000a), and Alexander (2001). The studies focusing on long durations and daily point rainfall data include studies conducted by the South African Weather Bureau (SAWB; 1956), Schulze (1980), Adamson (1981), Pegram and Adamson (1988), and Smithers and Schulze (2000b).
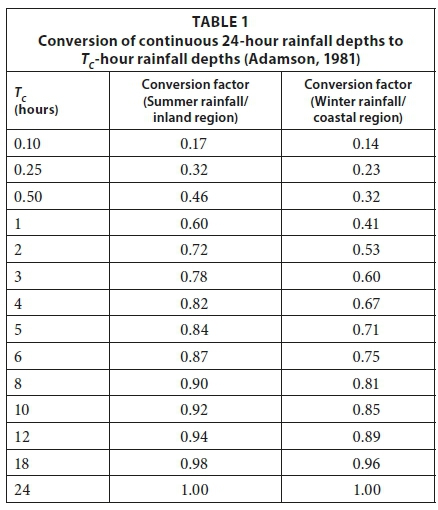
The use of conversion factors (Adamson, 1981) is generally accepted in South Africa to convert 1-day fixed time interval rainfall (08:00 to 08:00) to continuous measures of n-hour rainfall associated with TC. Adamson (1981) proposed the use of a conversion factor of 1.11 to convert daily rainfall depths recorded at fixed 1-day intervals to continuous 24-hour rainfall depths. At an international level, similar conversion factors have been proposed to convert daily fixed time interval rainfall depths to continuous 24-hour maxima, e.g., 1.13 in the United States of America (USA; Hershfield, 1962), 1.06 in the United Kingdom (UK; NERC, 1975), and 1.13 in South Africa (Alexander, 1978). In order to convert continuous 24-hour rainfall series to critical storm or TC durations ranging between 0.10 hours and 24 hours, Adamson (1981) proposed the use of the conversion factors as listed in Table 1. The conversion factors listed in Table 1 are considered to be independent of return period, but are influenced by regional climatological differences as evident in the summer rainfall/inland and winter rainfall/coastal regions of South Africa (Midgley and Pitman, 1978).
Converting daily rainfall depths to durations longer than 1-day simply entails the conversion of fixed time interval rainfall to continuous measures of rainfall (e.g., 2 days to 48 hours, 3 days to 72 hours, etc.), and interpolating between the different TC durations as listed in Table 2. The conversion factors listed in Table 2 are normally used in practice (Van der Spuy and Rademeyer, 2016); however, no literature is available as to how these conversion factors were derived.

In considering the limitations of a single-site approach and the paucity of sub-daily rainfall data in South Africa, i.e., 412 sub-daily rainfall stations and only 49 of these rainfall stations having record lengths exceeding 30 years, Smithers and Schulze (2000a; 2000b; 2003; 2004) developed a regional-scale invariance approach to estimate the mean point rainfall annual maximum series (AMS) for any duration, and associated 'scaling factors' as an alternative for the 'conversion factors' proposed by Adamson (1981). These 24-hour to 1-day continuous rainfall measurement 'scaling factors' range between 1.14 and 1.30 in South Africa (Smithers and Schulze, 2003).
Smithers and Schulze (2003; 2004) established 78 homogeneous long-duration rainfall clusters, 15 short-duration rainfall clusters, and estimated index values (mean n-hour AMS values) derived from at-site data. Cluster analysis of site characteristics was used to group the 78 long-duration rainfall clusters into 7 regions with 6 associated region-specific regression parameters. Firstly, the mean of the 1-day fixed time interval point rainfall AMS was estimated using regional regression relationships. Thereafter, the mean of the 24-hour continuously recorded point rainfall AMS was estimated directly from the 1-day value for the specific site under consideration. Lastly, the mean of the point rainfall AMS values for durations shorter and longer than 1 day were scaled directly from the mean of the continuous 24-hour and 1-day values, respectively, using the established regression parameters. The up- and downscaling were found to scale linearly as a function of the mean 1-day and continuous 24-hour values, respectively. In the application of the regression relationships to estimate the mean of the AMS for durations shorter and longer than 1 day, inconsistencies in the growth curves derived from the 24-hour continuously recorded and daily rainfall data were evident due to the quality and non-concurrent periods of the digitised rainfall data, as well as the differences in the AMS extracted from: (i) continuously recorded data using a sliding window, and (ii) daily rainfall data using a fixed period window. As a result, a scale invariance approach was introduced to the Regional Linear Moment Algorithm and termed the RLMA&SI approach to address the inconsistencies evident in the above-mentioned growth curves (Smithers and Schulze, 2003). In South Africa, the RLMA&SI approach is the preferred method for design rainfall estimation and is automated and included in the software program, Design Rainfall Estimation in South Africa (Smithers and Schulze, 2003; 2004). The latter software facilitates the estimation of design rainfall depths at a spatial resolution of 1-arc minute, for any location in South Africa, for durations ranging from 5 min to 7 days and for return periods of 2 to 200 years.
The overall objective of this study, as pilot case study, is to compare the use of two South African methods to convert and/or scale fixed daily time interval observed rainfall to continuous measures of n-hour rainfall for selected TC durations at a quaternary catchment level in the C5 secondary drainage region in South Africa. The application of conversion factors (Adamson, 1981) and scaling factors (Smithers and Schulze, 2003) to either convert or scale 1-day fixed time interval rainfall to continuous measures of n-hour rainfall are evaluated to establish the correlation present between these two methods, as well as to highlight the current relevance of each method in the context of modern flood hydrology practice in South Africa.
A summary of the study area is contained in the following section, followed by a description of the methodologies adopted and the results obtained. This is followed by the discussion and conclusions.
Study area
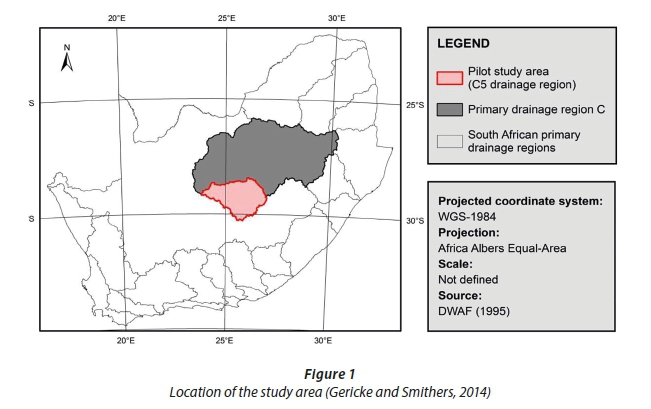
South Africa is divided into 22 primary drainage regions, which are further delineated into 148 secondary drainage regions (Midgley et al., 1994). The study area, as shown in Fig. 1, is situated in the C5 secondary drainage region within the primary drainage region C and covers 34 795 km2 (DWAF, 1995). The C5 secondary drainage region consists of two tertiary drainage regions, the Riet River (C51) and Modder River (C52) catchments, which are further sub-divided into 23 quaternary catchments. The Modder and Riet Rivers discharge into the Orange-Vaal River drainage system (Midgley et al., 1994).
The C5 secondary drainage region is predominantly characterised by convective rainfall associated with high rainfall intensities and thunder activity during the summer months. The mean annual precipitation (MAP) is 424 mm, ranging from 275 mm in the west to 685 mm in the east (Lynch, 2004). The rainy season starts in early September and ends in mid-April with a dry winter. The topography is gentle with elevations varying from 1 021 m to 2 120 m amsl and with average catchment slopes ranging between 1.7% and 10.3% (USGS, 2016).
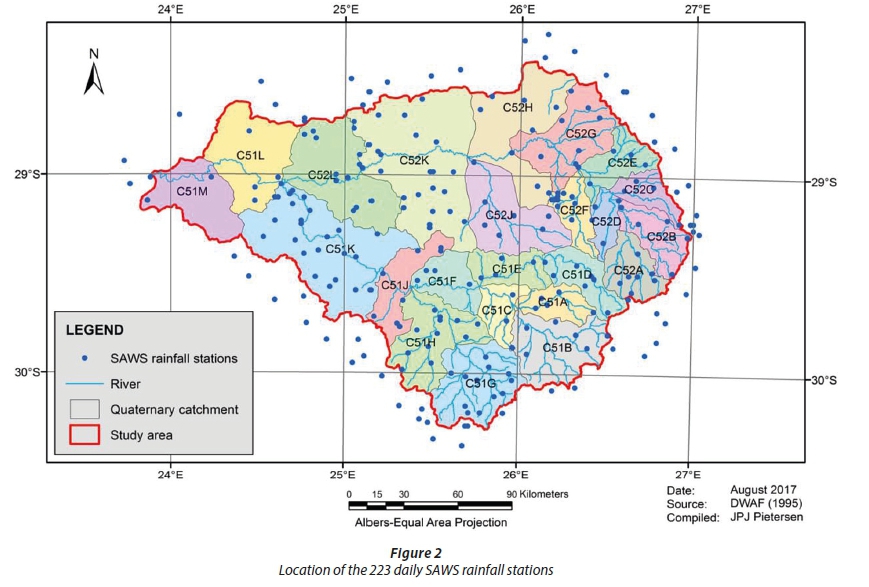
The 185 South African Weather Service (SAWS) daily rainfall stations located within the boundaries of the study area are shown in Fig. 2. It is evident from Fig. 2 that the daily rainfall monitoring network is generally denser in the mid-eastern parts of the study area as opposed to the north-western parts. The overall distribution and location of the individual daily rainfall stations are regarded as even and sufficient for the purpose of this study. There are 38 neighbouring daily rainfall stations surrounding the C5 secondary drainage region (Fig. 2), all of which were also considered in the analyses. Hence, a total of 223 daily rainfall stations were considered for data extraction and analyses.
METHODOLOGY AND RESULTS
This section provides the detailed methodology applied in the study area, as well as the results obtained. The following procedures were performed: (i) establishment of a daily point rainfall database, i.e., extraction and infilling of the 1-day fixed time interval point rainfall AMS at each rainfall station, (ii) application of the Adamson conversion factors to 1-day fixed time interval observed point rainfall to estimate continuous measures of TC-hour observed point rainfall, (iii) derivation and application of the Smithers-Schulze scaling factors using the 1-day AMS regression parameters and statistics to estimate continuous measures of TC-hour observed point rainfall, (iv) averaging the continuous measures of TC-hour observed point rainfall to observed catchment rainfall through the application of corresponding Thiessen weights, and (v) comparison of the converted and scaled catchment rainfall AMS for selected TC durations of 1, 8, 16, 24, 72 and 168 hours at a quaternary catchment level. No probabilistic analyses were conducted on the weighted AMS, since the objective of this study is not to estimate design rainfall values as such, but to convert and/or scale fixed time interval observed point rainfall to continuous measured observed point rainfall for the purpose of design rainfall estimation.
Daily point rainfall database
A daily point rainfall database was established by evaluating, preparing and extracting daily rainfall data from the SAWS rainfall stations present in the C5 secondary drainage region, as well as the data from rainfall stations in neighbouring catchments. The Daily Rainfall Extraction Utility (DREU; Lynch, 2004) was used for the extraction of infilled daily rainfall data. Each daily rainfall station identified with the DREU was evaluated in terms of record length (≥ 30 years), data quality and geographical location in relation to a specific quaternary catchment (QC) under consideration. In considering the impact that an incomplete month and consequently an incomplete year could have on the record length of a particular rainfall station, the default infilling techniques (e.g., inverse distance weighting, expectation maximisation, median ratio and/or monthly infilling) as proposed by Lynch (2004), were used for the infilling of missing daily rainfall data. The overall rainfall data infilling process was carefully interrogated and, in general, infilling was limited to periods within the observed record under consideration, i.e., no backward extrapolation of the observed record in time. However, in some cases where neighbouring rainfall stations had sufficient data, but relatively lower Thiessen weightings than the rainfall station in question, backward extrapolation prior to the period of record was used with caution. Typically, the infilling procedure ensured that the total record lengths exceed 60 years in each QC.
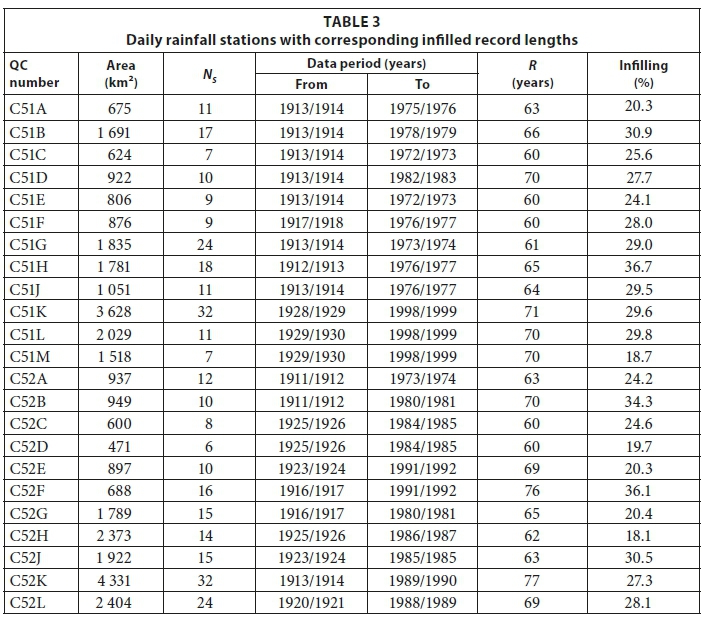
Thereafter, the 1-day fixed time interval point rainfall AMS were identified and extracted. The number (NS) of daily rainfall stations in each QC, data period, infilled record lengths (R), and corresponding percentage of infilling, are summarised in Table 3. It is evident from Table 3 that a large number of the SAWS daily rainfall stations within the C5 secondary drainage region have been operational since 1913.
Adamson conversion factors
The 1-day fixed time interval (08:00 to 08:00) point rainfall AMS at each rainfall station were converted to continuous 24-hour point rainfall AMS values using a conversion factor of 1.11 (Adamson, 1981). The continuous 24-hour point rainfall AMS were converted to TC-hour point rainfall values for durations ranging between 1 hour and ≤ 24 hours using Eq. 1 (Midgley and Pitman, 1978; Pitman, 1980; Adamson, 1981).
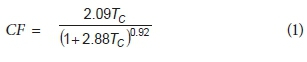
where:
CF = conversion factor applicable to the summer rainfall/inland region in South Africa (cf. Table 1)
TC = critical storm duration or time of concentration (hours)
In the case of TC durations > 1-day, the accumulated daily rainfall totals over a period of 2 to 7 days were estimated by applying a 'moving window' approach to the 1-day fixed time interval point rainfall. For example, the accumulated daily point rainfall over 3 days was estimated by applying a '3-day moving window' approach to the 1-day fixed time interval point rainfall. In other words, the 1-day point rainfall AMS for each rainfall station was determined by extracting the maximum 1-day rainfall values within each hydrological year for the complete infilled record length. Thereafter, a '3-day moving window' was applied to the 1-day fixed time interval point rainfall in each hydrological year to provide the accumulated 3-day totals. The highest accumulated value within each hydrological year was then used as the 3-day fixed time interval point rainfall AMS values. This process was repeated for each hydrological year to result in a complete 3-day fixed time interval point rainfall AMS at a particular rainfall station. The same procedure was performed to obtain the 7-day fixed time interval point rainfall AMS at each rainfall station. The conversion of fixed time interval point rainfall AMS to continuous n-hour point rainfall AMS (e.g., 3 days to 72 hours or 7 days to 168 hours) was based on the specific conversion factors as listed in Table 2 (cf. Introduction).
The Adamson conversion factors applied to the fixed time interval point rainfall AMS, as described above, resulted in estimates of continuous TC-hour point rainfall AMS for critical storm durations of 1, 8, 16, 24, 72 and 168 hours for each rainfall station. However, the conversion factors estimated with Eq. 1 and obtained from Table 2 (cf. Introduction), remained constant when applied to the continuous 24-hour and fixed time interval point rainfall AMS, respectively, e.g., 0.60 (TC = 1 hour), 0.90 (TC = 8 hours), 0.96 (TC = 16 hours), 1.11 (TC = 24 hours), 1.05 (TC = 72 hours) and 1.02 (TC =168 hours).
Smithers-Schulze scaling factors
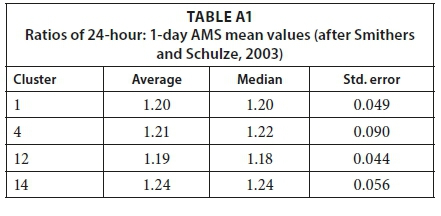
The 1-day fixed time interval (08:00 to 08:00) point rainfall AMS at each rainfall station were converted to continuous 24-hour point rainfall AMS values using the Smithers-Schulze scaling factors applicable to the short-duration rainfall cluster groups 1, 4, 12 and 14, and long-duration rainfall regions 1 and 6. As highlighted in the Introduction, Smithers and Schulze (2003) established: (i) 24-hour: 1-day AMS scaling factors for 15 homogeneous rainfall clusters (Table A1, Appendix), (ii) regression parameters and statistics to convert the mean of the continuous 24-hour values to short-duration mean TC-hour (TC < 24 hour) values in 15 rainfall clusters (Table A2, Appendix), and (iii) regression parameters and statistics to convert the mean of the 1-day values to long-duration mean TC-hour (TC > 24 hour) values in 7 homogeneous rainfall regions (Table A3, Appendix). The procedures followed to derive the appropriate scaling factors for each rainfall station could be summarised as follows (after Smithers and Schulze, 2003):
•Extraction of the mean 1-day AMS values used in the RLMA&SI method
•Estimation of the 24-hour AMS mean values
using the appropriate cluster and associated 24-hour: 1-day ratios as listed in Table A1, Appendix
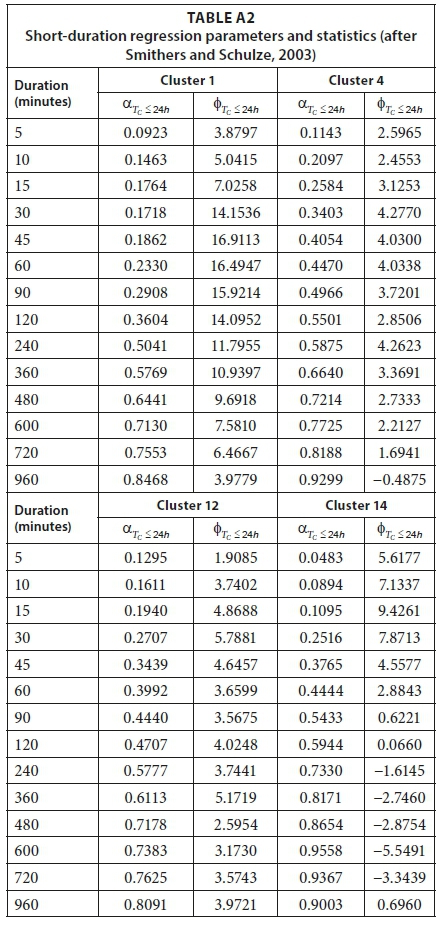
•Estimation of the short-duration AMS mean values
for selected TC durations of 1 hour, 8 hours and 16 hours at each rainfall station using the regression parameters and statistics as listed in Table A2, Appendix and expressed using Eq. 2

where:
= AMS mean value for TC ≤ 24 hours (mm)
= AMS mean value for 24 hours (mm)
αTC≤24h = regression coefficient for TC ≤ 24 hours
φTC≤24h = regression constant for TC ≤ 24 hours
•Estimation of the long-duration AMS mean values
for selected TC durations of ٧٢ hours and 168 hours using the regression parameters and statistics as listed in Table A3, Appendix, in conjunction with Eqs 3, 4 and 5.

where:
= AMS mean value for TC > 24 hours (mm)
αTC >24h = regression coefficient for TC > 24 hours
φTC>24h= regression constant for TC > 24 hours
= mean 1-day AMS value (mm)
τ = regression coefficient
k = regression coefficient
ϑ = regression constant
v = regression constant
σ = transformation exponent for TC > 24 hours
ρ = transformation exponent for TC > 24 hours
•Establishment of final scaling factors, expressed as the ratio between: (i) the derived short-duration mean TC AMS values (TC = 1, 8 and 16 hours) and the mean 24-hour AMS value, and (ii) the derived long-duration mean TC AMS values (TC = 24, 72 and 168 hours) and the mean 1-day AMS value for each rainfall station. Therefore, by considering the various TC durations mentioned above, average scaling factors associated with each TC duration and QC were estimated. Hence, each QC has a defined set of average scaling factors that could be applied to the mean point rainfall AMS values associated with different TC durations.
Table 4 provides a summary of the derived average scaling factors applicable to the 23 QCs within the study area. The scaling factors are based on Eqs 2 to 5 and the information contained in Tables A1 to A3, Appendix.
It is evident from Table 4 that the average Smithers-Schulze scaling factors tend to increase with each TC duration under consideration, with scaling factors between 0.54 (TC = 1 hour) and 1.75 (TC =168 hour). In 80% of the QCs under consideration, the Smithers-Schulze scaling factors were found to be similar in the different QCs for each TC-duration under consideration, especially the constant scaling factor of 1.18 at 24 hours. The similarity between the scaling factors is ascribed to the fact that these QCs are located within a single short-duration rainfall cluster and long-duration rainfall region, i.e., Cluster 12 and Region 6, respectively. However, some QCs and rainfall stations are located within multiple short-duration rainfall clusters and long-duration rainfall regions, e.g., C51K (Clusters 12 and 14; Region 6), C51L (Cluster 14; Region 6), C51M (Clusters 4 and 14; Region 6), and C52K and C52L (Clusters 12 and 14; Regions 1 and 6). Consequently, the average scaling factors for each TC-duration in these QCs tend to be generally higher for TC ≤ 24 hours, while for TC> 24 hours, the scaling factors were generally lower. Furthermore, the 24-hour scaling factors varied between 1.21 and 1.24 in the latter QCs, which is in close agreement with the national average of 1.21.
In contrast, and as highlighted above, the Adamson conversion factors (cf. Tables 1 and 2) are constant for specific TC durations, irrespective of the geographical location of a rainfall station or QC under consideration. Typically, the Adamson conversion factors range between 0.60 (TC = 1 hour) and 1.02 (TC = 24 hours), with the conversion factors increasing up to 24 hours. For longer durations, the conversion factors tend to decrease with an increase in TC duration (cf. Table 4).
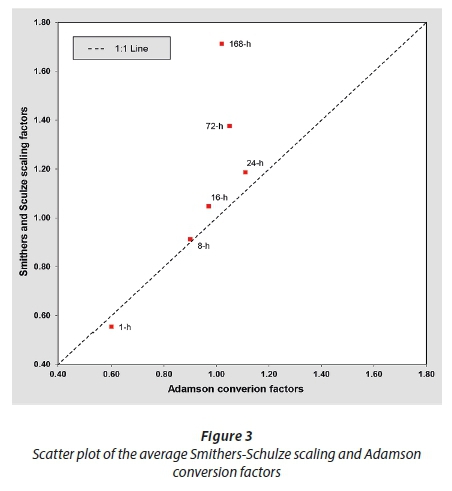
The latter contrasting trend, and differences evident between the scaling and conversion factors in the TC > 24 hours range, are ascribed to the fact that the Adamson conversion factors (decreasing trend with duration) are applied to fixed interval n-day values (e.g., 3 days x 1.05 = 72 hours), whereas the average Smithers-Schulze scaling factors (increasing trend with duration) are applied to mean 1-day AMS values irrespective of the duration in question. In other words, the Adamson methodology converts fixed time interval values to continuous values, whereas the Smithers-Schulze methodology scales the mean 1-day values into longer daily interval values. Hence, such differences, as illustrated in Fig. ٣, are to be expected, since the accumulated daily rainfall totals for 2 to 7 days are most likely to be larger than the 1-day values. The contrasting trends for TC > 24 hours as shown in Table 4 and discussed above are also clearly evident from Fig. 3.
Catchment rainfall
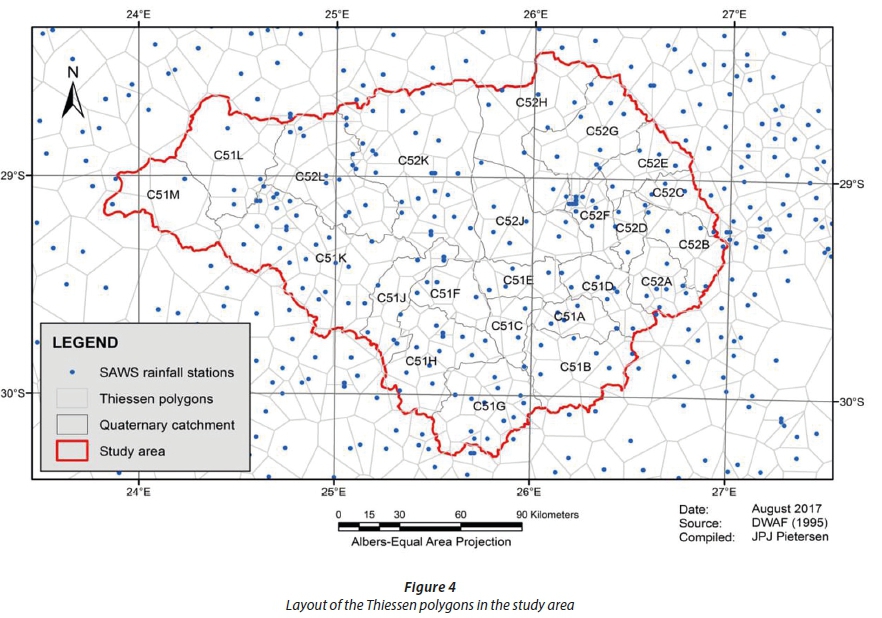
The geographical information system (GIS) feature classes (shape files) containing the spatial features of the complete daily point rainfall database were generated in the ArcGIS ١٠.١ environment. The Thiessen polygon method (Wilson, 1990) was used to convert the estimated continuous measures of TC-hour observed point rainfall at each rainfall station in a particular QC to observed catchment rainfall using the 'Create Thiessen Polygons' extension in ArcMap, i.e., the continuous estimates of TC-hour point rainfall were multiplied with corresponding Thiessen weights to results in a single set of TC-hour catchment rainfall in each QC. The boundary of the resultant Thiessen polygons was selected in each case, either by the applicable QCs (polygon feature classes) or by a buffered group of neighbouring rainfall stations (point feature classes). The latter option provides an alternative that allows the inclusion of rainfall stations located outside the boundary of a QC. The Thiessen polygons applicable to the study area are shown in Fig. 4.
Comparison of converted and scaled catchment rainfall
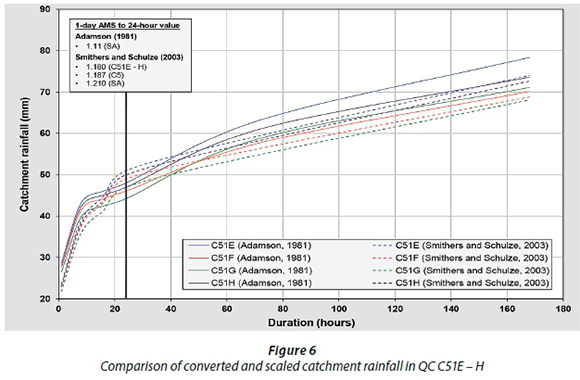
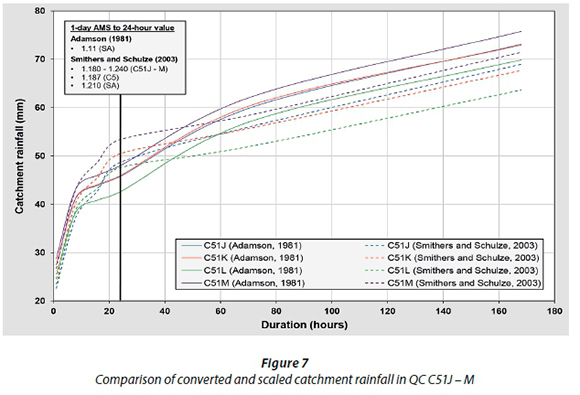
The converted and scaled TC-hour catchment rainfall estimated using the Adamson (1981) and Van der Spuy and Rademeyer (2016) conversion factors and average Smithers-Schulze (2003) scaling factors, respectively, in each QC under consideration, are shown in Figs 5 to 10. The differences between the converted and scaled weighted observed catchment rainfall for TC durations ≤ ٢٤ hours at a QC level are quite evident from Figs 5 to 10. Overall, the converted catchment rainfall values tend to rapidly increase up to 8 hours, after which the curves tend to be flatter and increasing at a constant rate. In contrast, the scaled catchment rainfall values are characterised by an ever-increasing slope, with a notable flattening of the slope followed by an increased slope between 8 hours and 24 hours. For TC durations > ٢٤ hours, both the converted and scaled catchment rainfall values tend to increase at a constant rate, although the converted catchment rainfall values are generally higher. As highlighted before, this could be ascribed to the fact that the Adamson conversion factors are applied to fixed interval n-day values (e.g., 3-day and 7-day), whereas the average Smithers-Schulze scaling factors are applied to mean AMS values, i.e., the up- or downscaling of the mean of the 1-day AMS or 24-hour AMS values, respectively.


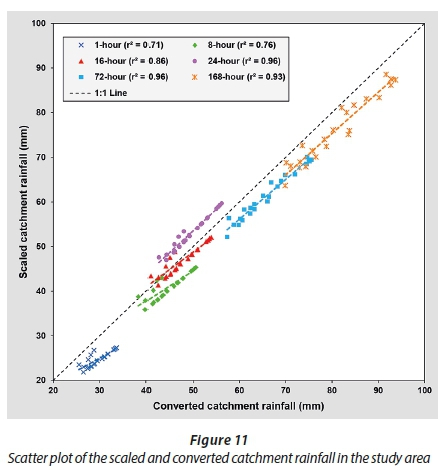
In order to further compare the converted and scaled catchment rainfall values, it is also important to establish the degree of association between these two methods, expressed as the coefficient of determination (r2). As illustrated in Fig. 11, typical r2 values ranged between 0.71 and 0.96, thus confirming the similar trends, especially for TC > 24 hours, as shown in Figs 5 to 10.
DISCUSSION AND CONCLUSIONS
The overall objective of this study was to compare the use of two South African methods to convert and/or scale fixed time interval daily rainfall data to continuous measures of observed rainfall for selected TC durations at a quaternary catchment level in the C5 secondary drainage region in South Africa. The two methods were applied to daily rainfall data which are more abundant, reliable and generally have longer record lengths than the digitised sub-daily rainfall data in South Africa. In other words, the purpose of this paper was not to reinvent the wheel by estimating design rainfall for other durations than those currently available in the RLMA&SI approach, but only to highlight the differences that could be introduced when either conversion (Adamson, 1981) or scaling (Smithers and Schulze, 2003) factors are used to disaggregate fixed time interval rainfall to continuous measured rainfall. In each quaternary catchment, the mean of 1-day AMS point rainfall were extracted, infilled, converted, scaled, and averaged to appropriate continuous measures of TC-hour catchment rainfall.
The rainfall data infilling process was carefully interrogated and, in general, infilling was limited to periods within the observed record under consideration, i.e., no backward extrapolation of the observed record in time. However, in some cases where neighbouring rainfall stations had sufficient data, but relatively lower Thiessen weightings than the rainfall station in question, backward extrapolation prior to the period of record was used with caution. Infilling was regarded as the last option since infilled rainfall values are based on the assumption of uniform temporal and spatial rainfall distribution between two distant rainfall stations.
The average Smithers-Schulze scaling factors at a QC level within a specific homogeneous rainfall cluster and/or region, varied and increased with each TC duration under consideration and proved to be dependent on the geographical location and number of rainfall stations. In contrast, the Adamson conversion factors are spatially constant for specific TC durations within the entire study area, while an increasing trend with duration up to 24 hours (cf. Table 1), followed by a decreasing trend with duration in the TC > 24 hours range (cf. Table 2), was evident. The latter contrasting trends and differences evident between the scaling and conversion factors in the TC > 24 hours range are ascribed to the fact that the Adamson conversion factors are applied to fixed interval n-day values (e.g., 2-day to 7-day values), whereas the average Smithers-Schulze scaling factors are used for the upscaling of mean 1-day AMS values irrespective of the duration in question.
Despite the different approaches used in each method, an acceptable (0.71 < r2 ≤ ٠.٨٦) and high (r2 ≥ ٠.٩٣) degree of association were achieved in using the two methods to estimate continuous short-duration n-hour (TC ≤ 24 hours) and long-duration n-hour (TC > 24 hours) catchment rainfall from 1-day fixed time interval point rainfall. However, the Adamson conversion factors are regarded as being outdated (e.g., 1981), limited to and based on a single-site approach, and regional variations are assumed to be homogeneous and limited to only two regions in South Africa, i.e., summer rainfall/inland and winter rainfall/coastal. In contrast, the Smithers-Schulze (2003) scaling factors are based on a regional approach and applicable to 15 short- and 7 long-duration rainfall clusters and regions, respectively. The Smithers-Schulze scaling methodology is also based on a more extensive (3 946 rainfall stations) and recent rainfall database (2000) which was subjected to more stringent data quality control measures as opposed to the 2 184 rainfall stations used by Adamson (1981). The Smithers-Schulze scaling factors are also included in the RLMA&SI approach, which forms the backbone of the 'Design Rainfall Estimation in South Africa' software, and which is widely used in practice and recommended as the standard design rainfall estimation procedure in the Drainage Manual (SANRAL, 2013).
In conclusion, the results from this study indicate that fixed time interval rainfall should be scaled to continuous measures of rainfall using the procedures and scaling factors as proposed by Smithers and Schulze (2003) in the study area. This will not only enhance estimates of design rainfall associated with the critical storm duration (TC), but would also result in objective and consistent results when the RLMA&SI software is used to automate the scaling process and design rainfall estimation at a spatial resolution of 1-arc minute for any location, duration, and return periods of 2 to 200 years in the study area.
ACKNOWLEDGEMENTS
Support for this research by the National Research Foundation (NRF) and Central University of Technology, Free State (CUT) is gratefully acknowledged. We also wish to thank the anonymous reviewers for their constructive review comments, which have helped to significantly improve the paper.
REFERENCES
ADAMSON PT (1977) Extreme values and return periods for rainfall in South Africa. Technical Note TR78. Department of Water Affairs, Pretoria, RSA. 5 pp. [ Links ]
ADAMSON PT (1981) Southern African storm rainfall. Technical Report TR102. Department of Environment Affairs and Tourism, Pretoria, RSA. 266 pp. [ Links ]
ALEXANDER WJR (1978) Depth-area-duration-frequency properties of storm rainfall in South Africa. Technical Report TR83. Department of Water Affairs, Pretoria, RSA. [ Links ]
ALEXANDER WJR (2001) Flood risk reduction measures. University of Pretoria, Pretoria, RSA. 560 pp. [ Links ]
DWAF (1995) GIS Data: Drainage Regions of South Africa. Department of Water Affairs and Forestry, Pretoria, RSA. [ Links ]
GERICKE OJ and DU PLESSIS JA (2011) Evaluation of critical storm duration rainfall estimates used in flood hydrology in South Africa. Water SA 37 (4) 453-470. https://doi.org/10.4314/wsa.v37i4.4 [ Links ]
GERICKE OJ and SMITHERS JC (2014) Review of methods used to estimate catchment response time for the purpose of peak discharge estimation. Hydrol. Sci. J. 59 (11) 1935–1971. DOI: https://doi.org/10.1080/02626667.2013.866712 [ Links ]
HERSHFIELD DM (1962) Extreme rainfall relationships. Proceedings, American Society of Civil Engineers HY6 (11) 73-92. [ Links ]
LYNCH SD (2004) Development of a raster database of annual, monthly and daily rainfall for Southern Africa. WRC Report No. 1156/1/04. Water Research Commission, Pretoria. 78 pp. [ Links ]
MIDGLEY DC and PITMAN WV (1978) A depth-duration-frequency diagram for point rainfall in Southern Africa. HRU Report 2/78. Hydrological Research Unit, University of Witwatersrand, Johannesburg, RSA. 57 pp. [ Links ]
MIDGLEY DC, PITMAN WV and MIDDLETON BJ (1994) Surface water resources of South Africa. Volume 2, Drainage Region C, Vaal: Appendices. WRC Report 298/2.1/94. Water Research Commission, Pretoria. [ Links ]
NERC (1975) Flood studies report. Natural Environment Research Council, London, UK. [ Links ]
PEGRAM GGS and ADAMSON PT (1988) Revised risk analysis for extreme storms and floods in Natal/KwaZulu. The Civil Engineer in South Africa (July 1988) 331-336. [ Links ]
PITMAN WV (1980) A depth-duration-frequency diagram for point rainfall in South West Africa/Namibia. Water SA 6 (4) 157-162. [ Links ]
REICH BM (1961) Short duration rainfall intensity in South Africa. S.Afr. J. Agric. Sci. 4 (4) 589-614. [ Links ]
REICH BM (1963) Short-duration rainfall-intensity estimates and other design aids for regions of sparse data. J. Hydrol. 1 3-28. https://doi.org/10.1016/0022-1694(63)90029-5 [ Links ]
SAWB (1956) Climate of South Africa, Part 3: Maximum 24-hour Rainfall. South African Weather Bureau Publication WB 21. South African Weather Bureau, Pretoria, RSA. [ Links ]
SANRAL (2013) Drainage Manual (6th edn). South African National Roads Agency Limited, Pretoria, RSA. 468 pp. [ Links ]
SCHULZE RE (1980) Potential flood producing rainfall for medium and long duration in Southern Africa. Water Research Commission, Pretoria. 37 pp. [ Links ]
SMITHERS JC (1996) Short-duration rainfall frequency model selection in Southern Africa. Water SA 22 (3) 211-217. [ Links ]
SMITHERS JC and SCHULZE RE (2000a) Development and evaluation of techniques for estimating short duration design rainfall in South Africa. WRC Report 681/1/00. Water Research Commission, Pretoria. 356 pp. [ Links ]
SMITHERS JC and SCHULZE RE (2000b) Long duration design rainfall estimates for South Africa. WRC Report No. 811/1/00. Water Research Commission, Pretoria. 69 pp. [ Links ]
SMITHERS JC and SCHULZE RE (2003) Design rainfall and flood estimation in South Africa. WRC Report No. 1060/01/03. Water Research Commission, Pretoria, RSA. 155 pp. [ Links ]
SMITHERS JC and SCHULZE RE (2004) The estimation of design rainfall for South Africa using a regional scale invariant approach. Water SA 30 (4) 435-444. [ Links ]
USGS (2016) EarthExplorer [online]. United States Geological Survey. URL: https://earthexplorer.usgs.gov/ (Accessed 19 September 2016). [ Links ]
VAN DER SPUY D and RADEMEYER PF (2016) Flood frequency estimation methods as applied in the Department of Water and Sanitation. Department of Water and Sanitation, Pretoria. 86 pp. [ Links ]
WILSON EM (1990) Engineering Hydrology (4th edn). Macmillan Press Limited, London. 348 pp. https://doi.org/10.1007/978-1-349-20610-0 [ Links ]
Received 14 December 2016
Accepted in revised form 21 August 2018.
* To whom all correspondence should be addressed. e-mail: jpietersen@cut.ac.za
APPENDIX


