


Services on Demand
Article
 English (pdf)
 Article in xml format
 Article references
Indicators

Related links
-
 Cited by Google
 -
 Similars in Google
Share

 Permalink
Water SA
On-line version ISSN 1816-7950
Print version ISSN 0378-4738
Water SA vol.44 n.4 Pretoria Oct. 2018
http://dx.doi.org/10.4314/wsa.v44i4.03
ORIGINAL ARTICLES
Applying performance indices in plantwide modelling for a comparative study of wastewater treatment plant operational strategies
Justine De KeteleI; Dries DavisterI; David S IkumiII
IGhent University campus Kortrijk, Graaf Karel de Goedelaan 7, 8500 Kortrijk, Belgium
IIWater Research Group, Department of Civil Engineering, University of Cape Town, Rondebosch, 7700, Cape South Africa
ABSTRACT
Achievement of good effluent quality is always the main goal for wastewater treatment plant (WWTP) systems. However, these WWTPs have developed further objectives that include efficient design and strategic control options, with the prospect of their conversion into waste resource recovery facilities (WRRFs) that operate on reduced energy costs. With all these aspects becoming an intrinsic part of waste treatment, mathematical models that simulate WWTP unit processes are becoming of increasing relevance for the achievement of WRRF goals (including good effluent quality, low energy costs and nutrient recovery). It is expected that these mathematical models will benefit potential future applications of automation process control, which have also been developing rapidly with the availability of more reliable and affordable sensors. However, simulated automation control strategies require a thorough evaluation protocol to ensure their viability prior to being adopted as efficient operation control measures. This study considers the comparison of different control strategies implemented on a standard WWTP layout, for plant optimization. The initial task was to define performance indices, effluent quality index (EQI) and operation cost index (OCI), based on a previous investigation by the International Water Association (IWA) benchmark simulation modelling (BSM) task group. These performance indices were then used to evaluate the following strategies: (i) adding a fermentation tank, (ii) dosing flocculant and (iii) implementing a balancing tank. A control strategy was only assumed to be effective with improvement or maintenance of effluent quality. Overall, the evaluation exercise proved to be useful for providing expert advice on efficiency of proposed waste treatment system layouts, towards determination of the best configuration of future WRRFs. For instance, it was notable that significant organic strength is needed for removal of nutrients recycled back from the anaerobic digestion (AD) system into the activated sludge (AS) - hence alternate methods to put the nutrient-rich outflow from the AD system to good use are required.
Keywords: WWTP control strategy, activated sludge, performance index, plant wide modelling
INTRODUCTION
Increasing food prices, depletion of water reserves and critical states of wastewater treatment plants (WWTPs) are a major concern in Southern Africa. Investigation of operational strategies for these WWTP systems provides opportunity to explore potential for financial savings through reduction of their operational costs while maintaining a positive impact on environmental health (i.e., ensuring good effluent quality).
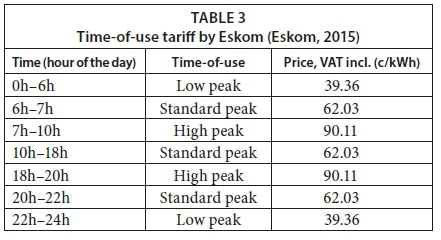
Energy is typically required in all stages of wastewater treatment, and thus represents the bulk of operating costs to the WWTPs. Due to the higher costs of producing electricity during high-demand energy-constrained periods (peak times), Eskom - South Africa's national parastatal supplier of electric power - has considered the prospect of including a time-of-use tariff for industries such as WWTP, to support stability of the national grid (Eskom, 2015). This allows for customer decision making during power system constraints to be encouraged and incentivised with appropriate price signals. Promoting benefit to WWTPs with improved electricity bills and payback time requires knowledge of improved/alternate control strategies in their operation. However, regardless of the WWTP operational strategy taken, effluent quality has to be maintained to preserve a balanced ecosystem in the receiving water bodies. In support of this, the South African Department of Water & Sanitation has enforced standard regulations that limit the discharge of various pollutants into receiving water bodies (DWA, 1984). It is notable that this legislation has a significant impact on the performance of WWTPs, since their operational strategy is focused towards meeting the targeted effluent quality and avoiding the costs (penalties) that come with exceeding the given discharge limits.
The exploration of lower operational costs and better effluent quality shall be performed via simulation of multiple control strategies on the layout from the International Water Association (IWA) benchmark simulation modelling (BSM) task group (Copp, 2002, Nopens et al., 2010). The research approach also involves the utilization of performance indexes (PIs) for subsequent generalization and comparative evaluation of the control strategies. The PIs used in this research are effluent quality index (EQI) and operation cost index (OCI), both of which were derived from a previous investigation by the IWA BSM task group (Jeppsson et al., 2007). The EQI offers a systematic approach to define the effluent quality (i.e., gives an easy measure as to why a certain plant requires optimization in order to reach ideal effluent quality), while OCI provides a basic overview of the most significant cost variables. The IWA BSM task group has continuously been using the evaluative performance indices in attempts to define the ideal waste resource recovery facilities of the future (Jeppsson et al., 2012; Vanrolleghem et al., 2014; Flores-Alsina et al., 2015; Solon et al., 2017).
This investigation intends to support the prioritization of wastewater treatment system performance criteria, via proposed modifications to the EQI and OCI. These modifications could be included in current models to assist in bridging the gap between bioprocess reactions within plant-wide models and plant performance as indicated by energy cost savings, nutrient recovery and effluent quality.
Using the modelling environment of WEST (Vanhooren et al., 2003), four different control strategies were tested on a BSM2-configured WWTP. The Plant Wide Model for South-Africa (PWM_SA) (Ikumi, 2011) was used as the bioprocess model for the whole project in WEST which allows for the connections between different sub-models (Meirlaen et al., 2002). Using this virtual plant, expert information is extracted to optimize both cost and effluent quality.
Effluent quality index (EQI)
To quantify the effluent pollution load to a receiving water body, the EQI requires determination of weighting factors for each pollutant based on its relative environmental impact (with the inclusion of evaluation time, effluent flow rate and pollutant concentration). The original EQI equation (1) developed by the BSM2 task group (Jeppsson et al., 2007) is as shown below:
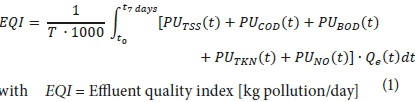
with EQI = Effluent quality index [kg pollution/day]
T = Time horizon (final 7 days) [days]
Qe = Effluent flowrate [m3/day]
The term PUx (t) includes a weighting factor of the pollutant multiplied by its concentration on a certain time-step in the effluent (e.g. PUTSS(t) = βTSS∙TSS(t)). These beta factors were fixed according to the Flanders fine equation (Copp, 2002; Vanrolleghem et al., 1996; Gernaey et al., 2014). This equation has been used in various recent studies for the assessment of plant performance (Benedetti et al., 2006; Gounder, 2006; Li et al., 2013). Because the scope of this research is to include site-specific regulations, a new EQI formula (Eq. 2) has been set up on the basis of the original one, for the implementation of EQI in each desired region.
The main modifications to include:
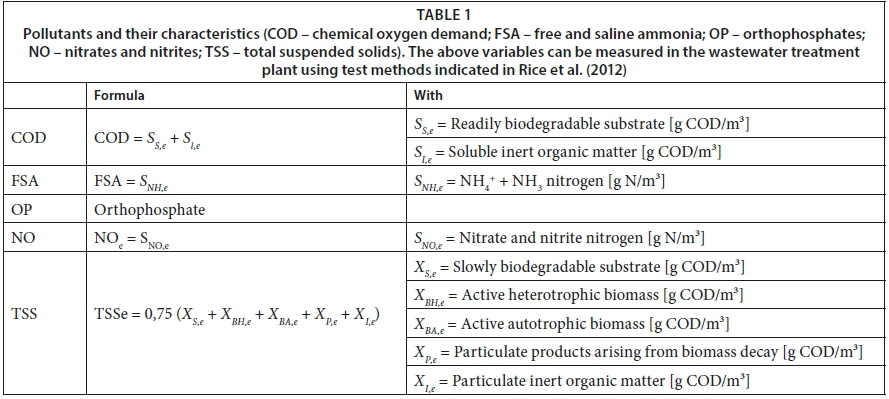
•The pollutants are chosen differently and made independent of each other as shown in Table 1.
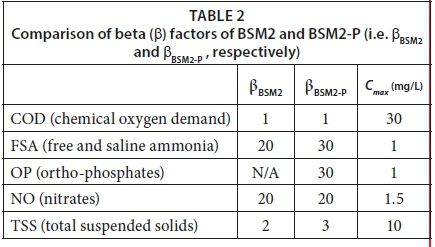
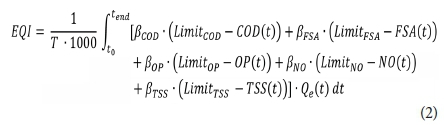
•The β is now based on the site-specific regulations. This is with the knowledge that regulations account for how the different pollutants would affect the aquatic ecosystems present in the receiving water body. The special standards from the South African regulations (DWA, 1984) were used to calculate beta factors as shown in Table 2.
•The PUx-formula was modified, such that the weighting factors β are multiplied with the difference between the limit concentration and the measured one instead of its sole multiplication with the measured pollutant concentration. Hence the formula is given as:
PUx(t) = βx∙(Xlimit - X(t)).
•There is only a small difference between βBSM2 and βBSM2-P. This means that it is acceptable to use regulation concentrations to derive beta.
•Beta are weighting factors to determine the weight of each pollutant in contrast to COD (reference point) on the water body, i.e., that βCOD will always be 1 and other betas (e.g. FSA) are then calculated as follows:
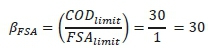
These modifications allow the EQI-formula (Eq.2) to provide a clear overview of when the limits are exceeded.
However, this resulted in the necessity to split the EQI-formula in two parts, viz., EQIpos (positive EQI) and EQIneg (negative EQI). When the effluent concentration of one of the pollutants exceeds the limit, its PUx-term becomes negative. However, these negative PUx-terms have to be separated from the positives ones so that they don't cancel each other out. So for each time step where PUx is less than zero, it is excluded from EQIpos and added in EQIneg. This way EQIpos and EQIneg are formed.
A further modification to the EQI formula is the extension of the time horizon, from the initial 7-day period to the complete seasonal event. This adjustment was motivated by the requirement for a more extensive impression of the effluent quality, throughout the various seasonal events.
Interpretation of EQIpos and EQIneg
When EQIneg is zero, none of the pollutants have exceeded the regulatory limit - meaning that the quality of the effluent is acceptable. The higher the value of EQIpos, the better the effluent quality. Considering no pollutants present in the effluent, the maximum value of EQIpos can be calculated from Eq. 2 using only the measured flowrate at each time step together with the concentration limits according to the provided regulations.
When EQIpos is zero, all of the pollutants have exceeded their regulatory limits and EQIneg will have a value below zero. When both EQIpos and EQIneg are not zero, it means that one or more pollutants (which can be identified through assessment of the data) have exceeded their regulatory limits. When attempting to improve the effluent quality, the main focus is on decreasing the magnitude of the EQIneg, towards zero.
This established EQI formula corresponds well with the basis on which pollution charges are made - i.e., according to the quantity of pollutant multiplied by its weighting factor and the percentage of time that the effluent limits have been violated; hence it can be a useful tool for auditing the progress of plants, incentivizing them towards their maintenance of effluent standards.
Operation cost index (OCI)
The standardization of WWTP design and operating cost analysis procedures is done, according to OCI, by including operating cost factors and indicating potential savings that could be implemented through introduction of strategic plant design or control operations. The integration of variable operating costs in the overall assessment of new approaches or control strategies is likely to result in considerable savings for WWTPs to acquire the best Rand value for plant optimization.
The original equation (Eq. 3) used for the calculation of OCI from BSM2 (Nopens et al., 2010) is:

With: AE = aeration energy [kWh/d]
PE = pumping energy [kWh/d]
SP = sludge production for disposal [average kg TSS/d]
EC = external carbon addition [average kg COD/d]
ME = mixing energy [kWh/d]
MP = methane production [average kg CH4/d]
HE = net heating energy needed to heat the sludge in the anaerobic digester (taking into account the heat produced by methane) [kWh/d]
Economic weights of 3 have been given to SP, EC relative to AE (with an economic weighting of 1). The MP is included in the cost index as a negative cost, with a weighting of -6, because the energy content of the methane (of which 50% can be converted to electricity) represents an economic benefit.
Because not all terms of this equation have the same units, it was deemed reasonable to include in the formula new factors that would enable this OCI to be given in ZAR/d (i.e. South African Rand/day). This has also been done by Volcke et al. (2006) using γ-factors, where she states that the 'economic weights are typically country dependent'.
The modified OCI formula is hence:
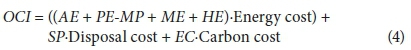
With: Energy cost in ZAR/kWh
Disposal cost in ZAR/kg TSS
Carbon cost in ZAR/kg COD
In comparison with Eq. 3, the methane production is expressed in kWh/d. Because of this, the heating energy will not include the produced mass of methane anymore and will just be appointed as total needed heating energy instead of net heating energy.
The prospective time-of-use tariff by Eskom is also implemented in the formula by adding a time-dependent price function P(t). The different values for this function are displayed in Table 3 (Eskom, 2015).
With this approach, new costs can be added, depending on the used control strategies. For example, when adding a flocculant, a new term 'flocculant flow [kg flocculant/d] ∙ flocculant cost [ZAR/kg flocculant]' can be added. Moreover, each cost term can be expressed by its own separate equation (Nopens et al., 2010).
To determine the cost that is tied to the aeration energy (Eq. 4), the mass transfer coefficient (kLa) of each aerated reactor with volume V has to be measured continuously. Using the equation, defined by Gernaey et al. (2014) and Nopens et al. (2010), the aeration energy cost is calculated as follows:
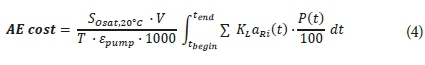
Where SOsat,20°C represents the saturated dissolved oxygen at 20°C, εtrans is the amount of O2 (kg) aerated per unit of energy (i.e. 0.8 kg O2/kWh) and T is the total evaluation time in days.
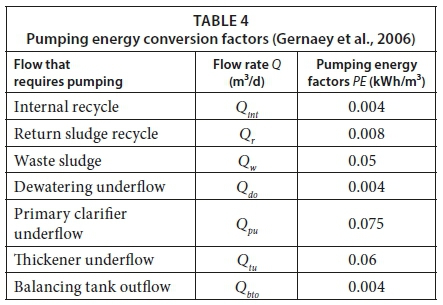
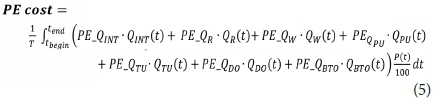
Pumping energy cost (Eq. 5) is calculated using differentiation between the various pumped flows. The same formula and PE factors (Table 4) were applied by Gernaey et al. (2006):
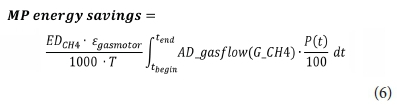
The base for setting up the equation for methane production energy savings (Eq. 6) is the flow (g/d) of methane that leaves the anaerobic digester. This gas flow will be converted to energy by means of a gas motor. Taking into account the energy density of methane (i.e. 15.42 kWh/kg) and the 40% efficiency of the motor (Clarke Energy, 2016, Vrecko et al., 2006), the formula is:
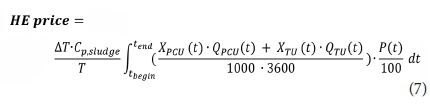
Also the cost for heating energy (Eq. 7) has to be calculated. This equation involves the energy needed to heat up the incoming sludge (20°C) to the AD to its required temperature of 35°C. So the temperature difference ∆T equals 15°C. The sludge that enters the AD originates from the underflow of both the primary clarifier (PCU) and the thickener (TU). The X (in g/m3) stands for the suspended solids concentration, while Q (in m3/d) is the flow rate of the underflow. The specific heat of sludge is equalized to that of water (i.e. 4.187 kJ/kg K) (Gernaey et al., 2014).
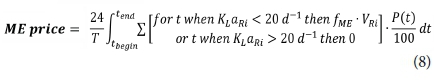
The determination of mixing energy cost (Eq. 8) is done according to Jeppsson (2005). In this case a reactor (ASU or AD) only requires mixing energy if the kLa of this reactor is smaller than 20 d−1. In the other case, the aeration provides enough mixing. The mixing energy is dependent on the volume of the reactor; for each m3 the mixing power consumption is 0.005 kW (fME) (Gernaey et al., 2014).
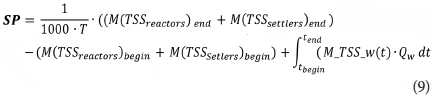
The equation for sludge disposal (Eq. 9) has not been changed from the original formula in BSM1 (Copp, 2002, Gernaey et al., 2014). The M_TSS stands for the sludge mass (in kg) in the reactor or settler, whereas M_TSS_w(t) describes the wasted sludge mass (in g TSS/m3) at time t. The Qw is the flowrate of waste sludge in m3/d (Copp, 2002).
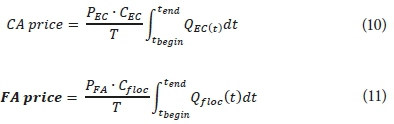
Cost for addition of a carbon source (in this case volatile fatty acids, VFAs) and flocculant (here aluminium sulphate, AlSO4) are covered in Eqs 10 and 11, respectively. They both include a concentration (g/m3), a flow rate (m3/d) and a time-independent price (ZAR/kg). The price for VFAs is set at 1.5 ZAR/kg, while AlSO4 costs 19 ZAR/kg (Lionheart, 2016).
To ensure that optimal design and operation of the WWTP unit process does not result in the compromise of effluent quality to achieve lower operating costs, the associated violation charges of the proposed EQI can also be included in the OCI (i.e., OCI increases to improve EQI).
EXPERIMENTAL SET-UP of BSM2-P
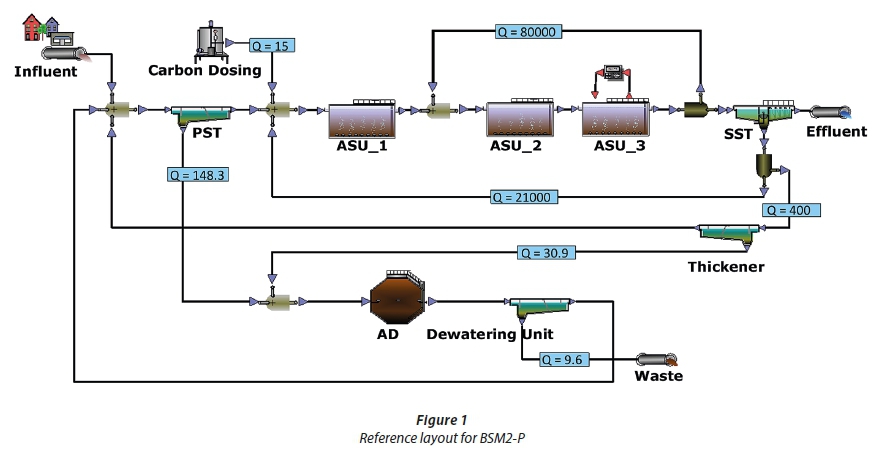
The PWM_SA model (model description and calibration is described in detail by Ikumi (2011)) within a modelling platform of WEST (Vanhooren et al., 2003) was used to virtually set up the plant layout (shown in Fig. 1 below).
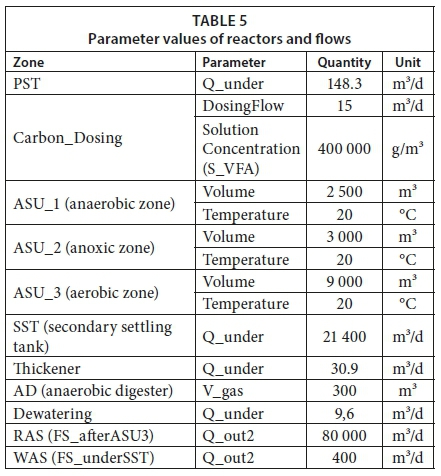
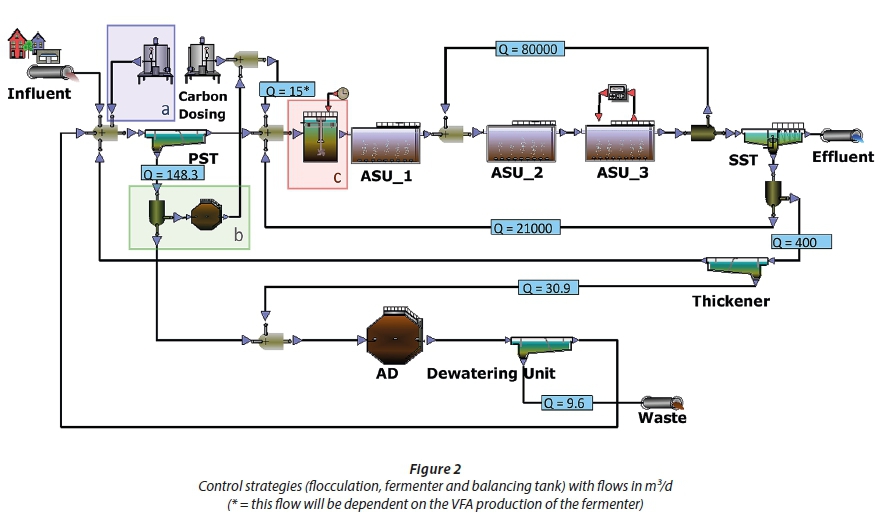
The given plant set-up is based on the one provided by BSM2-P, which is considered as the reference configuration (Flores-Alsina, 2016) on which different control strategies will be built (see Figure 1). As included in BSM2, the volatile fatty acids (VFAs) are added prior to entering the activated sludge units (ASUs). This was to supplement the system strength required for removal of the high free and saline ammonia (FSA) load from the anaerobic digester (AD)-recycle. This VFA dosing was set to 15m3/d with a concentration of 400 kg/m3, compared to the 2m3/d used in BSM2 (Gernaey et al., 2014). The parameter values of every treatment unit, differing from the initial values of PWM_SA, are displayed in Table 5. Some are also illustrated on Figure 1.
Moreover, to avoid the virtual system being phosphorus (P) limited, 20 mg/L phosphate was added to the original BSM influent, as part of its modification to BSM2-P. The file contains 609 days of influent data at 15-min intervals.
The initial step in the simulation procedure is to simulate the system until steady state is achieved, by using an influent with constant flow and composition over a period of 200 days (greater than 3 times the system sludge age of 10 days). The dynamic simulation follows this steady-state simulation and uses the entire influent dataset, with varying material loads over a period of 365 days (Guo, 2014).
MODEL DESCRIPTION AND EVALUATION
The University of Cape Town/University of KwaZulu-Natal three-phase Plant-Wide Model (PWM_SA, Ikumi, 2011) was used to simulate the virtual plant layout. This PWM_SA model uses strict material mass balances to track and predict the output of different materials (COD, C, H, O, N, P and S) in simulation of physical, chemical and biological processes for the whole WWTP, including biological N and P removal activated sludge, AD of primary sludge and AD or anoxic-aerobic digestion (AAD) of WAS. It contains three sub-models that work together during simulations in various configurations:
•The ionic speciation model of Brouckaert et al. (2010) that comprises of an external algebraic equation equilibrium speciation sub-routine used for the pairing of ionic components, hence the inclusion of non-ideal aqueous solution effects towards the calculation of the system pH, ionic strength and relevant gas partial pressures. This also allows for the model to predict inter-phase transfers of component species, including mineral precipitation and gaseous evolution, and their influence on the system pH.
•The PWM_SA_AS model, which is the result of the modification of Activated Sludge Model No. 2 (Henze et al., 1995) to include the ionic speciation (Brouckaert et al., 2010), the inorganic settleable solids (ISS, Ekama and Wentzel, 2004) and the multiple mineral precipitation (Musvoto et al., 2000).
•The PWM_SA_AD model, which is a modification of the University of Cape Town Sludge Digestion Model (UCTSDM; Sötemann et al., 2005). The additions are the hydrolysis of multiple organic sludge types (i.e. PS, ND WAS, NDBEPR WAS and PS-WAS blends), polyphosphate release processes, multiple mineral precipitation from Musvoto et al. (2000a, b) and the aqueous speciation model of Brouckaert et al. (2010) which facilitates ionic speciation (Ikumi, 2011).
The PWM_SA_AS and PWM_SA_AD models have the same set of model components, as in accordance with the 'super model approach' of Jones and Tákacs (2004) and Seco et al. (2004), including parameterized stoichiometry (the x, y, z, a, b, c values from CxHyOzNaPbSc of the influent organics groups and biomass species), for the bioprocesses, and are also sharing the same 'globally placed' ionic speciation subroutine model.
The PWM_SA (or UCT-PW) model was evaluated in multiple steps that were based on the BIOMATH protocol developed by Vanrolleghem et al. (2003). Firstly, the verification of material balances (COD, C, H, O N, P, Mg K and Ca) for all stoichiometric processes was achieved, using the systematic method proposed by Hauduc et al. (2010). The next step was to enter initial values for both kinetic and stoichiometric parameters that were obtained either experimentally or from literature. The parameters were also given a typical value range which is determined according to the methods proposed by Brun et al. (2002). They were then evaluated using two sensitivity analysis methods, i.e., (i) standardized regression coefficients (SRC), and (ii) Morris screening. The results of those methods lead to the identification of important parameters (those with greatest effects), non-influential parameters (don't influence the output with change in value) and also interacting parameters (Neumann, 2012).The final step involved the fixing of non-influential parameters at their default values (since they are known not to have significant effects) and conduction of simulations to determine the best values of the remaining subset of 'significant' parameters, through comparison of the simulation results with the observed outputs of experiments. A more detailed description can be found by Ikumi et al. (2015).
OPERATIONAL STRATEGIES
During the comparative study, different control strategies were tested on the BSM2-P reference model. Figure 2 shows the first three tested operations and how they are implemented in the reference lay-out. These strategies are: flocculation (a), addition of fermenter (b) and addition of balancing tank (c). Besides these three, other strategies include modification of the BSM2-P layout by removal of some recycle streams and relocation of the carbon dosing from the anaerobic to the anoxic reactor.
Flocculant addition
The first control strategy is the addition of a chemical flocculant (aluminium sulphate, AlSO4) such that the non-settleable fraction of particulates in the primary settling tank (PST) is reduced (converted to settleables). This is deemed an operational strategy due to (i) its potential to reduce the organic load to the AS system, hence promote reduced aeration cost (due to lower biodegradable particulate organics (BPO)) and lower design volume requirements (due to both lower biodegradable (BPO) and unbiodegradable particulate organics (UPO)) for the reactors (Henze, 2008); (ii) increased organic load in the form of primary sludge (settleable particulates from the PST underflow) to the AD which can result in higher energy savings through methane production (from higher AD influent BPO).
Using data from Enslin (2003), three separate formulas were set up to predict the non-settleable fraction of (i) unbiodegradable particulate organics (UPO), (ii) biodegradable particulate organics (BPO) and (iii) inorganic suspended solids (ISS). The addition of chemical flocculant will achieve a maximum chemically induced settleable fraction at a certain concentration. Adding more flocculant beyond this point would only lead to a higher cost without significant improvements. This trend is represented by Eq. 13 below, with kinetic constants (i.e., fm,x and Ks,x - see Eq. 13 below) to be calibrated against Enslin (2003) data using nonlinear regression technique. Formulas of the three particulate groups (UPO, BPO and ISS) only differ in their constants. Because the data only includes a difference between TSS and ISS, the formula for UPO and BPO (which are the two VSS components) is entirely the same. The overall formula is:
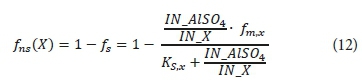
where fns (X) is the non-settleable fraction of BPO, UPO or ISS and fs is the settleable fraction. IN_AlSO4 and IN_X stand for the inflow rate of respectively AlSO4 and the three groups (BPO, UPO or ISS) into the PST. A varying influent flux requires the fraction of both (AlSO4 and X) inflows to be included because settleability is dependent on the relative AlSO4 load. The fm,x represents maximum settled fraction of BPO, UPO or ISS. This equalled 0.9909 for both BPO and UPO and 0.9646 for ISS. The half saturation coefficient for flocculation rate (KS,x) equaled 0.0066 for BPO and UPO and 0.0898 for ISS. This is equal to the ratio of AlSO4 and X where the settled fraction is half of fm,x.
Including a fermenter
The PWM_SA model allowed for the exploration of fermenter inclusion as control strategy. In this case, an AD unit is simulated at a significantly low sludge age (such that acidogenic fermentation takes place and methanogenic processes are allowed to fail) converts biodegradable organics of PS to volatile fatty acids (VFAs). The VFAs produced by this 'fermenter' are used to supplement carbon dosing for denitrification (when added to anoxic zone) and/or enhancement of PAO growth (when fed into anaerobic reactor). This way the fermenter targets reduction in cost for carbon addition, hence promoting a lower OCI, with the maintenance of 6 000 kg/day external inflow of VFAs.
Separate to the 'fermenter', there is an AD system that is linked to (fed) the remaining underflow of the PST. Hence, the potentially lower organic load and higher sludge age of the AD system, due to the addition of a fermenter, is noted and shall add/deduct from the OCI.
The variables for this operational strategy will be inflow to the fermenter (60, 80, 100 and 120 m3/d) and reactor volume (60, 80, 100 and 120 m3). However, only the best inflow for each reactor volume is discussed. As a further step, the outcome of combining a fermenter and flocculant is evaluated. This is deemed to produce a higher PS load, hence increase the VFA production of the fermenter and lead to further reduction in cost of carbon dosing.
Balancing tank
The potential implementation of high, standard and low-peak prices for wastewater treatment plants, resulting in higher charges for peak-hours, incentivizes WWTP operational strategies that will work towards improving the WWTP electricity bill and payback time. In line with this, a balancing tank can be used to evaluate the impact of feeding higher loads during low peak hours and vice versa. This is expected to minimize aeration power, which is known to be the majority consumer of energy in the plant (Musvoto and Ikumi, 2016). Hence, the simulated control of organic and nutrient loading rates further assesses the extent to which the system, while targeting minimum aeration costs, can handle various feeding patterns, without compromising effluent quality.
Open loop
According to the given configuration (Fig. 2) the excess nutrients released during AD get recycled back to the AS system. This results in additional organic strength requirement, i.e., carbon dosage, for removal of these excess nutrients. An additional control strategy was to eliminate the nutrient recycles and observe the impact, in terms of OCI and EQI, of the recycled nutrient loads on the plant.
In the BSM2 layout there are two recycles back to the PST: one from the dewatering unit and one from the thickener. This control strategy simulates two experiments: (i) only the recycle from the dewatering unit is removed, and (ii) the removal of both recycles to the PST.
Carbon dosing to anoxic ASU
The final control strategy involved the displacement of the carbon dosing from the anaerobic ASU to the anoxic one. This was done because the original BSM2 layout, without P removal (a configuration without an anaerobic ASU) (Gernaey et al., 2014), included the direct carbon dosing to the anoxic reactor. Here the focus will be to shift the ASU from phosphorus removal to denitrification.
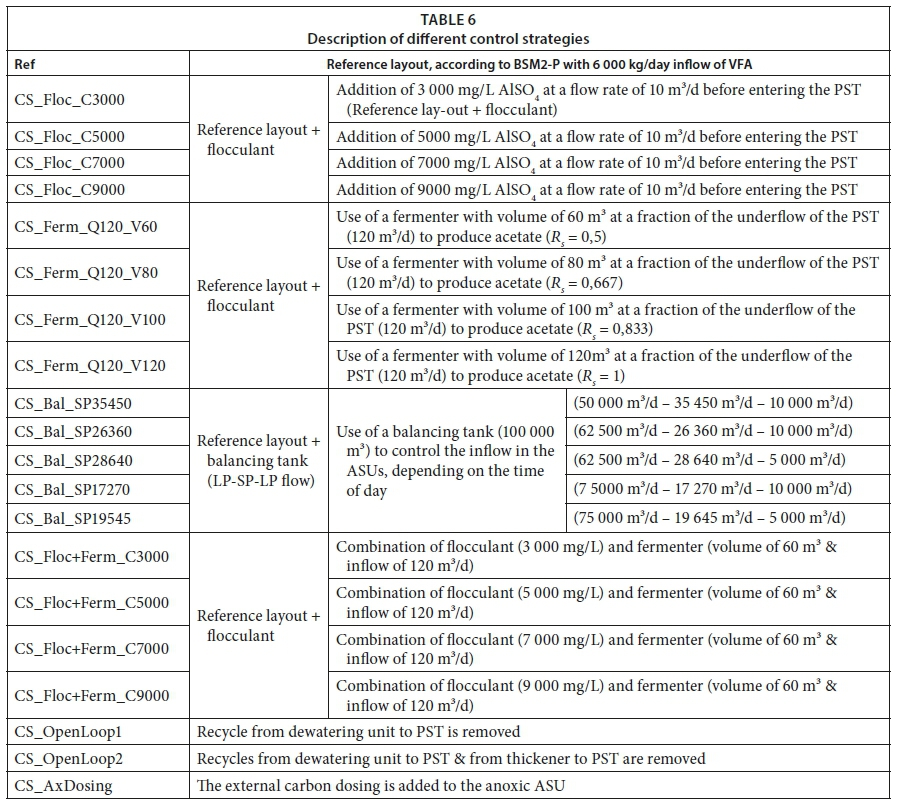
Table 6 shows a description of the different control strategies; these will be discussed further in the 'results' and 'discussion' sections.
RESULTS
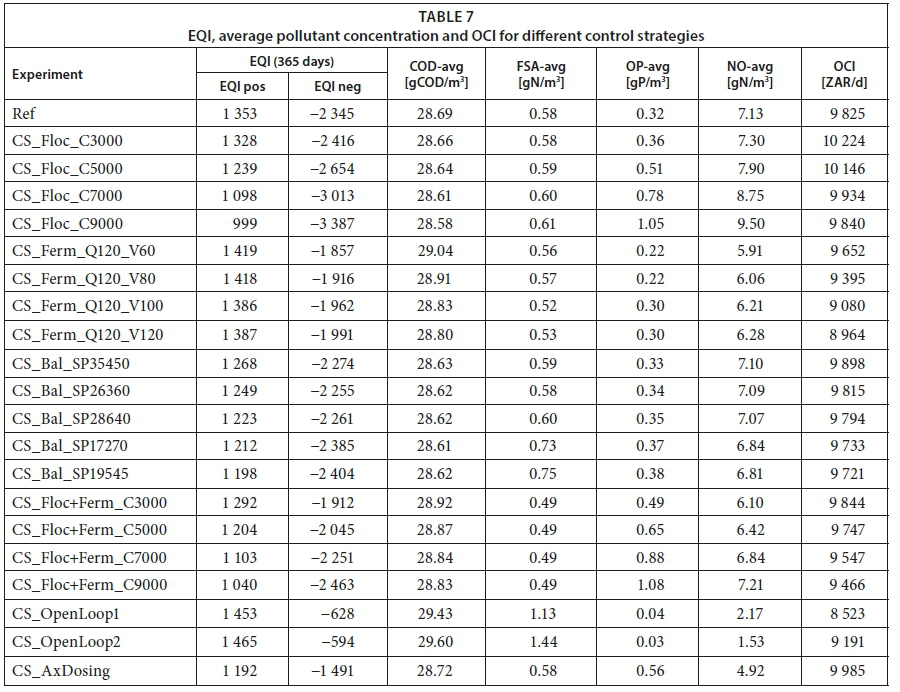
An overall view of the effluent quality can be found in Table 7. Here EQI positive and negative are presented, as well as the average concentration of FSAs, OP, NO and COD. Importantly, control strategies that compromise effluent quality were not recognized to be effective.
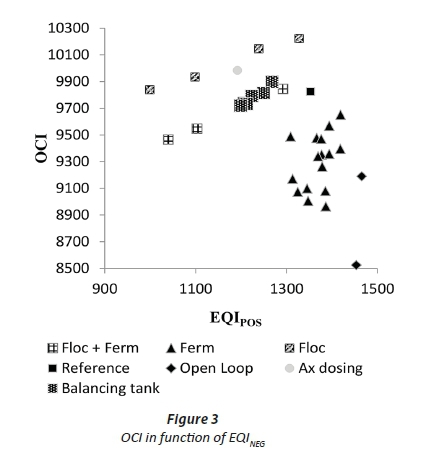
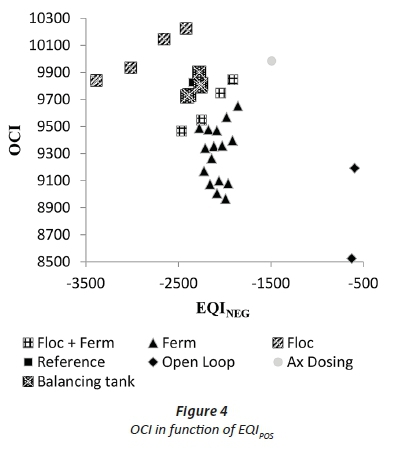
Figure 3 and Figure 4 show the OCI for every control strategy relative to respectively the EQIPOS and EQINEG.
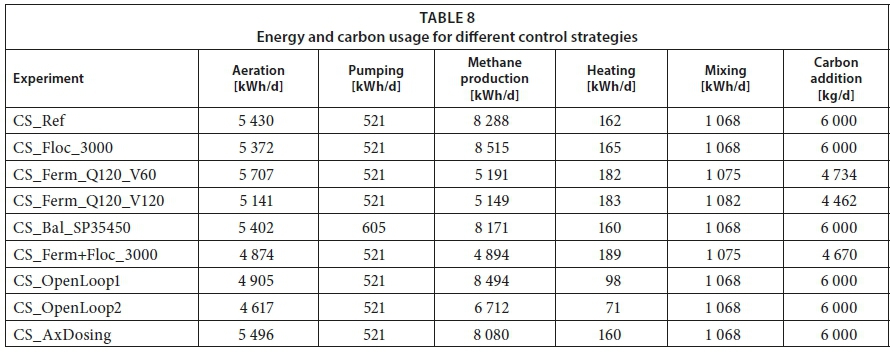
Energy
Energy consumption and carbon usage is tabulated for the virtual experiment in each control strategy that yielded the best effluent quality (Table 8). This provides an overview of the operational components that use the most energy.
DISCUSSION
All strategies were successful in accomplishing COD removal, as can be reflected by the consistent low effluent COD (i.e., only unbiodegradable soluble organics found in the effluent) (Henze, 2008).
As expected, addition of flocculant reduces the carbon load to the AS system (Amuda and Amoo, 2007, Wentzel et al., 2001). This is useful for energy efficiency in organic removal but could negatively affect the system if excess nutrients (some of which are recycled from the AD dewatered liquor) are present. The excess nutrients would then require sufficient quantity of organics in the AS system to act as electron donors in their removal process. This is evident in both EQI positive and negative considering the limitation of electron donors required for denitrification and P-removal (Henze, 2008). In terms of cost effectiveness, the cost of flocculant makes the OCI increase, even though there is an anticipated decline in aeration energy. It is only at a concentration of 9 000 g/m3, that costs are lower than those of the reference layout. This is because methane production in the AD increases with flocculant addition (due to increased BPO flow to AD), such that at a flocculant concentration of 9 000 g/m3, OCI increase due to methane production accommodates for the use of flocculant. Moreover, the use of aluminium sulphate also brings considerable design implications - requiring, due to the acidic nature, that pipes and storage tanks are corrosion-proof (Leopold and Freese, 2009).
An added fermenter takes up part of the PS flux, resulting in a reduced PS flow, from the PST underflow to AD. For the completely mixed AD with fixed volume, the lower inflow allows for longer sludge retention times. The release of nutrients from breakdown of complex organics occurs in both the fermenter and the AD system. However, the AD system with a longer sludge age converts the biodegradable organics to methane while the VFAs, produced by the fermenter, also get recycled (as the released nutrients are) to the AS system to supplement the organic strength required for nutrient removal. Overall, this results in a better effluent quality, in terms of the EQI negative (+4.8% for EQIPOS and +26.3% for EQINEG). Moreover, the lower inflow to the AD results in a reduced quantity of FSA being released from organic nitrogen (a reduction of 38% was observed) and lower methane production (37 % less compared to reference layout). However, due to the decreased requirement for externally dosed carbon (the fermenter accounted for about 20% of this carbon dosage, saving 2 000 ZAR/day), overall costs were reduced with at least 200 ZAR/day. Operational planning of such WWTPs may require evaluating the trade-off between using PS for methane generation or its fermentation capacity to provide readily biodegradable organics for nutrient removal in the AS system.
The simulated combination of flocculant addition with a fermenter resulted in no improvement of the effluent quality, as compared to using only a fermenter. However, the aeration was reduced further, without a resultant lower operation cost (the costs recovered by reduced aeration were spent on supply of the flocculant). The addition of a balancing tank allows for the system performance to be observed with variations in the simulated flow patterns (i.e., - the extent to which organisms get overwhelmed or starved with high and low organic loads respectively). With the main objective of reducing load to the ASU and thus reducing aeration costs, only 1.5 % of the aeration cost was reduced. In terms of energy, it was only 0.05% less aeration, compared to the reference layout. Poor reduction of aeration cost can be explained because high peak comprises only 5 h a day, compared to 19 h of low and standard peak. Low flux to the ASU is almost negligible due to the short time span of the high peak period.
Removal of the recycle from the dewatering unit to the PST (i.e., Open Loop 1) results in lower nitrogen load (within the systems' capacity for nitrification and denitrification) recycled to the AS system. This is reflected in the significant improvement in the EQI negative value.
Eliminating the recycle from both the dewatering unit and the thickener (i.e., Open loop 2) does not result in a significant further improvement of effluent quality. However, it has an important impact on the cost because less secondary sludge gets to the AD. This way, there is less nutrient release from sludge digestion (biomass, which forms waste activated sludge BPO, has higher N and P content compared to primary sludge, Ikumi et al., 2015) and lower methane (20%) production.
Carbon addition to the AS system has a great influence on improvement of effluent quality. It was noted that connection of the carbon dosing unit to the anoxic reactor, instead of the anaerobic reactor, improves the EQI negative by 36%. This is mainly due to the requirement for higher quantities of electron donor (i.e., the acetate) for removal of the large quantity of nitrates generated due to high recycling of nutrients to the system. The effluent OP concentration is already within its required boundaries, without the further increase in anaerobic acetate dosage; hence the overall effluent quality improvement is not as significant as when the supplementary acetate was used for denitrification (see Table 7).
To compare all control strategies for both cost effectiveness and effluent quality, Figure 3 and Figure 4 can be used. This observation shows that all control strategies have similar trends for both EQIPOS as for EQINEG. Also, from these figures, poor control strategies can be identified as the ones presented at the upper left corner of the graph, while the lower right corner of the graph represents a good strategy. It is hence clear that the open loop experiments give the best results. Other significant recommendations include addition of effective nutrient recovery units for AD-released N and P that form part of the dewatered AD liquor, and (ii) the addition of a fermenter to act as a carbon source and a balancing tank for improved control of influent flow.
CONCLUSION
The utilization of performance indices (i.e., EQI and OCI) to quantify effluent quality and operational cost, when simulating the virtual WWTP set up, proved to be an effective method to comparatively evaluate these control options. Hence, this methodology could contribute towards determining the feasibility of proposed control options amongst other aspects such as troubleshooting and/or analysing prospects of various plant scenarios. An important rule in this evaluation exercise is the required maintenance or improvement of effluent quality as the primary goal, with this being the highest priority and above consideration of cost optimization.
During the evaluation of various control strategies using the BSM2-P standard WWTP configuration, some pointers were noted for improvement in design and operation of the system. Increased acetate dosing was required to ensure nutrient (N & P) removal in the BSM2-P configuration layout. The addition of a fermenter was a useful strategy towards complementing the supply of these volatile fatty acids, hence contributing towards improvement of effluent quality. However, the requirement for increased organic strength for nutrient removal is significantly reduced with the modification of the BSM2-P configuration by removing the recycle of nutrient-rich dewatered AD liquor. This is noted by the significant improvement in effluent quality. Alternate routing of the nutrient-rich dewatered liquor includes processes such as crystallization units for formation of mineral precipitates, towards recovery of the nutrients for fertilizer production (Bhuiyan et al., 2008). Furthermore, it is expected the WWTP mathematical models (which are continuously being improved as more information is included) and the evaluative tools such as EQI and OCI have a significant role in defining the ideal configurations for WRRFs of the future.
ACKNOWLEDGMENTS
This research was supported by both the University of Cape Town and University of Ghent. They gave us the opportunity to collaborate on this project because of their shared interest in water treatment. Therefore special thanks to Prof. ir. Stijn Van Hulle (Ugent, Campus Kortrijk) and Prof. George Ekama (UCT) who provided us with the knowledge and insight that contributed to the research. We also thank the staff and students from University of Cape Town for their hospitality of letting us join this project and assisting us when needed.
REFERENCES
AMUDA OS AND AMOO IA (2007) Coagulation/flocculation process and sludge conditioning in beverage industrial wastewater treatment. J. Hazardous Mater. 141 778-783. https://doi.org/10.1016/j.jhazmat.2006.07.044 [ Links ]
BENEDETTI L, BIXIO D and VANROLLEGHEM PA (2006) Benchmarking of WWTP design by assessing costs, effluent quality and process variability. Water Sci. Technol. 54 (10) 95-102. https://doi.org/10.2166/wst.2006.809 [ Links ]
BHUIYAN MIH, MAVINIC DS and KOCH FA (2008) Thermal decomposition of struvite and its phase transition. Chemosphere 70 1347-1356. https://doi.org/10.1016/j.chemosphere.2007.09.056 [ Links ]
BISINELLA DE FARIA AB (2016) Development of an integrated approach for wastewater treatment plant optimization based on dynamic modelling and environmental assessment. PhD thesis, Université de Toulouse-INSA Toulouse. [ Links ]
BROUCKAERT CJ, IKUMI DS and EKAMA GA (2010) A 3-phase anaerobic digestion model. In: Proceedings. 12th IWA Anaerobic Digestion Conference (AD12), Guadalajara, Mexico, 1-4 November 2010. [ Links ]
BRUN R, KÜHNI M, SIEGRIST H, GUJER W and REICHERT P (2002) Practical identifiability of ASM2d parameters-systematic selection and tuning of parameter subsets. Water Res. 36 4113-4127. https://doi.org/10.1016/S0043-1354(02)00104-5 [ Links ]
CLARKE ENERGY (2016) Electricity from gas-powered generators [Online]. URL: https://www.clarke-energy.com/electricity-generation/ [Accessed]. [ Links ]
COPP JB (ed.) (2002) The COST Simulation Benchmark - Description and Simulator Manual. Office for Official Publications of the European Communities, Luxembourg. [ Links ]
DWA (Department of Water Affairs, South Africa) (1984) General and special standards for waste water discharge. DWA, Pretoria. [ Links ]
ENSLIN B (2003) The impact of chemically enhanced primary treatment on the capacity and performance of BNR activated sludge plants. BSc, University of Cape Town. [ Links ]
EKAMA GA and WENTZEL MC (2004) A predictive model for the reactor inorganic suspended solids concentration in activated sludge systems. Water Res. 38 4093-4106. https://doi.org/10.1016/j.watres.2004.08.005 [ Links ]
ESKOM (2015) Tariffs & Charges 2015/16. [ Links ]
FLORES - ALSINA X, IKUMI DS, MBAMBA CK, SOLON K, TAIT S, BROUCKAERT CJ, EKAMA GA, JEPPSSON U, GERNAEY K and BATSTONE D (2015) A Benchmark Simulation Model to Describe Plant-wide Phosphorus Transformations in WWTP. Proc. IWA Watermatex 2015, Gold Coast, Australia, 14-17 June 2015. [ Links ]
FLORES-ALSINA X, SOLON K, IKUMI D, KAZADI-MBAMBA C, TAIT S, BROUCKAERT C, EKAMA G, VANROLLEGHEM PA, BATSTONE D, JEPPSSON U, GERNAEY KV (2016) Feasibility testing of (plant-wide) recovery strategies in a water resource recovery facility. IWA 10th World Water Congress and Exhibition (WWC2016). [ Links ]
FLORES-ALSINA X, SOLON K, IKUMI D, KAZADI-MBAMBA C, TAIT S, BROUCKAERT C, EKAMA G, VANROLLEGHEM PA, BATSTONE D, JEPPSSON U, GERNAEY KV (2016) Feasibility testing of (plant-wide) recovery strategies in a water resource recovery facility. IWA 10th World Water Congress and Exhibition (WWC2016). [ Links ]
GERNAEY K, NOPENS I, VRECKO D, ALEX J and DUDLEY J (2006) An updated proposal for including further detail in the BSM2 PE calculation. [internal BSM2 taskgroup document] [ Links ]
GERNAEY KV, JEPPSSON U, VANROLLEGHEM PA and COPP JB (2014) Benchmarking of control strategies for wastewater treatment plants. Water Intell. Online 13 9781780401171. https://doi.org/10.2166/9781780401171 [ Links ]
GOUNDER P (2006) Modelling of the effects of textile industry wastewaters on the performance of a municipal wastewater treatment plant. MSc thesis, Department of Chemical Engineering, University of Natal, Durban, South Africa. [ Links ]
GUO LS (2014) Greenhouse gas emissions from and storm impacts on wastewater treatment plants: Process modelling and control. PhD thesis, modelEAU, Faculty of Science and Engineering, Université Laval. [ Links ]
HAUDUC H, RIEGER L, TAKÁCS I, HÉDUIT A, VANROLLEGHEM PA and GILLOT S (2010) A systematic approach for model verification: Application on seven published activated sludge models. Water Sci. Technol. 61 (4) 825-839. https://doi.org/10.2166/wst.2010.898 [ Links ]
HENZE M, GUJER W, MINO T, MATSUO T, WENTZEL MC and MARAIS GVR (1995) Activated Sludge Model No.2 (ASM2). IWA Scientific and Technical Report No.3, IWA Publishing, London. [ Links ]
HENZE M (2008) Biological Wastewater Treatment: Principles, Modelling and Design. IWA Publishing, London. [ Links ]
IKUMI DS (2011) The development of a three phase plant-wide mathematical model for sewage treatment. PhD. Thesis. Water Research Group, Department of Civil Engineering, University of Cape Town, Rondebosch, 7701, Cape Town, South Africa. [ Links ]
IKUMI DS, HARDING TH, VOGTS M, LAKAY MT, MAFUNGWA HZ, BROUCKAERT CJ and EKAMA GA (2015) Mass balances modelling over wastewater treatment plants III. WRC Report No. 1822/1/14. Water Research Commission, Pretoria. [ Links ]
IKUMI D, VOGTS M, EKAMA GA and BROUCKAERT CJ (2015) Plant-wide modelling of N and P removal with aerobic and anoxic-aerobic digestion of waste sludge. Proc. IWA Watermatex 2015, Gold Coast, Australia, 14-17 June 2015. [ Links ]
LIZARRALDE I, ARÉVALO TF, AYESA E [2018], FLORES - ALSINA X, IKUMI DS, MBAMBA CK, SOLON K, TAIT S, BROUCKAERT CJ, EKAMA GA, JEPPSSON U, GERNAEY K and BATSTONE D (2015) A Benchmark Simulation Model to Describe Plant-wide Phosphorus Transformations in WWTP. Proc. IWA Watermatex 2015, Gold Coast, Australia, 14-17 June 2015. [ Links ]
FLORES - ALSINA X, SOLON K, IKUMI D, KAZADI-MBAMBA C, TAIT S, BROUCKAERT C, EKAMA G, VANROLLEGHEM PA, BATSTONE D, JEPPSSON U, GERNAEY KV (2016) Feasibility testing of (plant-wide) recovery strategies in a water resource recovery facility. IWA 10th World Water Congress and Exhibition (WWC2016). [ Links ]
JEPPSSON U, SOLON K, VANROLLEGHEM PA, VANEECKHAUTE C, IKUMI D, KAZADI-MBAMBA C, BATSTONE D and GRAU P (2018) From WWTP to WRRF: A new modelling framework. Proc. IWA WRRMod2018, Lac Beauport, Québec, Canada, 10-14 March 2018. [ Links ]
JEPPSSON U (2005) Aeration energy and mixing energy for BSM1, BSM1_LT and BSM2. (Internal report for IWA Task Group on Benchmarking of Control Strategies for WWTPs. [ Links ])
JEPPSSON U, PONS M, NOPENS I, ALEX J, COPP J, GERNAEY K, ROSÉN C, STEYER J and VANROLLEGHEM P (2007) Benchmark simulation model no 2: general protocol and exploratory case studies. Water Sci. Technol. 56 67-78. https://doi.org/10.2166/wst.2007.604 [ Links ]
JEPPSSON U, ALEX J, BATSTONE D, BENEDETTI L, COMAS J, COPP JB, COROMINAS L, FLORES-ALSINA X, GERNAEY KV, NOPENS I, PONS M-N, RODRÍGUEZ-RODA I, ROSEN C, STEYER J-P, VANROLLEGHEM PA, VOLCKE EIP and VRECKO D (2013) Quo Vadis Benchmark Simulation Models? Water Sci. Technol. 68 1-15. https://doi.org/10.2166/wst.2013.246 [ Links ]
JONES RM AND TAKÀCS I (2004) Importance of anaerobic digestion modelling on predicting the overall performance of wastewater treatment plants. Procs. The Anaerobic Digestion Tenth World Congress, Montreal, Canada, 29 Aug -2 Sept 2004. 1371-1375. [ Links ]
LEOPOLD P and FREESE SD (2009) A simple guide to the chemistry, selection and use of chemicals for water and wastewater treatment. WRC Report No. TT 405. Water Research Commission, Pretoria. [ Links ]
LI Z, QI R, WANG B, ZOU Z, WEI G and YANG M (2013) Cost-performance analysis of nutrient removal in a full-scale oxidation ditch process based on kinetic modelling. J. Environ. Sci. 25 (1) 26-32. https://doi.org/10.1016/S1001-0742(12)60002-3 [ Links ]
MEIRLAEN J, VAN ASSEL J and VANROLLEGHEM P (2002) Real time control of the integrated urban wastewater system using simultaneously simulating surrogate models. Water Sci. Technol. 45 109-116. https://doi.org/10.2166/wst.2002.0066 [ Links ]
MUSVOTO EV, WENTZEL MC, LOEWENTHAL RE and EKAMA GA (2000a) Integrated chemical, physical and biological processes modelling Part I - Development of a kinetic based model for weak acid/base systems. Water Res. 34 1857-1867. https://doi.org/10.1016/S0043-1354(99)00334-6 [ Links ]
MUSVOTO EV, WENTZEL MC and EKAMA GA (2000b) Integrated chemical, physical and biological processes modelling Part II - Modelling aeration treatment of anaerobic digester supernatants. Water Res. 34 1868-1880. https://doi.org/10.1016/S0043-1354(99)00335-8 [ Links ]
MUSVOTO E and IKUMI D (2016) Energy use reduction in biological nutrient removal wastewater treatment plants: A South African case study. WRC Report No. TT 654/15. Water Research Commission, Pretoria. [ Links ]
NEUMANN MB (2012) Comparison of sensitivity analysis methods for pollutant degradation modelling: A case study from drinking water treatment. Sci. Total Environ. 433 530-537. https://doi.org/10.1016/j.scitotenv.2012.06.026 [ Links ]
NOPENS I, BENEDETTI L, JEPPSSON U, PONS M-N, ALEX J, COPP JB, GERNAEY KV, ROSEN C, STEYER J-P and VANROLLEGHEM PA (2010) Benchmark Simulation Model No 2: finalisation of plant layout and default control strategy. Water Sci. Technol. 62 1967. https://doi.org/10.2166/wst.2010.044 [ Links ]
PANAITESCUI, PANAITESCUI FV and ANTON IA (2015) Theoretical and experimental researches on the operating costs of a wastewater treatment plant. Mater. Sci. Eng. 95 012131 [ Links ]
SECO A, RIBES J, SERRALTA J and FERRER J (2004) Biological nutrient removal model no. 1 (BNRM1). Water Sci. Technol. 50 (6) 69-78. https://doi.org/10.2166/wst.2004.0361 [ Links ]
SOLON K, FLORES-ALSINA X, KAZADI MBAMBA C, IKUMI D, VOLCKE EIP,VANEECKHAUTE C, EKAMA G, VANROLLEGHEM PA, BATSTONE DJ, GERNAEY KV, JEPPSSON U (2017) Plant-wide modelling of phosphorus transformations in wastewater treatment systems: Impacts of control and operational strategies. Water Res. 113 97-110. https://doi.org/10.1016/j.watres.2017.02.007 [ Links ]
SÖTEMANN SW, VAN RENSBURG P, RISTOW NE, WENTZEL MC, LOEWENTHAL RE and EKAMA GA (2005) Integrated chemical, physical and biological processes modelling Part 2: Anaerobic digestion of sewage sludges. Water SA 31 545-568. [ Links ]
VANHOOREN H, MEIRLAEN J, AMERLINCK Y, CLAEYS F, VANGHELUWE H and VANROLLEGHEM PA (2003) WEST: Modelling biological wastewater treatment. J. Hydroinf. 5 27-50. https://doi.org/10.2166/hydro.2003.0003 [ Links ]
VANROLLEGHEM PA, JEPPSSON U, CARSTENSEN J, CARLSSON TB and OLSSON G (1996) Integration of wastewater treatment plant design and operation - a systematic approach using cost functions. Water Sci. Technol. 34 159-171. https://doi.org/10.2166/wst.1996.0429 [ Links ]
VANROLLEGHEM PA, INSEL G, PETERSEN B, SIN G, DE PAUW D, NOPENS I, WEIJERS S and GERNAEY K (2003) A comprehensive model calibration procedure for activated sludge models. In: Proceedings WEF 26th Annual Technical Exhibition and Conference (WEFTEC, 2003), Los Angeles, CA, USA, 11-15 Oct, 2003. https://doi.org/10.2166/wst.1996.0429 [ Links ]
VANROLLEGHEM PA, GUO L, FLORES - ALSINA X, IKUMI DS, MBAMBA CK, SOLON K, TAIT S, BROUCKAERT CJ, EKAMA GA, JEPPSSON U, GERNAEY K and BATSTONE D (2015) A Benchmark Simulation Model to Describe Plant-wide Phosphorus Transformations in WWTP. Proc. IWA Watermatex 2015, Gold Coast, Australia, 14-17 June 2015. [ Links ]
SOLON K, IKUMI DS, BATSTONE D, GERNAEY KV, BROUCKAERT CJ, TAKACS I, GRAU P, EKAMA GA and JEPPSSON U [2014]. Towards BSM2- GPS-X: A plant-wide benchmark simulation model not only for carbon and nitrogen, but also for greenhouse gases (G), phosphorus (P), sulphur (S) and micropollutants (X), all within the fence of WWTPs/WRRFs. Proc. IWA WWTMod2014, Spa Belgium, 30 Mar - 2 Apr 2014. [ Links ]
VERRECHT B, MAERE T, NOPENS I, BREPOLS C and JUDD S (2010) The cost of a large-scale hollow fibre MBR. Water Res. 44 5274-5283. https://doi.org/10.1016/j.watres.2010.06.054 [ Links ]
VOGTS M, IKUMI D and EKAMA G (2015) The removal of N and P in aerobic and anoxic-aerobic digestion of waste activated sludge from biological nutrient removal systems. Water SA 41 199-211. https://doi.org/10.4314/wsa.v41i2.05 [ Links ]
VOLCKE EIP, VAN LOOSDRECHT MCM and VANROLLEGHEM PA (2006) Continuity-based model interfacing for plant-wide simulation: A general approach. Water Res. 40 2817-2828. https://doi.org/10.1016/j.watres.2006.05.011 [ Links ]
VRECKO D, GERNAEY K, ROSEN C and JEPPSSON U (2006) Benchmark simulation model No 2 in Matlab-Simulink: towards plant-wide WWTP control strategy evaluation. [ Links ]
WENTZEL M, MBEWE A, LAKAY M and EKAMA G (2001) Evaluation of a modified flocculation filtration method to determine wastewater readily biodegradable COD. Chemical Technology, Bedfordview. 21-23. [ Links ]
WIECHERS HNS (ed.) (1984) Theory, design and operation of nutrient removal activated sludge processes. Water Research Commission, Pretoria. [ Links ]
Received 4 August 2017
Accepted in revised form 20 August 2018
* To whom all correspondence should be addressed. +27 21 6505162; e-mail: david.ikumi@@uct.ac.za

