


Servicios Personalizados
Articulo
 Inglés (pdf)
 Articulo en XML
 Referencias del artículo
Indicadores

Links relacionados
-
 Citado por Google
 -
 Similares en Google
Compartir

 Permalink
Water SA
versión On-line ISSN 1816-7950
versión impresa ISSN 0378-4738
Water SA vol.44 no.4 Pretoria oct. 2018
http://dx.doi.org/10.4314/wsa.v44i4.01
ORIGINAL ARTICLES
Sensitivity analysis for water quality monitoring frequency in the application of a water quality index for the uMngeni River and its tributaries, KwaZulu-Natal, South Africa
JN NamugizeI, *; GPW JewittI, II
ICentre for Water Resources Research, School of Agriculture, Earth and Environmental Sciences, University of KwaZulu Natal, P/Bag X01, Scottsville 3209, South Africa
IIUmgeni Water Chair of Water Resources Management, University of KwaZulu Natal
ABSTRACT
Water quality indices are commonly used to provide summary information from water quality monitoring programmes to stakeholders. However, declining funding and changing mandates often result in reduced monitoring frequencies which could affect the accuracy of information provided. Thus, this study aimed to assess the effect of water sampling frequency on water quality index reporting using the the upper uMngeni catchment as a study site. A 28-year time series of water quality data from 11 sampling stations was assessed for pH, electrical conductivity, temperature, turbidity, total suspended solids, Escherichia coli counts, NH4-N, NO3-N, PO4-P and total phosphorus. Statistical packages were used to process the data and water quality indices (WQIs) for eutrophication and recreational water were calculated and their sensitivity to input parameters analysed. It was found that the higher the monitoring frequency, the lower the WQI calculated at all sites. This suggests that water quality, due to a declining monitoring frequency, is poorer than reported in the uMngeni catchment. The findings showed that Escherichia coli and turbidity are the most influential variables affecting the recreational and eutrophication WQIs, respectively. Although WQIs are considered a useful tool for monitoring the changes in water quality across space and over time in the uMngeni Catchment, their use should complement, and not substitute for, other, more comprehensive, water quality management tools.
Keywords: monitoring frequency, sensitivity analysis, uMngeni catchment, water quality guidelines, water quality index
INTRODUCTION
Water quality problems are associated with natural processes and anthropogenic activities such as urbanisation, industrial development (UNEP-GEMS/Water, 2008), wastewater discharge and expansion of agricultural activities (Chilundo et al., 2008; UNEP, 2010). Globally, contribution of human activities to water quality deterioration outweighs the natural sources of water pollution (UNEP-GEMS/Water, 2008). Safe and adequate water is a primary need for all living organisms, environment and ecosystem protection, and the lack of sufficient, safe and clean water is a socio-economic limitation to development in many countries (Liu et al., 2013). Water, energy and food, popularised now as the food-water-energy nexus, are the primary needs for human well-being and the natural ecosystem plays a key role in their provision (Jewitt, 2002, Kumar and Saroj, 2014).
Three fundamental solutions to water quality issues include pollution prevention, water treatment and restoration of ecosystems. These must be supported by water monitoring programmes aiming to identify sources of pollution to guide responses (Zhao et al., 2014) and to assess their effectiveness. Sampling strategy is core to any monitoring programme and is intended to guide the collection of water quality data and produce records that can be used to understand the changes that occur in a waterbody and to make management decisions for pollution prevention or in response to pollution events (Chang et al., 2014; Wang et al., 2015). A water quality sampling plan must take into consideration the water users and intended water quality, has to be cost-effective and must provide reliable and representative information (Roig et al., 2007). However, limited monitoring or alterations to monitoring programmes may compromise these ideals. A high sampling frequency is deemed to be the best option for waterbodies with high variation of water quality and provides data for estimates of pollutant flux (Tate et al., 1999; Absalon et al., 2014; Bieroza and Heathwaite, 2015). However, the high cost of physical water collection and subsequent laboratory analysis costs have led to rationalisation or limited monitoring, which curtail information on water quality, particularly in developing countries (Murphy et al., 2015).
In South Africa, 12 million of the rural South African population do not have access to safe drinking water and rely on untreated water directly from rivers for domestic water usage (Thwala, 2010; Gakuba et al., 2015). Water from many South African rivers is of poor quality, as it has high turbidity owing to dominant clay and silt soil types (CSIR, 2010), and this has been further compromised by development in the country's catchments. Villiers and Thiart (2007) reported enrichment in dissolved inorganic nitrogen (NO3- + NO2-) and soluble reactive phosphorus (SRP) in the 20 largest catchments of South Africa. The promulgation of an upper phosphorus limit of 1 mg/L from all Wastewater Treatment Works (WwTWs) in 1980 was an attempt to address concerns that South Africa has some of the most eutrophic aquatic systems in the world (Van Ginkel, 2011; Coetzee and Hill, 2012; Matthew, 2014).
High levels of nutrients, sediment and microbial contamination have been identified as major water quality problems in the uMngeni River (Lin et al., 2012; Matongo et al., 2015). These are ascribed to poor catchment management, growth of unsewered human settlements, poor sanitation (Olaniran et al., 2014; Gakuba et al., 2015), population growth in rural areas, agricultural malpractices, dysfunctional sewage networks and the use of powdered laundry detergents (Villiers and Thiart, 2007; Quayle et al., 2010).
Water quality indices are widely used to present summary information about the status of a catchment's water resources. A water quality index (WQI) is a quantitative method for aggregating a complex dataset of water quality parameters, by converting pollutant concentrations into sub-index values and combining them into a single number or index (Cude, 2001). WQIs are widely used throughout the world. A WQI is intended to facilitate interpretation of water quality information by scientists, the general public, managers and decision-makers (Terrado et al., 2010; Hurley et al., 2012; Allam et al., 2015), who require concise information about waterbodies (Boyacioglu, 2010). A WQI helps to identify water pollution problems which need particular emphasis, provide a water quality baseline and highlight its spatial and temporal variation, and assess the performance of a water quality monitoring programme (Terrado et al., 2010). WQIs can bridge the gap between water experts and the public and so contribute to human development and ecological stability (Hurley et al., 2012). However, it should be noted that several authors argue that WQIs are inconclusive due to a lack of biological, physico-chemical data, cannot be generally used in predictive models (Cude, 2001) and do not substitute for other methods of water quality data analysis (Khan et al., 2005).
There are many WQIs in use internationally and in South Africa. The flexibility and simplified calculation of the Canadian Council of Ministers of Environment Water Quality Index (CCME WQI) has made it the most globally used of the various WQIs (Lumb et al., 2006; Rickwood and Carr, 2009; Terrado et al., 2010; Abtahi et al., 2015), and it has been the subject of many modifications according to the objectives at the waterbodies investigated (Hurley et al., 2012).
The CCME WQI can accommodate a large database of water quality information. This index is easily adaptable to different legal requirements and to the selection of input variables (Rickwood and Carr, 2009). It also provides the possibility of changing water quality objectives being met according to different water uses (Rickwood and Carr, 2009; Terrado et al., 2010). The index does have some disadvantages, such as assigning all variables the same weight in index calculations, regardless of their different effects on water quality deterioration, and it does not accommodate the biological and hydro-morphological components of a waterbody (Terrado et al., 2010). Moreover, the fact that the CCME WQI gives the same importance to all variables is another limitation that has been reported (Terrado et al., 2010). In addition, the Canadian WQI ignores the sources of uncertainties in aquatic environments, such as those related to monitoring error, and heterogeneity of pollutants, hydrodynamic and biological data, as well as those related to analytical methods used in the laboratory (Ip et al., 2009). Given its wide acceptance, the CCME WQI could be a useful tool to provide information on spatial and temporal variations of water quality in the uMngeni River and its tributaries. Information to be generated by this index could be easily disseminated to all stakeholders active in water resource management in the catchment, and could help policy and decision-makers to draw relevant conclusions on water pollution issues within the area.
WQIs are important tools for communicating catchment water quality data, but they are reliant on good quality data. Despite deterioration in water quality, monitoring programmes are declining and data availability is problematic. Therefore, it is likely that WQIs and the useful information they provide are compromised by declining availability of data. We tested this assumption, using the CCME WQI in South African conditions. Thus, the overall objective of this study was to assess how inconsistency in river monitoring sampling frequency may compromise the performance of a WQI and affect decision-making in response to the water quality information it provides. To achieve this objective, eutrophication and recreational WQIs were calculated, using the CCME QWI system, and the influence of changes in frequency of monitoring on the results was assessed.
METHODS
Study area and sampling sites
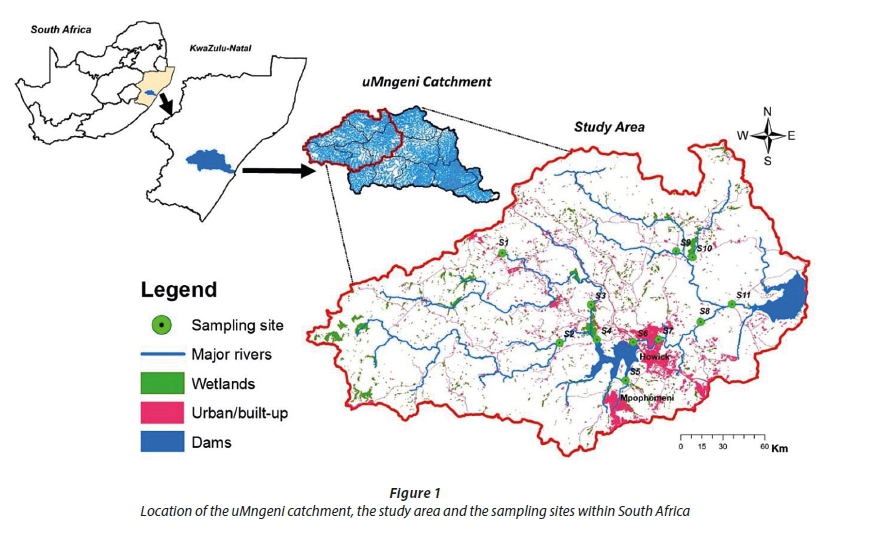
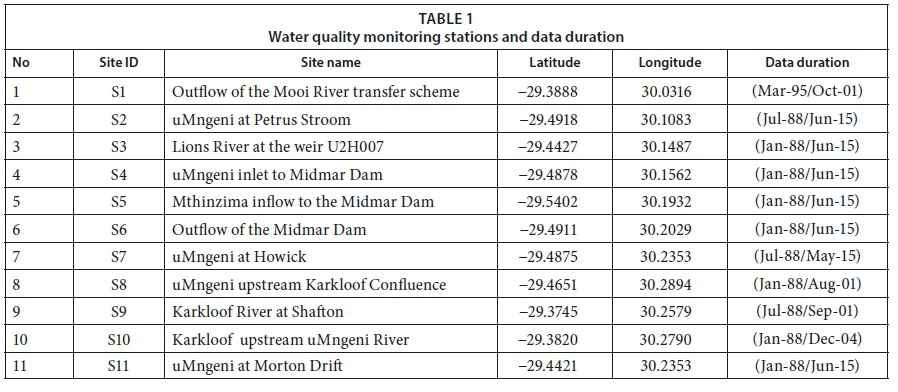
The uMngeni River catchment plays a vital role in the economy of the KwaZulu-Natal (KZN) Province. This catchment is one of the five components of the Mvoti to Umzimkulu Water Management Area (WMA), supplying drinking water to over 4.5 million inhabitants of the province (DWAF, 2004). Water demands in the catchment exceed the available water resource and, as a result, water transfer schemes from the Mooi River to the uMngeni River have been constructed, with others planned for the future (UW, 2013). It is estimated that 70% of the population in the WMA is concentrated in the uMngeni catchment, attracted by developmental infrastructure and employment opportunities, largely in and around the cities of Durban and Pietermaritzburg (DWAF, 2003). The Midmar and Albert Falls Dams, both located in the upper reaches of the catchment, produce three quarters of the runoff generated in the whole uMngeni catchment system (Breen, 1983; Jewitt et al., 2015). The area is characterized by an annual rainfall greater than 700 mm/a and the study area covers 5 quarternary catchments of the upper reaches of the uMngeni River. Major land uses as of 2011 were natural vegetation, forest plantations, cultivation and urban/built-up, representing 42%, 26%, 17% and 5% of catchment area, respectively (Namugize et al., 2018). Occurrence of eutrophication and resulting increases in algal populations at the Midmar and Albert Falls Dams are the foremost concerns, with the potential to impair recreational water use and increase the cost of drinking water treatment in the catchment (Graham, 2004; Matthews, 2014). Water quality indices were computed for the 11 monitoring sites of the uMngeni River and its tributaries upstream of the Albert Falls Dam (1 653 km2), representing 38% of the surface area of uMngeni Catchment (Fig. 1 and Table 1). Detailed descriptions of the study area are presented in Hay (2017) and Namugize et al. (2018) and only a brief description of the sampling points is given here.
Water quality data acquisition
A long-term water quality dataset was obtained from Umgeni Water. Water quality parameters included in this assessment are electrical conductivity (EC), pH, temperature, turbidity, soluble reactive phosphorus (SRP), total phosphorus (TP), ammonium (NH4-N), nitrate (NO3-N), total suspended solids (TSS) and Escherichia coli (E. coli). The dataset is made up of samples collected following a monitoring frequency which varied between monthly and weekly for the period 1988-2015. Heavy metals were not included in our data analysis because they do not influence eutrophication (Graham, 2004) and are currently not considered an important issue for water pollution in the upper reaches of the catchment (Lin et al., 2012; Rangeti, 2014), as surface water quality is not linked to any significant industrial activity (Manickum et al., 2014).
Calculation of the CCME WQI
For this study, the application of CCME WQI involved 3 steps: (i) the definition of a list of water constituents characterizing water quality of the waterbody (ii); establishment of water quality objectives to be met; and (iii) the calculation of the water quality index (Lumb et al., 2006; Boyacioglu, 2010; Terrado et al., 2010).
The scope, frequency and amplitude are three factors considered in assessing the CCME WQI:
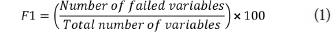
•Scope (F1): represents the percentage of water quality parameters that failed to meet their guidelines at least once, relative to the number of variables measured (Eq. 1).
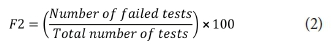
•Frequency (F2): represents the number of times the objectives are not met (Eq. 2).
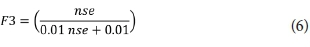
•Amplitude (F3): represents the amount by which failed test values do not meet objectives (Eq. 6).
All three factors are summed as vectors to obtain the CCME WQI for a particular set of samples for each sampling site (Eq. 7).
The percentage of variables that do not meet the objectives:
The percentage of individual tests that do not meet the objectives is calculated as:
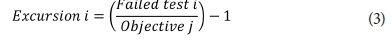
The calculation of F3 follows 3 steps:
(a) When the test value must not exceed objective:
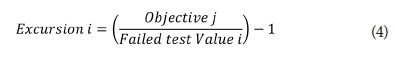
(b) If the test value must not fall below the objective:
(c) Then, the normalised sum of excursions (nse) is calculated as:
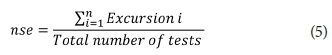
F3 is computed as an asymptotic function that scales the normalized sum of excursions from objectives (nse) to yield a value ranging between 0 and 100
Finally, CCME WQI is computed as:

Where the value 1.732 has been used to scale the index from 0-100;
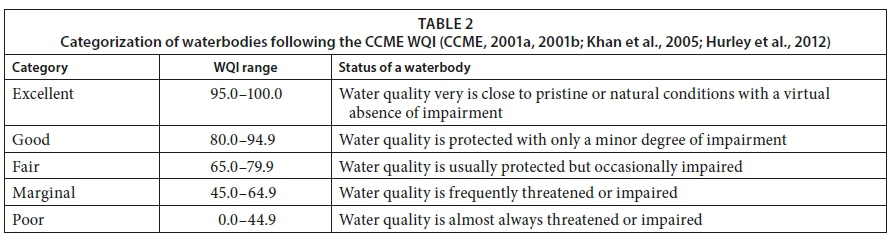
Further details on CCME WQI calculations are explained by different authors (CCME, 2001a, 2001b; Khan et al., 2005; Lumb et al., 2006). The CCME WQI can be calculated manually, following Eq. 7. However, for a large dataset of water quality information an Excel macro is available from the CCME webpage (http://www.ccme.ca/en/resources/canadian_environmental_quality_guidelines/calculators.html). The WQI score ranges from 0 to 100, for poor water quality to excellent water quality, respectively. The categorisation of a waterbody according to the CCME WQI is summarized in Table 2.
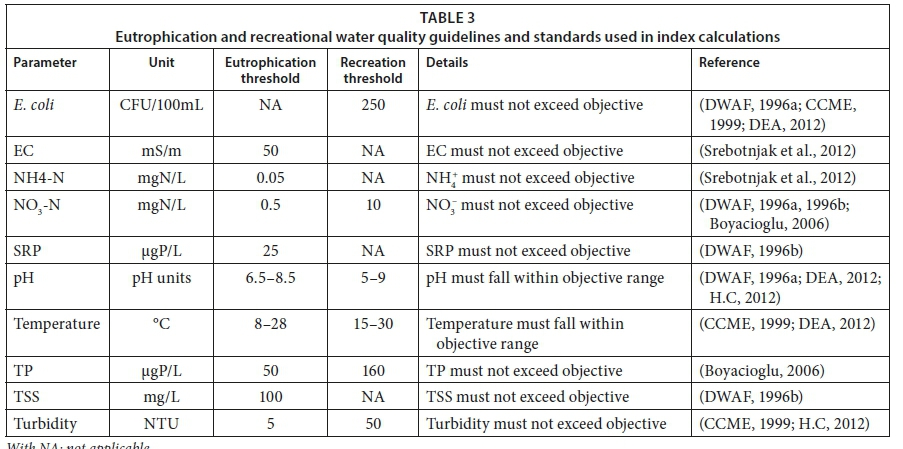
To assess the water quality score for the uMngeni River and its tributaries, data collected were tested for compliance with eutrophication and safe recreational benchmarks and/or standards for South Africa, the World Health Organization (WHO) and Canadian Council of Ministers of Environment. The choice of water quality variables to be included in index calculations was based on parameters which are known to contribute to eutrophication of a waterbody, impairment of human health through contact during recreational water use (for example E. coli) and the availability of the water quality monitoring database in the catchment. A 4-by-4 rule was applied whereby at least 4 water quality variables consistently measured at least 4 times per year for each site was a requirement for inclusion in the index calculation (CCME, 2001a; UNEP-GEMS/Water, 2007). Overall WQIs were computed for eutrophication and recreational water use standards for each site as Table 3 indicates. Application of the CCME WQI in the upper reaches of the uMngeni River catchment resulted in the calculation of 2 water quality sub-indices, namely, a eutrophication water quality index (EWQI) and a recreational water quality index (RWQI).
Data processing and analysis
Umgeni Water implemented a consistent weekly water quality monitoring programme in the uMngeni River and its tributaries from early 1987 to 2000. However, from 2001 to 2015, irregularity in frequency of sampling was noted, varying from bi-weekly to monthly, quarterly, occasionally, or no samples per annum.
In order to assess the influence of the sampling frequency on WQIs, the weekly water quality data (1988-2000) were arranged into 3 categories: (i) for a weekly sampling programme all 4 samples taken in a month (48 samples per year) were included in the index computation, (ii) for a bi-weekly sampling, the first and third week's samples were included in index calculation (24 samples per year), and the other 2 samples hidden; and (iii) for a monthly sampling frequency, 3 out of 4 samples were excluded from the index calculation (12 samples per year). For each sampling frequency, an overall annual WQI was computed for each site (Table 3). A comparison of the three calculated indices following different sampling frequencies was carried out, using graphs and trend analysis. In addition, a sensitivity analysis of the WQIs was undertaken to check the effect of each input parameter on overall WQI after its removal from the index computation, compared to the original index. In this particular exercise, the water quality data collected from 1988 to June 2015 have been included in the index calculation irrespective of the monitoring frequency. Descriptive statistic tools of Sigma plot (Version 10.1, Systat Software, Inc. SigmaPlot, ink) were used to assess the variability of water quality in the catchment.
RESULTS AND DISCUSSION
Effects of monitoring frequency on WQI
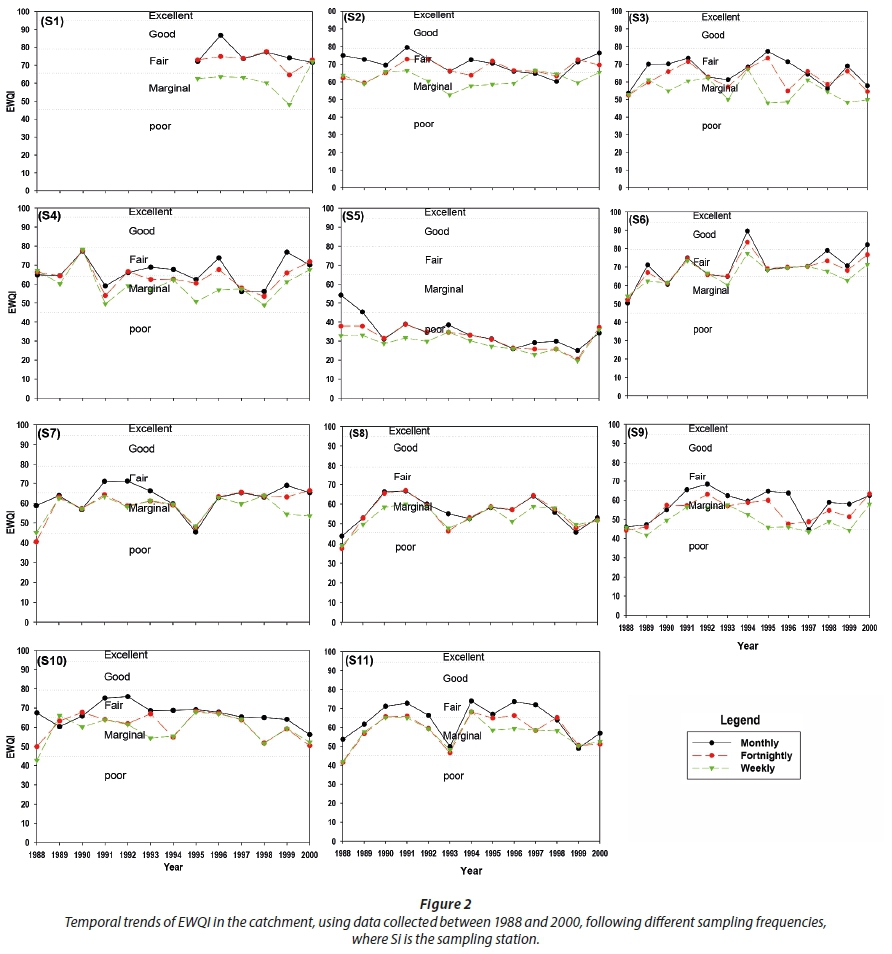
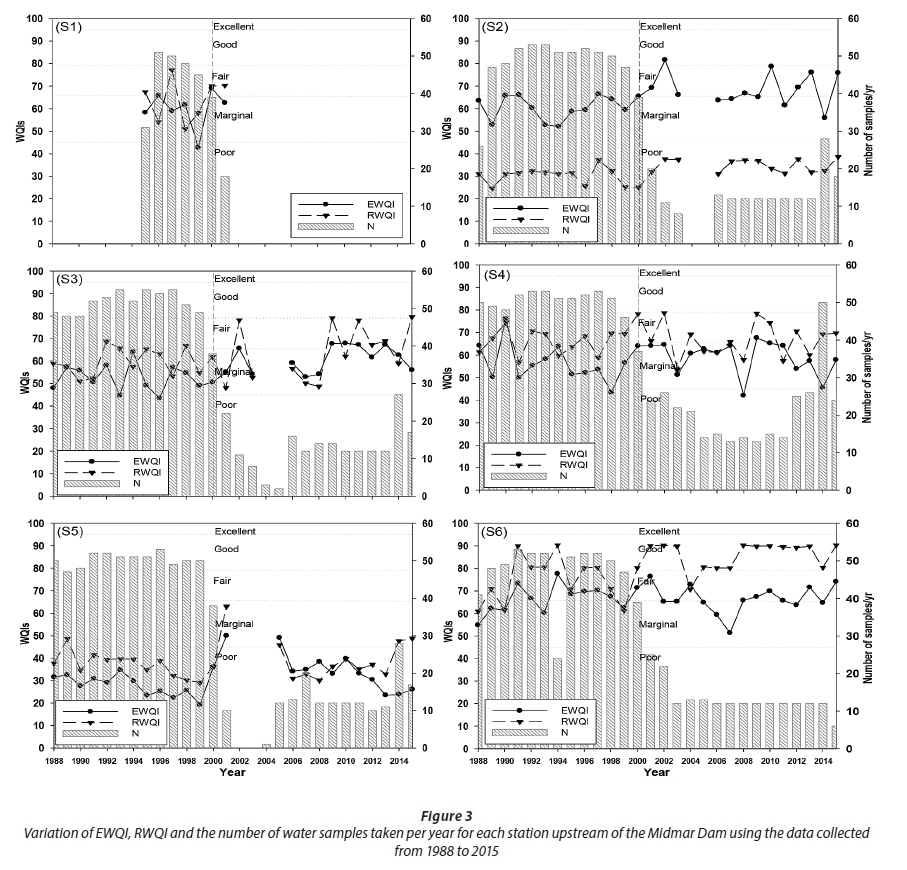
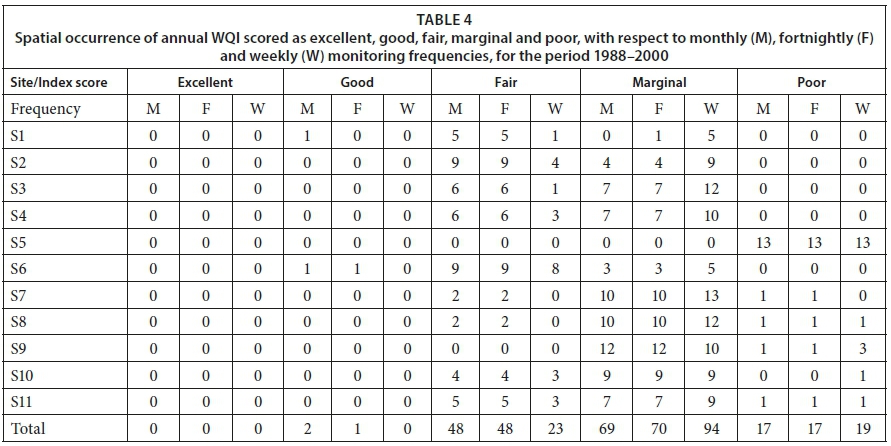
An attempt to assess the effects of the sampling frequency on the WQI score for each sampling station was undertaken as presented in Figs 2 and 3. The EWQI score variation within sites was not uniform. For example, when implementing a monthly sampling strategy, two scores of 'good' water in the catchment were noted at Sites S1 and S6. When implementing a fortnightly monitoring frequency oneevent of water ranked as 'good' was noted at Site S6, while following a weekly sampling plan no site was rated as 'good' (Table 4). This elucidates the sensitivity of the EWQI to the number of samples included in the index calculation. Simultaneously, the number of sites which scored 'fair' decreased through the bi-weekly to weekly monitoring frequency, coinciding with an increase in number of sampling sites rated 'marginal' (Table 4). However, the WQI provided similar water quality information for the monthly and fortnightly monitoring frequencies. The EWQI of uMngeni River and its tributaries ranged from 'fair' to 'marginal', but was predominantly 'marginal', for a weekly sampling frequency (Figs 2 and 3).
Generally, there was a decrease in the water quality score as a result of increasing monitoring frequency from monthly to weekly. This was noted for all monitored sites. This confirms the reliability of WQI calculated by implementing a high-frequency sampling programme (Terrado et al., 2010; Bieroza and Heathwaite, 2015). These results are consistent with findings of CCME (2006), which indicated the sensitivity of the WQI to the number of measurements. The cause of this decline in WQI following a high-frequency monitoring programme can be attributed to the capturing of streamflow events and biogeochemical processes which are not captured by a low-frequency water quality monitoring programme. Although many factors drive the quality of water in a watercourse, i.e., climatic and physiographic conditions, land use and land cover types of contributing catchments, morphology and size of the river channel and its flow regime, this phenomenon was also reported in other studies, for example, Loftis and Ward (1980); Tate et al. (1999); Bieroza and Heathwaite (2015); Lessels and Bishop (2015) and many more.
Temporal variation of WQIs (1987-2000)
Temporal trends are illustrated in Fig. 2. They indicate a high variability of WQIs, with the exception of Sites S5 and S6. Site S5 had a poor water quality score irrespective of the monitoring frequency and water quality of this station declined from 1988 to 2000, which could be ascribed to dysfunctional sewage systems and the increase of informal human settlements in Mpophomeni Township (GroundTruth, 2012; Dabrowski et al., 2013).
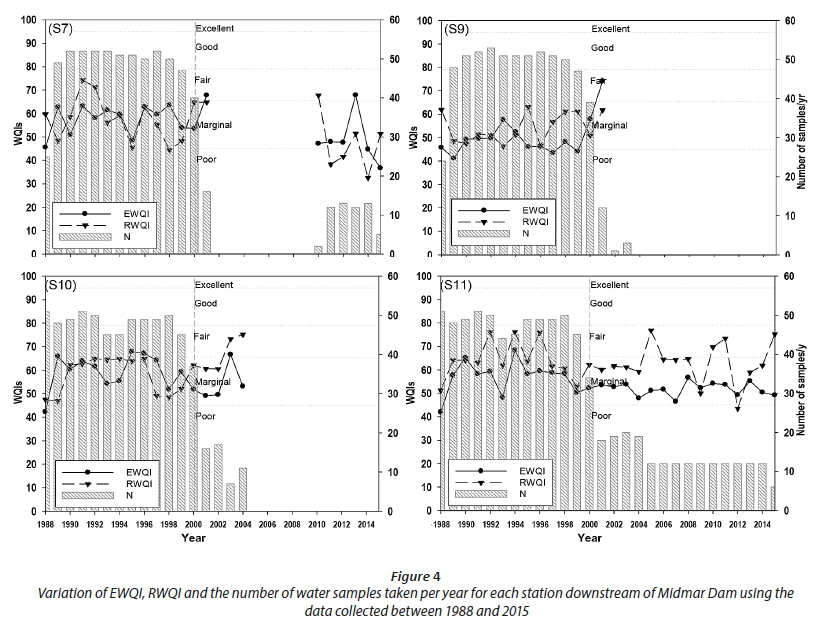
At Site S6, the water quality score increased slightly but remained in the range of 'fair' to 'marginal' with occasional occurrence of 'good', with an improvement from 1988 to 2000. In other sites downstream of Midmar Dam (S7, S8, S9, S10 and S11), WQIs were predominantly 'marginal' (Fig. 2). The trends analysis indicated an overall water quality deterioration within sites over time. These results indicate the deterioration of water quality from upstream to downstream in the catchment as confirmed by other research studies (Graham, 2004; GroundTruth, 2012; Rangeti, 2014). The decline in water quality at Site S7 was not surprising as this site may reflect major effluent discharges from Howick and Hilton urban areas and the influence of the poorly functioning Howick WwTWs (Taylor et al., 2016). Furthermore, other point sources of pollution associated with small WwTWs at schools, etc., are possible sources of water deterioration at Sites S8 and S11 (Hudson et al., 1993).
Temporal and spatial variability of WQIs (1988-2015)
The period 2000-2015 shows a decreasing sampling frequency; hence analysis is compromised. In general, there was a temporally variable pattern in the WQIs from 1988 to 2015. A decrease in water quality monitoring frequency has occurred at all 11 sites across the catchment, ranging from weekly (48-55 samples per year) in the pre-2000 period, to monthly monitoring frequency (12 samples per year) after 2000 (Figs 3 and 4). Lack of water quality monitoring data for Sites S1 (for the period before 1995 and after 2001), S7 (for 2002-2009), S8, S9 and S10 (after 2002 upward) hindered the index calculations for these periods (Figs 3 and 4).
EWQI varied between 'fair' to 'marginal' at 10 sites, with Station S5 classified as 'poor' from 1988 to 2015 (index was below 45 for 22 years out of 25). RWQI followed the same trends ('fair' to 'marginal') with exceptions at Sites S5 and S2 which scored as 'poor'. The consistent temporal pattern of poor water quality at S5 reflects the impacts of dysfunctional manholes and sewers discharging to the Mthinzima stream, as well as poor waste management from Mpophomeni Township (GroundTruth, 2012; Namugize et al., 2018; Ngubane et al., 2016). The poor RWQI score noted at Site S2 could be ascribed to E.coli levels, which were high, exceeding the objective of 250 CFU/100 mL, and the index was very sensitive to this parameter in the catchment. Occurrence of 'good' water quality scores at the outflow of the Midmar Dam (S6) highlighted the pollutant sequestration by the impoundment (Maavara et al., 2015; Namugize et al., 2018). These results also show an increase in WQI with a decline in monitoring frequency. This relationship is consistent for Sites S2, S3, S4 and S6, upstream of Midmar Dam (Fig. 3). However, the opposite trend was noted at Site S11, indicating the high level of pollution occurring between the Midmar and Albert Falls Dams, ascribed to effluent discharges from WwTWs and other point sources of pollution in that portion of the catchment (Hudson et al., 1993; Taylor et al., 2016) (Fig. 4). However, a lack of water quality data at Sites S7, S8, S9 and S10 for the period after 2002 was a major challenge.
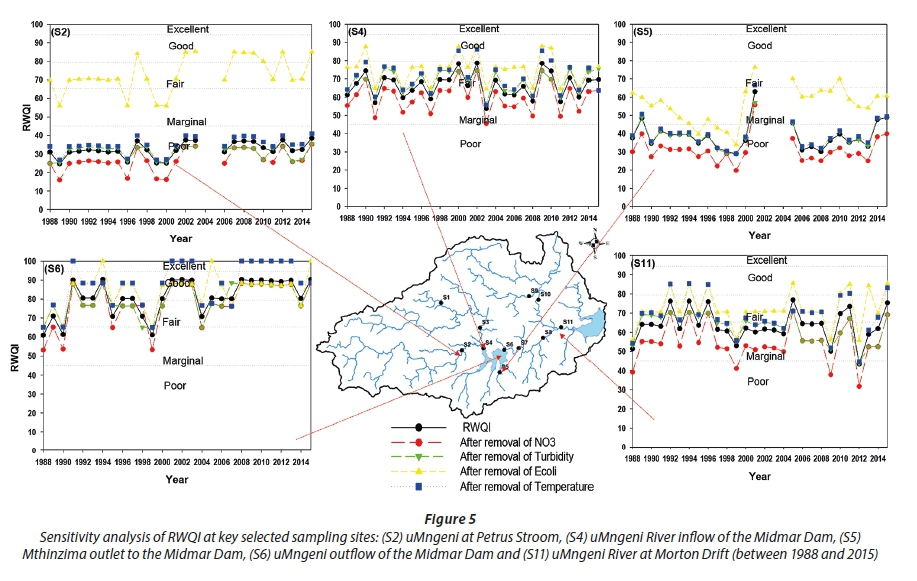
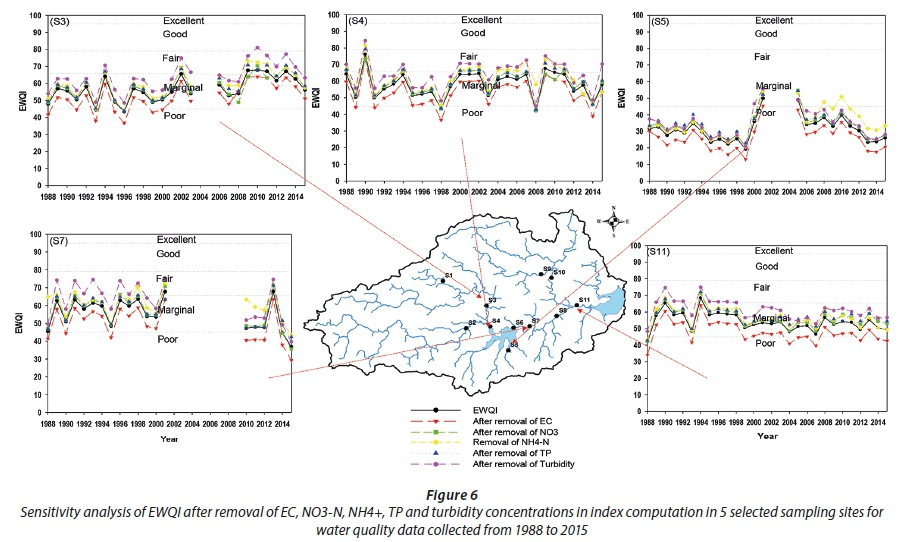
Sensitivity analysis of WQIs
A sensitivity analysis is defined as a study of the response of an output variable in respect to variations of input variables. This was undertaken to determine which water quality variable most influences the score of WQIs. The comparison was done by removing each variable in turn from the calculation of WQI and the overall annual index and comparing the results, as Figs 5 and 6 indicate. In the RWQI dataset, each individual parameter of nitrate, E.coli, temperature and turbidity has been removed and the index computed. The ouput score was compared to the original index including all 6 parameters. Results show that the parameters which exceed the guidelines are the most influential in affecting the output score. Thus, their removal has resulted in an increased WQI (CCME, 2006).
In this study, it was found that E. coli is the key parameter influencing the RWQI at all sites. For example, the removal of E. coli in the index calculation at Site S2 resulted in an overall index increase of 40 units per year. This resulted in an increase in the number of occurrences of an index scored as 'good', 'fair' and 'marginal', several times and across the catchment (Fig. 5). This supports previous studies which have highlighted E. coli as the major constituent affecting water quality in uMngeni Catchment (Graham, 2004; Lin et al., 2012; Rangeti, 2014; Matongo et al., 2015). Effects of turbidity and nitrate on overall RWQI score were low and varied among the sites and their values did not exceed the South Africa recreational standard limits (DWAF, 1996a). Therefore, their removal resulted in a drop in the index. Temperature greatly influenced the RWQI at Site S6 (outflow of Midmar Dam) as a result of variation of temperature between summer and winter days, water residence time within the reservoir and reservoir characteristics, highlighting it as an important parameter which catalyses biological and chemical transformations taking place in water (Effendi et al., 2015). The influence of this parameter was also noted at Sites S4 and S11.
A sensitivity analysis of EWQI was assessed by the individual removal of EC, NO3, NH4, TP and turbidity in calculation of an overall index. EWQI is largely affected by the turbidity of water as removal of this parameter led to an increased frequency of EWQI scores which shifted from 'marginal' to 'fair' at the sites presented in Fig. 6. High turbidity of water characterises many South African rivers, as it is linked to naturally occurring soil types (CSIR, 2010). The removal of NO3, NH4 and TP resulted in an increase in index score, but the WQI score remained in the range of 'marginal' to 'fair'. For example, in 10 out of 11 sites, the removal of turbidity in computation results in an increased index. However, the contribution of turbidity to EWQI was weak at Site S5 where most of the parameters exceeded their objectives. The removal of each of the other variables (temperature, EC and TSS) led to a decrease in EWQI, because for these variables only a few records failed to meet the objectives. These results highlight the importance of the number of variables included in the final index score (Rickwood and Carr, 2009).
In summary, the selection of water parameters, water quality standards/guidelines and occurrence of exceedance of the objective are the key factors which determine the sensitivity of the WQI. This has provided useful information on the determination of the variables lowering WQI for both the recreational and eutrophication WQIs. The Canadian WQI system has advantages for application in data-scarce areas as 4 measurements are sufficient to calculate an annual index. The seasonal variation of WQI can also be calculated, using this index, but this was not part of this study, due to the poor quality of the available long-term dataset (28 years).
CONCLUSIONS
The aim of this study was to assess the effect of water quality monitoring frequency on water pollution reporting using a WQI derived from a 28-year water quality dataset from the upper reaches of uMngeni Catchment as an illustrative example. Recreational and eutrophication indices for the uMngeni River and its tributaries were developed based on the CCME WQI system to assess water quality deterioration in the area. Our analysis suggests that a general decline in the monitoring frequency has resulted in higher values for WQI than would otherwise be attained. In the catchment, water quality for the period 1988 to 2000 ranged between 'marginal' and 'fair' with the exception of the Mthinzima Stream draining Mpophomeni Township, with a 'poor' score. Across the catchment, water quality deteriorates in space (from upstream to downstream) and fluctuated over time within the sites. However, lack of water monitoring data at sites (S7, S8, S9 and S10) downstream of Midmar Dam after 2000 was a major challenge. This implies that water quality is actually poorer than reported.
A sensitivity analysis of WQIs showed that E. coli and turbidity were the key parameters affecting the recreational and eutrophication WQIs in the catchment. It was indicated that over 90% of monitored stations have E. coli levels exceeding the limits for human full contact with water (≤ 250 CFU/100mL). These results are consistent with other research studies carried out in this catchment, which indicated bacteriological pollution creating a serious public health risk for contact with uMngeni River waters and high turbidity of water in South African rivers (Kienzle et al., 1997; CSIR, 2010; Lin et al., 2012, Matongo et al., 2015).
As no single water parameter can characterize the status of the quality of a waterbody, these results highlight a need for continuous and long-term water quality monitoring programmes in the catchment. That study shows that WQIs can be useful supporting tools to summarise large water quality datasets and provide information understandable by scientists, water suppliers, planners, policy makers and the general public. However, information provided by using WQIs may be compromised by declining monitoring frequency, high or low sensitivity to particular input parameters and success/failure-type thresholds in their formulation, as shown in this study. Therefore, reporting of WQI outputs must be supported by scientific, traditional and local knowledge. WQIs cannot fully substitute for other methods of water quality data interpretation. Although WQIs provide useful broad-brush information, they have limitations brought about by variable sampling frequency, sensitivity to input parameters and thresholds selected for 'failure'. Thus detailed analysis of water quality problems needs to move beyond mere use of WQIs; i.e., they are illustrative tools, not the ultimate water quality management tool.
Given the importance of frequent sampling to adequately reflect water quality, the study recommends that a combination of event-based and spot sampling programmes could provide more conclusive information on the current range and status of water quality in the uMngeni catchment. Event-based samplers should be installed on the major tributaries of the uMngeni River (Lions and Karkloof) and at the point of uMngeni inflow to the large dams. Continuation or reinstatement of the weekly sampling regime which includes the sites downstream of the Midmar Dam could provide clarification on the sources of a declining quality of water at Site S11.
A lack of key water quality variables indicative of organic pollution such as dissolved oxygen and biochemical oxygen demand in Umgeni Water's database prevented the use of other water quality indices such as the NSFWQI, UWQI, OWQI and the FWQI. Furthermore, an in-house UW WQI, is under development (Hodgson, 2016) and was not accessible during the study period. A comparative study of this and the CCME WQI could provide useful insights.
ACKNOWLEDGEMENTS
Special thanks are accorded to the South Africa Water Research Commission and Umgeni Water for funding this PhD research (WRC K5/2354). Umgeni Water and the Department of Water Affairs are acknowledged for providing the water quality dataset used and Dr Milindi Sibomana for proofreading.
REFERENCES
ABSALON D, RUMAN M, MATYSIK M, KOZIOŁ K and POLKOWSKA Ż (2014) Innovative solutions in surface water quality monitoring. APCBEE Procedia 10 (0) 26-30. https://doi.org/10.1016/j.apcbee.2014.10.009 [ Links ]
ABTAHI M, GOLCHINPOUR N, YAGHMAEIAN K, RAFIEE M, JAHANGIRI-RAD M, KEYANI A and SAEEDI R (2015) A modified drinking water quality index (DWQI) for assessing drinking source water quality in rural communities of Khuzestan Province, Iran. Ecol. Indic. 53 (0) 283-291. https://doi.org/10.1016/j.ecolind.2015.02.009 [ Links ]
ALLAM A, FLEIFLE A, TAWFIK A, YOSHIMURA C and EL-SAADI A (2015) A simulation-based suitability index of the quality and quantity of agricultural drainage water for reuse in irrigation. Sci. Total Environ. 536 79-90. https://doi.org/10.1016/j.scitotenv.2015.07.029 [ Links ]
BIEROZA MZ and HEATHWAITE AL (2015) Seasonal variation in phosphorus concentration-discharge hysteresis inferred from high-frequency in situ monitoring. J. Hydrol. 524 333-347. https://doi.org/10.1016/j.jhydrol.2015.02.036 [ Links ]
BOYACIOGLU H (2006) Development of a water quality index based on a European classification scheme. Water SA 33 (1)101-106. [ Links ]
BOYACIOGLU H (2010) Utilization of the water quality index method as a classification tool. Environ. Monit. Assess. 167 115-124. https://doi.org/10.1007/s10661-009-1035-1 [ Links ]
BREEN C (1983) Limnology of Lake Midmar. Report No.78, South African National Scientific Programmes (SANSP), South Africa. 181 pp. [ Links ]
CCME (CANADIAN COUNCIL OF MINISTERS OF THE ENVIRONMENT) (1999) Recreational water quality guidelines and aesthetics. In: Canadian Environmental Quality Guidelines. CCME, Winnipeg. [ Links ]
CCME (CANADIAN COUNCIL OF MINISTERS OF THE ENVIRONMENT) (2001a) Canadian Water Quality Guidelines for the Protection of Aquatic Life: CCME Water Quality Index 1.0 Technical Report. In: Canadian Environmental Quality Guidelines. CCME, Winnipeg. [ Links ]
CCME (CANADIAN COUNCIL OF MINISTERS OF THE ENVIRONMENT) (2001b) Canadian Water Quality Guidelines for the Protection of Aquatic Life: CCME Water Quality Index 1.0 User's Manual. In: Canadian Environmental Quality Guidelines. CCME, Winnipeg. [ Links ]
CCME (CANADIAN COUNCIL OF MINISTERS OF THE ENVIRONMENT) (2006) A sensitivity analysis of the Canadian water quality index. Report No. PN 1355, Ontario, Canada. 38 pp. [ Links ]
CHANG C-L, LIN Y-T and CHIUEH P-T (2014) Single criterion and multiple criteria analysis: a comparison of water quality monitoring designs for a river system. Water Resour. Manage. 28 (3) 645-655. https://doi.org/10.1007/s11269-013-0505-y [ Links ]
CHILUNDO M, KELDERMAN P and O´KEEFFE JH (2008) Design of a water quality monitoring network for the Limpopo River Basin in Mozambique. Phys. Chem. Earth Parts A/B/C 33 (8-13) 655-665. https://doi.org/10.1016/j.pce.2008.06.055 [ Links ]
COETZEE JA and HILL MP (2012) The role of eutrophication in the biological control of water hyacinth, Eichhornia crassipes, in South Africa. BioControl 57 (2) 247-261. https://doi.org/10.1007/s10526-011-9426-y [ Links ]
CSIR (COUNCIL FOR SCIENTIFIC AND INDUSTRIAL RESEARCH) (2010) A CSIR perspective on water in South Africa-2010. Report No. CSIR/NRE/PW/IR/2011/0012/A, South Africa. [ Links ]
CUDE CG (2001) Oregon Water Quality Index a tool for evaluating water quality management effectiveness. J. Am. Water Resour. Assoc. 37 (1) 125-137. https://doi.org/10.1111/j.1752-1688.2001.tb05480.x [ Links ]
DABROWSKI J, BRUTON S, DENT M, GRAHAM M, HILL T, MURRAY K, RIVERS-MOORE N and DEVENTER, HV (2013) Linking land use to water quality for effective water resource and ecosystem management. WRC Report No. 1984/1/13. Water Research Commission, Pretoria. [ Links ]
DEA (DEPARTMENT OF ENVIRONMENTAL AFFAIRS) (2012) South African Water Quality Guideline for Coastal Marine Waters: Guidelines for Recreational Use, Vol. 2. DEA, Pretoria. 92 pp. [ Links ]
DWAF(DEPARTMENT OF WATER AFFAIRS AND FORESTRY) (1996a) South African Water Quality Guidelines, (2nd edn.), Vol. 2: Recreational Water Use. DWAF, Pretoria. 92 pp. [ Links ]
DWAF (DEPARTMENT OF WATER AFFAIRS AND FORESTRY) (1996b) South African Water Quality Guidelines (1st edn.), Vol. 7: Aquatic Ecosystems. DWAF, Pretoria. 89 pp. [ Links ]
DWAF (DEPARTMENT OF WATER AFFAIRS AND FORESTRY) (2003) Mvoti to Umzimkulu Water Management Area: overview of water resources availability and utilisation. Report No. PWMA11/000/00/0203. DWAF, Pretoria. 40 pp. [ Links ]
DWAF (DEPARTMENT OF WATER AFFAIRS AND FORESTRY) (2004) National Water Resource Strategy, (1st edn.. DWAF, Pretoria. 271 pp. [ Links ]
EFFENDI H, ROMANTO and WARDIATNO Y (2015) Water quality status of Ciambulawung River, Banten Province, based on pollution index and NSF-WQI. Procedia Environ. Sci. 24 228-237. [ Links ]
GAKUBA E, MOODLEY B, NDUNGU P and BIRUNGI G (2015) Occurrence and significance of polychlorinated biphenyls in water, sediment pore water and surface sediments of Umgeni River, KwaZulu-Natal, South Africa. Environ. Monit. Assess. 187 (9) 1-14. https://doi.org/10.1007/s10661-015-4790-1 [ Links ]
GRAHAM PM (2004) Modelling the water quality in dams within the Umgeni Water operational area with emphasis on algal relations. PhD thesis, North West University, South Africa. [ Links ]
GROUNDTRUTH (2012) Upper uMngeni Integrated Catchment Management Plan: Investigation of water quality drivers and trends, identification of impacting land use activities, and management and monitoring requirements. Report No. GT0165-0812. GroundTruth, Hilton, South Africa. [ Links ]
HC (HEALTH CANADA) (2012) Guidelines for Canadian recreational water quality (3rd edn.). Report No. H129-15/2012E. Healthy Environments and Consumer Safety Branch, Ottawa. [ Links ]
HAY D (2017). Our water our future: securing the water resources of the Umgeni River Basin. Handbook, Institute of Natural Resources, South Africa. [ Links ]
HODGSON K (2016) Personal communication, 15 January 2016. Kim Hodgson, Umgeni Water, Pietermaritzburg, KwaZulu-Natal Province, South Africa, 3201. [ Links ]
HUDSON N, PILLAY, M and TERRY, S (1993) Nutrient and bacteriological pollution loads in the Umgeni River system: impact on water quality and implication for resource management. Umgeni Water, Pietermaritzburg, South Africa. [ Links ]
HURLEY T, SADIQ R and MAZUMDER A (2012) Adaptation and evaluation of the Canadian Council of Ministers of the Environment Water Quality Index (CCME WQI) for use as an effective tool to characterize drinking source water quality. Water Res. 46 (11) 3544-3552. https://doi.org/10.1016/j.watres.2012.03.061 [ Links ]
IP WC, HU BQ, WONG H and XIA J (2009). Applications of grey relational method to river environment quality evaluation in China. J. Hydrol. 379 (3-4) 284-290. https://doi.org/10.1016/j.jhydrol.2009.10.013 [ Links ]
JEWITT G (2002) Can Integrated Water Resources Management sustain the provision of ecosystem goods and services? Phys. Chem. Earth Parts A/B/C 27 (11-22) 887-895. https://doi.org/10.1016/S1474-7065(02)00091-8 [ Links ]
JEWITT G, ZUNCKEL K, DINI J, HUGHES C, DE WINNAAR G, MANDER M, HAY D, PRINGLE C, MCCOSH J and BREDIN I (2015) Investing in ecological infrastructure to enhance water security in the uMngeni River catchment. Report No.1, Green Economy Research , Green Fund, Development Bank of Southern Africa, Midrand, South Africa. [ Links ]
KHAN AA, TOBIN A, PATERSON R, KHAN H and WARREN R (2005) Application of CCME procedures for deriving site-specific water quality guidelines for the CCME water quality index. Water Qual. Res. J. Can. 40 (4) 448-456. https://doi.org/10.2166/wqrj.2005.047 [ Links ]
KIENZLE SW, LORENTZ SA and SCHULZE RE (1997) Hydrology and water quality of the Mgeni Catchment. WRC Report No. TT87/97. Water Research Commission, Pretoria. [ Links ]
KUMAR P and SAROJ DP (2014) Water-energy-pollution nexus for growing cities. Urban Clim. 10, Part 5 (0) 846-853. https://doi.org/10.1016/j.uclim.2014.07.004 [ Links ]
LESSELS JS and BISHOP TFA (2015) A simulation based approach to quantify the difference between event-based and routine water quality monitoring schemes. J. Hydrol. Reg. Stud. 4 439-451. https://doi.org/10.1016/j.ejrh.2015.06.020 [ Links ]
LIN J, GANESH A and SINGH M (2012) Microbial pathogens in the Umgeni River, South Africa. WRC Report No. KV303/12. Water Research Commission, Pretoria. [ Links ]
LIU S, CROSSMAN ND, NOLAN M and GHIRMAY H (2013) Bringing ecosystem services into integrated water resources management. J. Environ. Manage. 129 92-102. https://doi.org/10.1016/j.jenvman.2013.06.047 [ Links ]
LOFTIS JC and WARD RC (1980) Water quality monitoring-some practical sampling frequency considerations. Environ. Manage. 4 (6) 521-526. https://doi.org/10.1007/BF01876889 [ Links ]
LUMB A, HALLIWELL D and SHARMA T (2006) Application of CCME water quality index to monitor water quality: a case of the Mackenzie River basin, Canada. Environ. Monit. Assess. 113 411-429. https://doi.org/10.1007/s10661-005-9092-6 [ Links ]
MAAVARA T, PARSONS CT, RIDENOUR C, STOJANOVIC S, DÜRR HH, POWLEY HR and VAN CAPPELLEN P (2015) Global phosphorus retention by river damming. Proc. Natl. Acad. Sci. 112 (51) 15603-15608. https://doi.org/10.1073/pnas.1511797112 [ Links ]
MANICKUM T, JOHN W, TERRY S and HODGSON K (2014) Preliminary study on the radiological and physicochemical quality of the Umgeni Water catchments and drinking water sources in KwaZulu-Natal, South Africa. J. Environ. Radioact. 137 (0) 227-240. https://doi.org/10.1016/j.jenvrad.2014.07.015 [ Links ]
MATONGO S, BIRUNGI G, MOODLEY B and NDUNGU P (2015) Pharmaceutical residues in water and sediment of Msunduzi River, KwaZulu-Natal, South Africa. Chemosphere 134 133-140. https://doi.org/10.1016/j.chemosphere.2015.03.093 [ Links ]
MATTHEWS, MW (2014) Eutrophication and cyanobacterial blooms in South African inland waters: 10 years of MERIS observations. Remote Sens. Environ. 155 (0) 161-177. https://doi.org/10.1016/j.rse.2014.08.010 [ Links ]
MURPHY K, HEERY B, SULLIVAN T, ZHANG D, PALUDETTI L, LAU KT, DIAMOND D, COSTA E, O'CONNOR N and REGAN F (2015) A low-cost autonomous optical sensor for water quality monitoring. Talanta 132 520-527. https://doi.org/10.1016/j.talanta.2014.09.045 [ Links ]
NAMUGIZE JN, JEWITT G and GRAHAM M (2018) Effects of land use and land cover changes on water quality in the uMngeni River Catchment, South Africa. Phys. Chem. Earth Parts ABC. 105 247-264. https://doi.org/10.1016/j.pce.2018.03.013 [ Links ]
NGUBANE S (2016) Assessing spatial and temporal variations in water quality of the upper uMngeni Catchment, KwaZulu-Natal, South Africa: 1989-2015. MSc thesis, University of KwaZulu-Natal. [ Links ]
OLANIRAN A, NAICKER K and PILLAY B (2014) Assessment of physico-chemical qualities and heavy metal concentrations of Umgeni and Umdloti Rivers in Durban, South Africa. Environ. Monit. Assess. 186 (4) 2629-2639. https://doi.org/10.1007/s10661-013-3566-8 [ Links ]
QUAYLE LM, DICKENS CWS, GRAHAM M, SIMPSON D, GOLIGER A, DICKENS JK, FREESE S and BLIGNAUT J (2010) Investigation of the positive and negative consequences associated with the introduction of zero-phosphate detergents into South Africa. WRC Report No. TT446/10. Water Research Commission, Pretoria. [ Links ]
RANGETI I (2014) Determinants of key drivers for potable water treatment cost in uMngeni Basin. MTech thesis, Durban University of Technology, Durban. [ Links ]
RICKWOOD CJ and CARR GM (2009) Development and sensitivity analysis of a global drinking water quality index. Environ. Monit. Assess. 156 (1-4) 73-90. https://doi.org/10.1007/s10661-008-0464-6 [ Links ]
ROIG B, VALAT C, ALLAN IJ, GREENWOOD R, BERHO C, GUIGUES N, MILLS GA and ULITZUR N (2007) The use of field studies to establish the performance of a range of tools for monitoring water quality. TrAC Trends Anal. Chem. 26 (4) 274-282. https://doi.org/10.1016/j.trac.2007.02.005 [ Links ]
SREBOTNJAK T, CARR G, DE SHERBININ A and RICKWOOD C (2012) A global water quality index and hot-deck imputation of missing data. Ecol. Indic. 17 (0) 108-119. https://doi.org/10.1016/j.ecolind.2011.04.023 [ Links ]
TATE KW, DAHLGREN RA, SINGER MJ, ALLEN-DIAZ B and ATWIL ER (1999) Timing, frequency of sampling affect accuracy of water quality monitoring. Calif. Agric. 53 (6) 44-48. https://doi.org/10.3733/ca.v053n06p44 [ Links ]
TAYLOR, J, MSOMI, L and TAYLOR, L (2016) RCE KwaZulu-Natal: Shiyabazali Settlement: water quality monitoring and community involvement. URL: http://citeseerx.ist.psu.edu/viewdoc/download?doi=10.1.1.389.9140&rep=rep1&type=pdf#page=95 (Accessed 30 June 2016). [ Links ]
TERRADO M, BARCELÓ D, TAULER R, BORRELL E, CAMPOS SD and BARCELÓ D (2010) Surface water quality indices for the analysis of data generated by automated sampling networks. TrAC Trends Anal. Chem. 29 (1) 40-52. https://doi.org/10.1016/j.trac.2009.10.001 [ Links ]
THWALA WD (2010) Community participation is a necessity for project success: A case study of rural water supply project in Jeppes Reef, South Africa. Afr. J. Agric. Res. 5 (10) 970-979. [ Links ]
UNEP-GEMS/WATER (2007) Global drinking water quality index development and sensitivity analysis report. United Nations Environment Programme Global Environment Monitoring System/Water Programe, Ontario, Canada. [ Links ]
UNEP-GEMS/WATER (2008) Water quality for ecosystem and human health. United Nations Environment Programme Global Environment Monitoring System (GEMS)/Water Programme, (2nd edn), Ontario, Canada. [ Links ]
UNEP (2010) Clearing the waters: A focus on water quality solutions. United Nations Environment Programme (UNEP), Nairobi, Kenya. [ Links ]
UW (2013) Infrastructure Master Plan 2013, 2013/2014-2043/2044. Umgeni Water (UW), Pietermaritzburg, South Africa. [ Links ]
VAN GINKEL CE (2011) Eutrophication: present reality and future challenges for South Africa. Water SA 37 (5) 693-701. https://doi.org/10.4314/wsa.v37i5.6 [ Links ]
VILLIERS SD and THIART C (2007) The nutrient status of South African rivers: concentrations, trends and fluxes from the 1970s to 2005. S. Afr. J. Sci. 103 (7-8) 343-349. [ Links ]
WANG Y, WILSON JM and VANBRIESEN JM (2015) The effect of sampling strategies on assessment of water quality criteria attainment. J. Environ. Manage. 154 (0) 33-39. https://doi.org/10.1016/j.jenvman.2015.02.019 [ Links ]
ZHAO Y, SHARMA A, SIVAKUMAR B, MARSHALL L, WANG P and JIANG J (2014) A Bayesian method for multi-pollution source water quality model and seasonal water quality management in river segments. Environ. Modell. Software 57 (0) 216-226. https://doi.org/10.1016/j.envsoft.2014.03.005 [ Links ]
Received 3 April 2017
Accepted in revised form 20 August 2018
* To whom all correspondence should be addressed. +250788834229; e-mail: najoannes@yahoo.fr, jeannamugize@gmail.com

