


Serviços Personalizados
Artigo
 Inglês (pdf)
 Artigo em XML
 Referências do artigo
Indicadores

Links relacionados
-
 Citado por Google
 -
 Similares em Google
Compartilhar

 Permalink
Water SA
versão On-line ISSN 1816-7950
versão impressa ISSN 0378-4738
Water SA vol.44 no.3 Pretoria Jul. 2018
http://dx.doi.org/10.4314/wsa.v44i3.14
ORIGINAL ARTICLES
Economic risks due to declining water quality in the Breede River catchment
James DS CullisI, *; Nico RossouwI; Geoff du ToitI; Daniel PetrieI; Gideon WolfaardtII; Willem de ClercqII; Annabel HornIII
IAurecon South Africa, Pty (Ltd), South Africa
IIStellenbosch University Water Institute (SUWI), Stellenbosch University, Stellenbosch, South Africa
IIIDepartment of Environmental Affairs and Development Planning, Western Cape Government, South Africa
ABSTRACT
Water is a critical resource necessary to support social and economic development. Economic growth and, in particular, the growth of urban and peri-urban areas, however results in declining water quality which threatens water-dependent industries. In developing countries this is a particular concern due to the rapid rate of urbanisation and the limited financial resources and technical capabilities to adequately maintain and upgrade wastewater treatment works. This is particularly relevant in catchments with a high dependence on export-orientated agriculture. This study considered water quality risks in the Breede River catchment as an area which experiences significant urban and peri-urban growth, focusing on economic risks associated with declining water quality, estimates of the costs needed to rehabilitate existing wastewater treatment works, and alternative strategies such as the use of artificial wetlands, the rehabilitation and protection of natural wetlands, as well as the clearing of invasive alien plants. A major conclusion is that the financial risk associated with a declining economy and social instability outweighs the costs that will be needed for rehabilitation of existing treatment plants. Together with more pronounced fluctuations in precipitation anticipated with climate change, these risks due to declining water quality are likely to increase in future with continued urban and peri-urban growth.
Keywords: economics, development, water quality, pollution risks, waste water treatment works
INTRODUCTION
Water resource procurement is globally an essential factor for socio-economic and urban development. Often directly linked to urbanisation (Bobylev et al., 2016), water availability and quality are often compromised when natural land along streams is converted to other land uses, including agriculture, urban-industrial, and pasture. Water quality deteriorates through soil erosion, fertiliser run-off, disposal of waste from urban-industrial and domestic activities (Bai et al., 2013; Xue, 2015).
Failure to incorporate water quality value in water management and infrastructure planning lessens the ability of decision makers to respond to the increasing social and economic risks associated with poor water quality. Municipalities in the developing, and often also in the developed world, have been struggling to provide basic services including the provision of water for basic use such as drinking and cooking, and sanitation services. This is particularly severe in areas with rapidly growing informal settlements and peri-urban developments.
Poor maintenance of existing water and wastewater treatment infrastructure, particularly in the poorer, rural and peri-urban areas, aggravates the situation. These present a substantial water quality risk with social, financial and economic implications for the populations and industries dependent on the water resources. An appreciation of the economic trade-offs between declining investments in water and wastewater treatment infrastructure, and the increasing social and economic risks from declining water quality standards, is required.
Water quality management is complex due to the multiplicity of polluters involved and the pollution characteristics (Mariona, 2012). According to Perry and Vanderklein (1996), effective water quality planning and policy entails the following: (i) water quality goals, which provide an understanding of the state of water resources; (ii) potential to deliver the desired ecosystem services; and (iii) the suitable physical and institutional approaches to achieve the desired goals. Policy instruments that are effective and efficient solutions to deal with water quality problems need to consider the pollution impact based on the pollution and context characteristics (Sterner, 2003). A diagnostic understanding of environmental problems within their social-ecological systems context is therefore a necessary condition of effective policy design (Cox, 2011). Hence, understanding the risks associated with water quality in the face of urbanisation is essential to support investment priorities to improve water quality. Zhao et al. (2014) noted the difficulty of managing pollution across a catchment where multiple municipalities are involved and pollution control measures have been set by a higher authority. For market-based pollution tools to be effective, these authors allege that there is a need for cost differentiation between municipal sewage and industry effluent management, and between different local authorities. Added to this is the fact that many catchments, particularly in the developing world, are experiencing rapid rates of urbanisation that exceed the municipalities' ability to build and maintain a formal sanitation network.
Up to a point, the receiving environment, such as a river, can provide ecosystem services by reducing the pollution loads through a combination of dilution and ecological processes. However, as populations continue to grow the water quality risk increases rapidly, not only because of an increasing pollution load, but also because of the associated increasing demands for water, which reduces the potential for dilution as well as the degradation of critical ecological infrastructure such as wetlands, riparian vegetation and buffer strips, and the increasing non-point-source pollution loads from urban and peri-urban developments with poorly designed roads and drainage systems.
The social and economic risks due to declining water quality increase with population growth and economic development. Finding cost-effective, timely and appropriate solutions that address these risks is therefore critical.
This study had three lines of investigation. The first was to assess the economic value of a river catchment that is potentially at risk due to declining water quality. The second was to evaluate measured readings of the water quality in the area to identify critical water quality risks. The third was to seek potential solutions to the financial risk and economic devaluation by finding and costing appropriate infrastructure and ecological solutions to mitigate the water quality problems. This was done in view of social, economic and environmental risks associated with rapid urbanisation that continues to outpace the ability to provide critical water-related infrastructure, and the need for solutions to these challenges.
The Breede River catchment in South Africa was selected for this study as it represents an area with potential for rapid growth in urban and peri-urban development, as well as potential for significant water quality risks, particularly with regards to the high dependency on export-orientated irrigated agriculture and tourism. The challenges observed in this catchment are not unique and thus serve as a good model to assess this global challenge.
APPROACH
Description of the study area
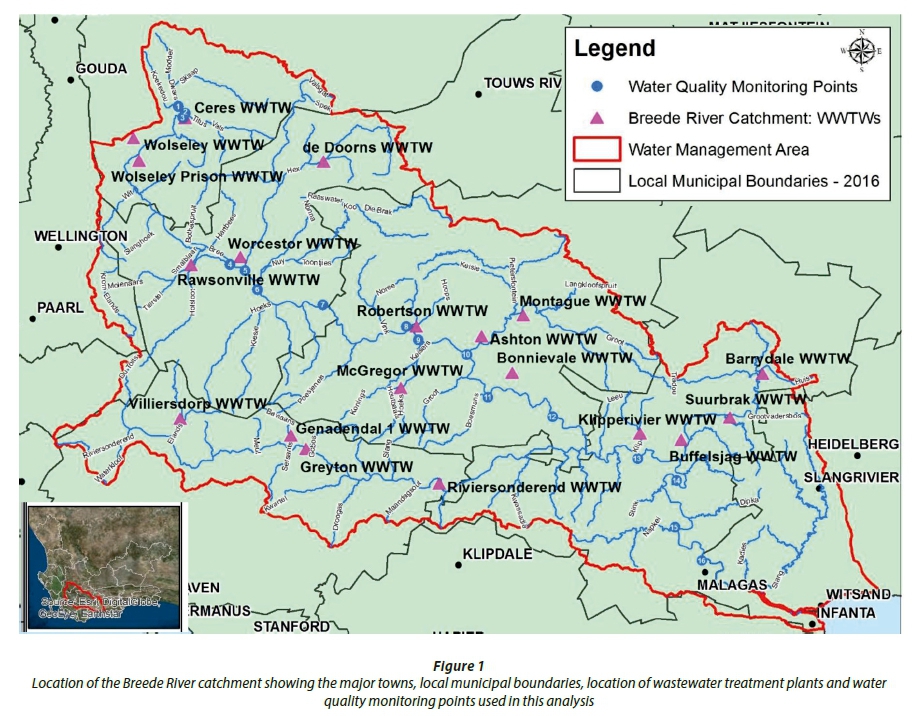
The Breede River catchment is located in the Western Cape Province of South Africa (Fig. 1,) and is home to approximately 300 000 people (StatsSA, 2011). The largest town in the catchment is Worcester with a population of approximately 100 000 in 2011 (StatsSA, 2011).
The average annual growth rate in the catchment between the 2001 census and the 2011 census was 2%, varying notably between towns due to different economic drivers. In addition, there has been significant growth in informal or peri-urban areas that is not captured in the official census figure but can be detected with other means, such as spot building counts (SBC) (Eskom, 2016). This has resulted in a patchwork of growth areas with some increasing and some declining which will impact on the need for improved wastewater treatment works (WWTW) and the associated water quality risks.
The Breede River has its source in the Cape Fold Mountains near the town of Ceres and discharges into the sea near the town of Infanta. The catchment is divided into upper, middle and lower subareas. Major tributaries including the Hex River near De Doorns, which joins the Breede just upstream of the town of Worcester, the Riviersonderend River, and the Buffelsjags River which joins the Breede River just downstream of the town of Swellendam.
Intensive agriculture and urban development has resulted in an array of water quality problems in the Breede River (DWA, 2010). These include concerns about increased salinity, nutrient enrichment, microbiological water quality, agrochemicals, and impacts on dissolved oxygen. In general, water quality in the headwaters of the Breede River, and many of its tributaries, is good, but becomes progressively poorer in a downstream direction due to water abstractions and irrigation return flows entering the rivers. The recent rapid growth in urban and particularly peri-urban areas is of especial concern for water quality impacts.
There are a total of 18 wastewater treatment works (WWTW) located in the Breede River catchment, which service a large proportion of the population (Fig. 1). With the rapid rate of urbanisation that has been experienced in the catchment, the ability of these WWTWs to accommodate the increasing loads is a significant concern, particularly given the many challenges faced by local municipalities due to financial constraints for maintenance and shortage of technical skills.
Agriculture is the dominant economic driver and largest water use sector in the catchment, accounting for approximately 87% of the average annual water demand. Municipal use accounts for only 5% of the total demand, with less than 1% of rural use and the remaining 7% exported to other catchments (DWAF, 2004). There is no significant demand for water for power generation or for large industries in this catchment, although some water is used for industries located within urban areas (DWAF, 2004).
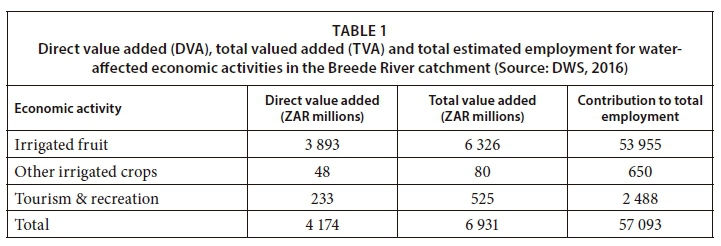
A recent study of the Breede River catchment (DWS, 2016) estimated the direct value added (DVA) and total value added (TVA), i.e., taking account of the multiplier effect of downstream industries, for water-dependent sectors (i.e. irrigation and tourism), to be around ZAR4 billion and 7 billion, respectively, and impacting around 57 000 jobs (Table 1).
Identification of key water quality risks
Water quality risks were identified based on observed data for a range of water quality parameters at various sites in the catchment and compared to guidelines for acceptable water quality standards for different types of water use, e.g., for domestic consumption, for irrigation and industrial use, or for recreation. Water quality data were obtained from the Breede-Gouritz Catchment Management Agency (BGCMA), which has been monitoring water quality at a number of sampling points since about 2010. The BGCMA has 23 water quality sampling points along the main stem Breede River extending from Ceres in the upper reaches to Malgas, just upstream of the start of the Breede River estuary.
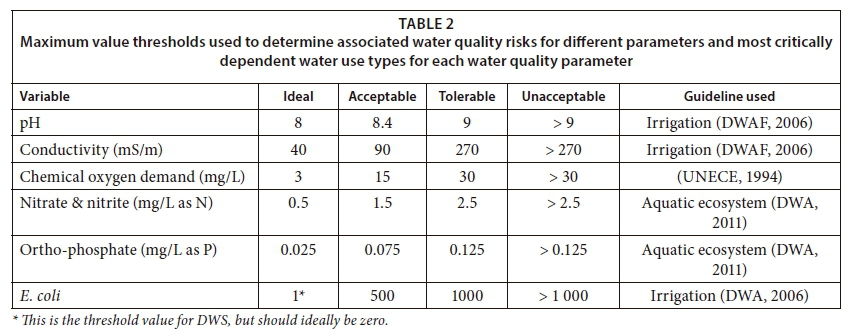
Monthly water samples are analysed for pH, electrical conductivity, sodium, total suspended solids, ammonia, nitrate & nitrite, chemical oxygen demand, ortho-phosphate, faecal coliforms, E. coli, faecal streptococci, turbidity, potassium, and total dissolved solids. The fitness-for-use for irrigation water supply and aquatic ecosystem health were described by calculating the median, 75th percentile, and 95th percentile for selected water quality constituents for all observed data between 2010 and 2015, and compared to water quality guidelines for the critical parameters and use types shown in Table 2.
Current condition and provisional costs of rehabilitation of WWTW
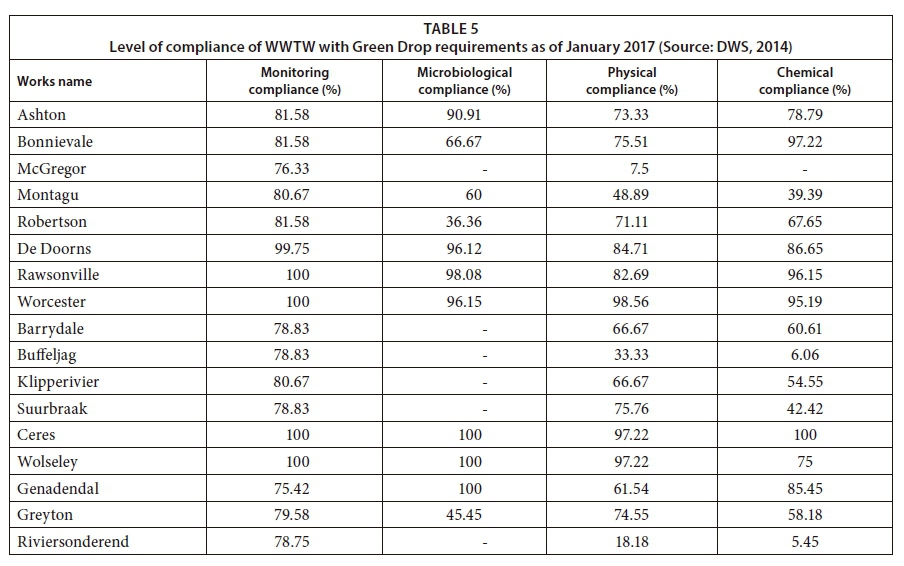
The level of compliance for WWTWs in South Africa is monitored by the Department of Water and Sanitation (DWS) by way of the annual Green Drop Report (http://www.dwaf.gov.za/Dir_WS/GDS/), which provides a cumulative risk rating (CRR) and level of compliance for each WWTW. The level of compliance is determined in terms of (i) monitoring compliance, (ii) microbial compliance, (iii) physical compliance, and (iv) chemical compliance
As a first-order estimate of the costs of upgrades to the individual WWTW required to achieve compliance for the operations and discharge standards the following equation was used:
M = [R1 (1-C1) + R2 (1-C2) + R3 (1-C3) + R4 (1-C4)] × Qn
where:
M is the total cost of an upgrade to a WWTW
Q is the design flow of the WWTW (in ML/d)
C1, 2, 3 and 4 is the average percentage compliance in terms of monitoring, microbiological, physical and chemical characteristics, respectively
R1,2,3 and 4 is the specific cost of upgrading a 1 ML/d treatment works for monitoring, microbiological, physical and chemical characteristics, respectively
n is a corrective factor to allow for economies of scale for upgrades to larger plants (approximately 0.75)
The Green Drop data are not sufficiently detailed to evaluate how much each plant is over the required limit when it is non-compliant. However, at a high level it is possible to associate an intervention for each compliance category, namely: monitoring, microbial, physical and chemical. A cost can then be associated with each intervention derived from actual costs for the design and construction of WWTW in the region. It is important to note that detailed costs for the specific interventions needed to rehabilitate individual plants can only be determined once problems at each WWTW have been clearly identified and understood.
RESULTS
Water quality in the Breede River catchment
The percentile of compliance for representative monitoring locations along the main stem of the Breede River is presented in Table 3 for selected water quality parameters, whether ideal, acceptable, tolerable, or unacceptable compared to the standards required for different water use sectors. Of notable concern are the high levels of phosphorus along the full length of the river, and the high levels of chemical oxygen demand (COD) above the 75th percentile at many points along the river.
Nitrogen levels are also of concern, but these concentrations appear to decrease downstream of Worcester only to spike again at Robertson. This may be an indication of improved return flows from the Worcester WWTW, but poor-quality return flows from the Robertson WWTW and non-point-source pollution impacts due to a concentration of peri-urban and informal development in the area. Nitrogen levels improve significantly in the lower part of the catchment, most likely due to removal by natural processes down the river continuum.
Salinity levels are generally acceptable, but do decline in a downstream direction as would be expected, particularly as salinity levels are very carefully managed through the use of freshwater releases from Brandvlei Dam. The current risks from E. coli appear to be minimal, with the possible exception of a low probability of unacceptable levels around Ceres.
Current conditions for WWTW compliance
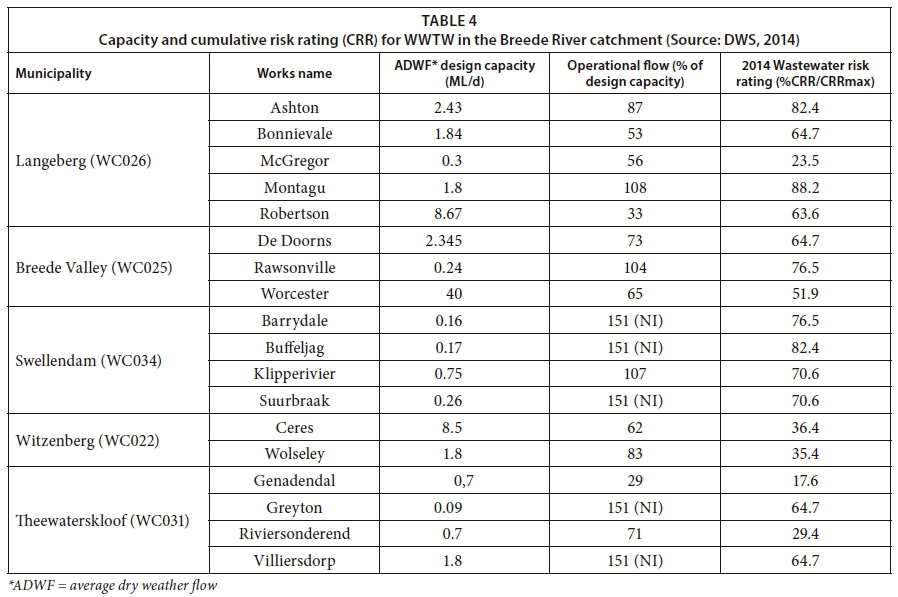
The latest available Green Drop summary for the Breede River catchment was for 2014 (Table 4) and shows a number of the plants operating at well below their design capacity (e.g. Robertson and Genadendal) while others are over capacity (e.g. Montague, Klipperivier and Rawsonville) (DWS, 2014). The plants with the highest risk rating are Montagu, Buffelsjag and Ashton, while Genadendal, McGregor and Riviersonderend had the lowest risk rating. The level of compliance with regards to monitoring, physical, microbial and chemical criteria for each plant over the preceding 12 months is shown in Table 5. The different plants achieved different levels of compliance in the critical areas identified. In general, compliance with regards to microbiological parameters appears to be good while there are concerns with regards to physical compliance at a number of the plants. Overall, Worcester, Ceres and Wolseley appear to the have the best level of compliance across all metrics. Key areas of concern from this assessment are the low levels of compliance with microbial standards at Robertson, physical compliance at Riviersonderend and McGregor, and chemical compliance at Buffelsjag and Riviersonderend.
Estimates of the costs for rehabilitation of WWTW
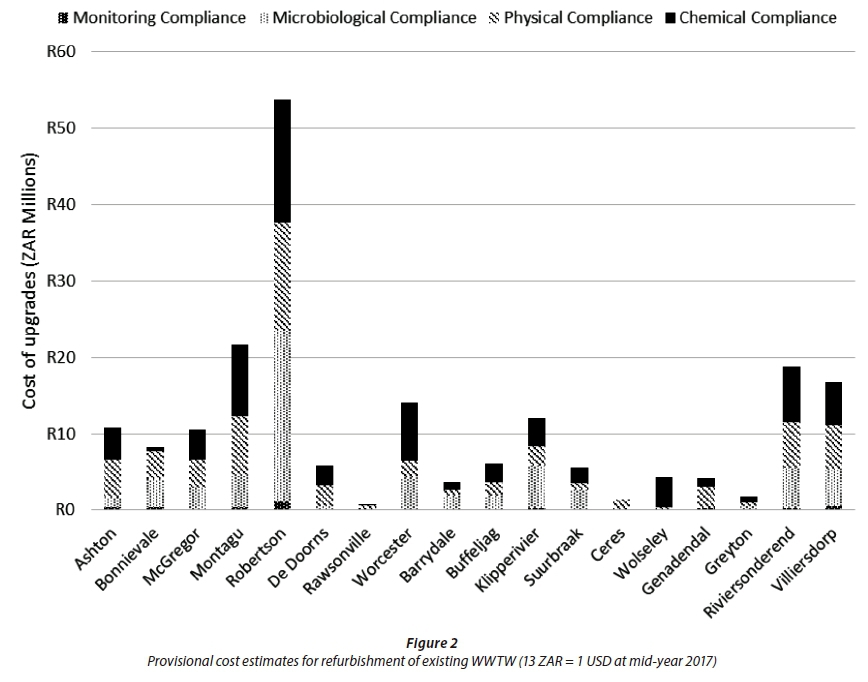
The cost of upgrading monitoring infrastructure for a 1ML/d plant (R1 in Eq. 1) was estimated as ZAR1.17 million based on the real costs for construction of WWTW in the region. The specific costs of upgrading the individual components of the WWTW related to microbial treatment infrastructure (R2), physical treatment infrastructure (R3) and chemical treatment infrastructure (R4) for a 1 ML/d plant were estimated at ZAR7.00 million, ZAR9.59 million and ZAR9.87 million, respectively. The estimated costs for rehabilitation for the individual WWTWs (Fig. 2) range from approximately ZAR1 million for the rehabilitation of the Rawsonville WWTW to over ZAR54 million for the rehabilitation of the much larger Robertson WWTW. The total cost to rehabilitate all existing WWTW in the catchment is around ZAR200 million.
DISCUSSION
Economic risks associated with declining water quality standards
Agriculture is an important contributor to the economy of South Africa, especially in the Western Cape Province. A recent Provincial Economic Review and Outlook (Western Cape Government Provincial Treasury, 2014 p. 9) states that 'The agricultural sector is likely to remain a pillar in the Western Cape economy, especially in rural areas. However, the sector is subject to key risks, which could dampen short term growth and undermine the longer term potential of the sector. These risks include a lack of clean water sources, climate change and pressure on profitability, land reform policies and crime.' Furthermore, 'The Western Cape sectors are directly exposed to environmental risks and scarcities such as water shortages and droughts. These factors affect the resilience of sector growth and employment creation prospects, specifically in the agriculture and tourism sectors.' The relative success of the agriculture sector in the Breede River catchment has resulted in increasing population growth as people migrated into the region in search of employment. Much of this growth has occurred outside of the formally serviced areas putting additional pressure on the existing infrastructure and thereby contributing to the potential for significant deterioration in the water quality upon which the success of the sector is critically dependent. Addressing these threats is therefore critical for ensuring the sustainability of the sector and its contribution to the economy.
Declining yields due to increased salinity
Salinization of irrigation water is a major contributing factor to soil degradation, which directly affects commercial and subsistence agriculture (and hence food production) (Aihoon et al., 1997; Armour, 2007). The economic impacts of increasing salinity can be determined in terms of expected decreases in production value of various crop types (De Lange et al., 2012). For instance, the estimated contribution by irrigated fruit in the Breede catchment is around ZAR 6 billion. (Table 1). A 10% drop in yields of grapes and stone fruit, which are the dominant produce, if salinity levels exceed their critical thresholds will reduce economic output by ZAR 600 million per year.
Salinity in the Breede River is managed through releases made from Brandvlei Dam. With increasing upstream demands, particularly from the growing urban population, as well as increasing irrigation demands and potential future reduction in streamflow due to climate change, it may become harder to manage these salinity levels through the release of additional water from the dam. This could lead to a significant increase in salinity levels and an associated reduction in crop yields in the lower Breede River area. It is therefore critical to improve the efficiency of the management of the system and find other ways for managing the salinity levels in the river that do not rely on substantial additional releases.
Increasing maintenance costs due to increasing filamentous algae
High levels of nutrient levels, particularly phosphorus, are a major concern along the Breede River (Table 3). These have already resulted in concerns about algal blooms and excessive submerged plant growth under low flow conditions in the Middle Breede River. A significant contributing factor to this is the return flows from WWTW, but also non-point-source impacts due to agriculture and urban and peri-urban developments.
A concern with increasing nutrient levels is the potential for eutrophication and increased growth in filamentous algae. Although the growth of filamentous algae requires a combination of factors in addition to increasing nutrient levels (Oberholster et al., 2013), and does not have a direct impact on crop production, it could result in significant economic costs due to the need to clean filters and other components of irrigation systems that get blocked (De Lange, 2014). These costs have been estimated to be at about ZAR 1 887 per hectare per year (De Lange, 2016). Applied to the estimated total 70 000 ha of irrigated crops in the Breede River catchment, this could result in an additional cost of around ZAR132 million per year.
Risks to international markets due to water quality concerns
The agriculture sector in the Western Cape Province is a significant contributor to international exports, particularly to Europe and the United Kingdom. This brings with it an added risk due to declining water quality, which may not meet the high standards set for irrigation water by these international markets (Oberholster and Botha, 2014). This has been identified as a critical risk, particularly in the Berg River catchment, which is similarly dependent on the export market and experiences similar water quality risks as the Breede River catchment (Britz et al., 2007). In response to reports of potential risk of microbial pollution during the 2004-2005 season, it was estimated that a closure of related export markets due to failing to meet the water quality standards could result in a loss of between ZAR190 and ZAR570 million (Louw, 2010). This would also likely impact on the jobs of around 14 291 permanent labourers and 16 680 seasonal (permanent equivalent) labourers in the agriculture sector and associated industries (Louw, 2010).
Increasing human health risks
Poor water quality impacts human health leading to declining living standards and social well-being. Diseases linked with poor water quality such as cholera and some forms of diarrhoea, are contagious, and their costs affect the whole society (Sterner, 2003; Mokondoko et al., 2016; Tongesayi and Tongesayi, 2017), leading to higher health care costs.
Various studies have highlighted high public health costs associated with decreased water quality (Schwarzenbach et al., 2010), either as public health cost to mitigate spread of water quality related diseases, or individual costs in terms of visits to a doctor and time lost at work (Dasgupta, 2004; Clasen et al., 2007). A DWAF study (2001) estimated the cost of treatment for diarrhoea incidents which can be attributed primarily to poor quality water in the Olifants River catchment was around ZAR704 million per year, while the indirect cost was estimated to be around ZAR1 140 million per year for the study area (De Lange et al., 2012).
Direct human impacts however, are currently considered to be relatively limited in the Breede River catchment as river water is not used as a primary source for drinking water as most towns receive water directly from dams in the mountains or boreholes, with the population without access to a secure water supply being relatively low compared to other rural areas in South Africa. The risk is therefore limited to recreational contact. This may change in future and needs to be assessed, particularly if population growth in the region continues to outpace efforts to provide formal housing and adequate water and sanitation services.
Impacts on tourism, recreation and property values
Tourism, recreation and property values represent another area that could experience significant financial and economic risks due to declining water quality in the Breede River. A recent study, undertaken to determine Resource Quality Objectives (DWS, 2016), estimated the value of tourism in the Breede River catchment to be around ZAR1 640 million per year, of which approximately 54% or ZAR883 million could be attributed to the proximity to rivers, estuaries and wetlands. A significant portion of this sector of the economy could be directly at risk due to declining water quality, particularly associated with human health risks such as increasing E. coli concentrations or increased risk of eutrophication due to high nutrient loads that will result in foul odours and blocked river ways. Even a relatively small decline of 10% due to reduced water quality could therefore potentially have a significant financial and economic impact, in the region of around ZAR90 million per year.
Addressing the water quality risks associated with existing WWTW
The provisional cost of rehabilitating all the WWTW in the Breede River catchment to achieve compliance was estimated to be in the order of ZAR200 million. There is, however, significant variability due to the current status of the individual plants. A more detailed analysis of the specific constraints and limitations of each plant is required in order to determine a more accurate cost of rehabilitation that could then be compared to an estimate of the benefits of rehabilitation of individual plants with regards to reducing the direct financial and economic risks associated with deteriorating water quality. It is also important to note that the current capacity requirements are based on the formal census figures and estimates of demand, which is not necessarily a true reflection of demand, particularly in the light of the apparent increase in informal or peri-urban areas in the catchment. The ability to maintain the existing WWTW is also a significant concern given the current financial and human capacity constraints, particularly for smaller, rural municipalities in South Africa.
Urban and rural non-point-source pollution impacts
In addition to the potential water quality risks due to point sources of pollution, such as the return flows from WWTW, there are also non-point sources that contribute to declining water quality. These non-point sources are even more difficult to identify and monitor than the known point sources and correspondingly make the task of allocating costs for addressing these increasing water quality risks to individual contributors problematic (Pegram and Görgens, 2001). Greywater runoff from informal areas is of concern and considered to be a growing contributor to downstream water quality risks, particularly with regards to microbial concentrations and both total coliforms and E. coli concentrations (Maboze et al., 2013). This is a growing concern for water quality risks in South Africa and innovative solutions are required to ideally address the problem at source, or alternatively to provide both physical and ecological interventions to minimise impacts. In the Breede River, urban and peri-urban non-point-source pollution is considered to be relatively small as compared to agricultural non-point-source pollution, in terms of the overall catchment impacts (Cullis et al., 2005). However, given the recent increase in informal settlement growth in the Breede River catchment, particularly around the towns of Worcester and Robertson, these urban non-point-source pollution impacts are likely to increase water quality risks in the future.
New thinking and alternative technologies for WWTW
In addition to investing capital in refurbishments and maintenance of the existing sewer network and large-scale, centralised treatment works infrastructure, it is essential to consider alternatives that reimagine the urban water system to minimise generation of wastewater in the first place, or to consider more effective and appropriate treatment technologies, particularly given the financial and technical constraints of most municipalities.
Minimising wastewater generation should consider moving to dry sanitation (or composting toilets), incentivising greywater reuse by industry/agriculture, enforcing use of biodegradable detergents or re-visiting the tariff structure to discourage non-essential use of potable water. It may also be advantageous to explore alternative treatment technologies, such as passive (or 'ecological') treatment, novel processes for water, energy and nutrient recovery, as well as small-scale and decentralised 'treatatsource' systems.
The draft Water Quality Management Policy by the Department of Water and Sanitation (DWS, 2016) notes that clean technology supported by green economy initiatives and financing mechanisms provide targeted ways of reducing pollution at source. Research conducted into low-energy treatment technologies, involving sedimentation, anaerobic treatment, filtration, constructed wetlands, and using effluent for irrigation of trees, has shown that small-scale, decentralised treatment has a valuable role to play in improving the quality of run-off from distributed settlements (Buckley et al., 2002).
Recovery of nutrients from sewage sludge (as compost) or energy (either as biogas or biochar) has been demonstrated to offer additional value to the wastewater treatment process and ensures stabilisation of sludge and reduced risk of contamination of surface run-off and groundwater (Slamson, 2015; Boyd, 2009). These technologies have added benefits in terms of also reducing the carbon footprint for WWTW in support of climate change mitigation and reduced energy costs or providing additional income from the plant, thereby providing means to assist in overcoming the financial barriers that lead to poor WWTP performance.
The creation of artificial wetlands may offer towns without the specialized human capacity required to maintain technologically complex treatment infrastructure (which consequently fail to comply with effluent standards) an option that is less onerous in terms of maintenance and operations inputs. Such systems are therefore typically unable to guarantee effluent that is compliant for discharge to water courses. Despite this, constructed wetlands offer a simple method of reliably and significantly reducing point-source pollution loads to watercourses in terms of suspended solids, organics and some nutrients. Such systems are therefore viewed as 'appropriate' technologies that cannot be designed to guarantee compliance with standards, but which may be more likely to offer consistent performance over time, due to their inherent resilience against technology failure and neglected maintenance. Their successful implementation may therefore reduce the overall risk associated with declining standards at existing WWTW. This may, however, require changes to the effluent discharge standards as outputs are more variable and consideration needs to be given to the state of the receiving environment and associated downstream impacts.
Both natural and artificial wetlands play a significant role in alleviating water quality concerns, especially in terms of the removal of particles, sediments and nutrients. Wetlands also play a role in flood attenuation and as critical habitats for birds and other species that also have a direct economic impact in support of tourism and property values. The total equivalent treatment value for wetlands in the Breede River catchment has been valued at approximately ZAR328 million (Turpie et al., 2010). The protection and rehabilitation of wetlands is therefore of critical importance with regards to reducing the financial and economic risks associated with deteriorating water quality and is a major motivating factor for the Working for Wetlands programme (Department of Environmental Affairs).
CONCLUSION
With the population in the Breede River catchment expected to continue to increase, the financial and economic risks associated with declining water quality will also increase. These risks are exaggerated by the likely increased water demands and reduced streamflow due to climate change. The results of this study show that the costs for rehabilitation of the existing treatment plants in the Breede catchment to meet the required standards would be around ZAR200 million. Nevertheless, compared with the economic risks associated with a failure to maintain these standards, this is a relatively small cost. For example, the additional cost of maintenance for irrigation systems due to an increase in fouling algal blooms due to high nutrient levels was estimated to be around ZAR132 million per year and the potential losses due to restrictions from international markets due to poor irrigation water quality could be between ZAR190 and ZAR570 million per year, similar to that estimated for the Berg River catchment. In addition, the value of the growing tourism economy was estimated to be around ZAR230 million per year, which could also be impacted by declining water quality, as much of this tourism activity is focused along the Breede River. In summary WWTW upgrades of R200 milllion: benefits derived from said upgrades of R1 300 million, gives a cost:benefit ratio of approximately 1:6 or 1:7.
It is clear that a failure to maintain acceptable water quality standards in the Breede River catchment will have a significant negative impact on the local economy. Not only is it important that the existing treatment plants be evaluated in terms of the costs for maintenance and upgrading, but it is also important to identify the areas where existing WWTW capacity is already insufficient to meet current demands. In particular, areas with significant urban and peri-urban growth should be identified and prioritised to ensure sufficient WWTW capacity, together with alternative strategies to address the increasing water quality risks associated with point- and non-point-source pollution. A further critical consideration is the development of strategies that ensure the protection of ecological infrastructure such as wetlands and riparian buffers and their integration with traditional hard engineering solutions. Only by taking a holistic approach to the challenge of addressing current and future water quality risks, associated in particular with the growth of urban and peri-urban developments in the Breede River catchment, will it be possible to maintain and develop a sustainable economy and employment for future generations.
ACKNOWLEDGEMENTS
Funding for this study was provided by the Department of Environmental Affairs and Development Planning (DEA&DP). The maps were produced by the Sub-Directorate Spatial Information Management, DEA&DP, Western Cape Government. Census data were supplied by the South African Statistical Service, with acknowledgement to Development Planning Intelligence Management and Research (DEA&DP). Pollution monitoring data were provided by the Breede-Gouritz Catchment Management Agency.
REFERENCES
AIHOON J, GROENEWALD J and SARTORIUS VON BACH H (1997) Agriculture salinisation in the Olifants River at Loskop Valley, Mpumulanga. Agrekon 36 (3) 268-283. [ Links ]
ARMOUR RJ (2007) Integrated modelling for sustainable management of salinity in the Lower Vaal and Riet irrigation areas. Department of Agriculture Economics, University of the Free State, Bloemfontein. [ Links ]
BATTY LC, ATKIN L and MANNING DAC (2005) Assessment of the ecological potential of mine-water treatment wetlands using a baseline survey of macroinvertebrate communities. Environ. Pollut. 138 412-419. [ Links ]
BRITZ JT, BARNES J, BUYS EM, LJABADENIYI OA, MINNAAR A, POTGIETER N, SIGGE GO, ACKERMAN A, LOTTER M, TAYLOR MB, VAN ZYL W, VENTER I and NETSHIKWETA R (2007) Quantitative investigation into the link between irrigation water quality and food safety: A review. WRC Report No. K51773. Water Research Commission, Pretoria. [ Links ]
BOBYLEV AV, BUBIN MN and RASSKAZOVA NS (2016) The geoecological modelling of small water reservoirs and river catchment areas as a procedure in urban development. Proced. Eng. 150 2067-2072. [ Links ]
CARTWRIGHT A, MCKENZIE M and CARTWRIGHT C (2015) Public and private finance for ecological infrastructure. 30 November 2015. WWF-SA, Pretoria. [ Links ]
CLASEN T, SCHMIDT W, RABIE T, ROBERTS I and CAIRNCROSS S (2007) Interventions to improve water quality for preventing diarrhoea: Systematic review and meta-analysis. Brit. Med. J. doi:10.1136/bmj.39118.489931.BE. [ Links ]
CULLIS J, ALTON T, ARNDT C, CARTWRIGHT A, CHANG A, GABRIEL S, GEBRETSADIK Y, HARTLEY F, DE JAGER G, MAKRELOV K, ROBERTSON G, SCHLOSSER A, STRZEPEK K and THURLOW J (2015) An uncertainty approach to modelling climate change risk in South Africa. United Nations University World Institute for Development Economics Research. WIDER Working Paper 2015/045. URL: https://www.wider.unu.edu/publication/uncertainty-approach-modelling-climate-change-risk-south-africa. UN-WIDER, Helsinki [ Links ]
CULLIS J, GÖRGENS A and ROSSOUW N (2005) First order estimate of the contribution of agriculture to non-point source pollution in three South African catchments: salinity, nitrogen and phosphorus. WRC Report No. 1467/2/05. Water Research Commission, Pretoria. [ Links ]
CULLIS JDS, GÖRGENS AHM and MARAIS C (2007) a strategic study of the impact of invasive alien plants in the high rainfall catchments and riparian zones of South Africa on total surface water yield. Water SA 33 (1) 35-42. [ Links ]
DASGUPTA P (2004) Human Well-Being and the Natural Environment (2nd edn). Oxford University Press, Oxford. [ Links ]
DABROWSKI JM (2015) Investigation of the contamination of water resources by agricultural chemicals and the impact on environmental health Volume 2: Prioritising human health effects and mapping sources of agricultural pesticides used in South Africa. WRC Report No. TT 642/15. Water Research Commission, Pretoria. [ Links ]
DWA (Department of Water Affairs, South Africa) (2011) Planning level review of water quality in South Africa. Sub-series No. WQP 2.0. Directorate Water Resource Planning Systems: Water Quality Planning. Resource Directed Management of Water Quality. Department of Water Affairs, Pretoria. [ Links ]
DWAF (Department of Water Affairs and Forestry, South Africa) (2004) National Water Resource Strategy. Department of Water Affairs and Forestry, Pretoria. [ Links ]
DWAF (Department of Water Affairs and Forestry, South Africa) (2006) Resource Directed Management of Water Quality: Management Instruments. Volume 4.2: Guideline for Determining Resource Water Quality Objectives (RWQOs), Allocatable Water Quality and the Stress of the Water Resource. Water Resource Planning Systems Series, Sub-Series No. WQP 1.7.2, Edition 2. Department of Water Affairs and Forestry, Pretoria. ISBN No. 0-621-36793-1. [ Links ]
DWAF (Department of Water Affairs and Forestry, South Africa) (2000) Breede River Basin Study. Water quality situation assessment. Prepared by W Kamish and JN Rossouw of Ninham Shand (Pty) Ltd as part of the Breede River Basin Study. DWAF Report No. PH 00/00/2202. Department of Water Affairs and Forestry, Pretoria. [ Links ]
DE LANGE WJ, MAHUMANI BK, STEYN M and OELOGSE SHH (2012) Monetary valuation of salinity impacts and microbial pollution in the Olifants Water Management Area, South Africa. Water SA 38 (2) 241-248. [ Links ]
DE LANGE WJ (2014) The monitory value of the impact of selected pollutants on commercial agriculture in the Dwars River. Report number CSIR/NRE/GES/IR/2014/0075/A. Council for Scientific and Industrial Research (CSIR), Pretoria. [ Links ]
DE LANGE WJ, BOTHA AM and OBERHOLSTER PJ (2016) Towards tradable permits for filamentous green algae pollution. J. Environ. Manage. 179 (2016) 21-30. [ Links ]
DWS (Department of Water and Sanitation, South Africa) (2014) Green Drop Progress Report 2014. Department of Water and Sanitation, Pretoria. URL: http://www.dwaf.gov.za/Dir_WS/GDS/Default.aspx [ Links ]
DWS (Department of Water and Sanitation, South Africa) (2016) Status Quo Report. Determination of Water Resources Classes and Resource Quality Objectives for the water resources in the Breede-Gouritz Water Management Area. DWS Report No. RDM/WMA8/CON/CLA/0516. Department of Water and Sanitation, Pretoria. [ Links ]
DILLON B and BARRETT CB (2017) Agricultural factor markets in Sub-Saharan Africa: An updated view with formal tests for market failure. Food Policy Management Area. DWS Report No. RDM/WMA8/CON/CLA/0516. Department of Water and Sanitation, Pretoria. [ Links ]
FORBES G, DICKSON KR, GOLDEN TD, HUDAK P and DOYLE RD (2004) Dissolved phosphorus retention of light-weight expanded shale and masonry sand used in subsurface flow treatment wetlands. Environ. Sci. Technol. 38 892-898. [ Links ]
HOFFMANN JR (1995) Non-point source pollution in the Hennops River Valley. WRC Report No. 518/1/95. Water Research Commission, Pretoria. [ Links ]
JOHNSTON CA, DETENBECK NE and NIEMI GJ (1990) The cumulative effect of wetlands on stream water quality and quantity. A landscape approach. Biogeochemistry 10 105-141. [ Links ]
JORDAN TE, WHIGHAM DF, HOFMOCKEL KH and PITTEK MA (2003) Wetlands and aquatic processes: nutrient and sediment removal by a restored wetland receiving agricultural runoff. J. Environ. Qual. 32 1534-1547. [ Links ]
MARIOLA MJ (2012) Farmers, trust, and the market solution to water pollution: The role of social embeddedness in water quality trading. J. Rural Stud. 28 577-589. [ Links ]
LOUW DB (2010) Possible impact of water pollution in the Berg River irrigation region. Report for the Upper Berg River Irrigation Board. OABS, Paarl. [ Links ]
MABOZA E, POOL E and AFRICA CWJ (2013) The impact of an informal settlement on surface water contamination in the Western Cape. Proc. Journal of Clinical Microbiology and Biochemical Technology Joint Infection Prevention Network- Kenya/Infection Control Africa Network (IPNET-K/ICAN) Conference, 6-8 November 2013, Mombasa. [ Links ]
MCKEE LJ, EYRE BD and HOSSAIN S (2000) Transport and retention of nitrogen and phosphorus in the sub-tropical Richmond River estuary, Australia - a budget approach. Biogeochemistry 50 241-278. [ Links ]
MOKONDOKO P, MANSON RH and PÉREZ-MAQUEO O (2016) Assessing the service of water quality regulation by quantifying the effects of land use on water quality and public health in central Veracruz, Mexico. Ecosyst. Services Part A 22 161-173. [ Links ]
NOVOTNY V (2003) Water Quality: Diffuse Pollution and Watershed Management. John Wiley & Sons, Hoboken, NJ. [ Links ]
OBERHOLSTER PJ and BOTHA A-M (2014) The Importance of water quality to the food industry of South Africa. In: Understanding the Food Energy Water Nexus. WWF-SA, South Africa. [ Links ]
OBERHOLSTER PJ, DE KLERK AJ, CHAMIER J and BOTHA A-M (2013) Longitudinal trends in water chemistry and phytoplankton assemblage downstream of the Riverview WWTP in the Upper Olifants River. Ecohydrol. Hydrobiol. 13 41-51. [ Links ]
PEGRAM GC and GÖRGENS AHM (2001) Guide to non-point source assessment. WRC Report No. TT 142/01. Water Research Commission, Pretoria. [ Links ]
PELTIER EF, WEBB SM and GAILLARD JF (2003) Zinc and lead sequestration in an impacted wetland system. Adv. Environ. Res. 8 103-112. [ Links ]
PERRY J and VANDERKLEIN EL (1996) Water Quality: Management of a Natural Resource. Blackwell Science, Cambridge, MA. [ Links ]
SCHWARZENBACH RP, EGLI T, HOFSTETTER TB, VON GUNTEN U and WEHRLI B (2010) Global water pollution and human health. Annu. Rev. 35 109-136. [ Links ]
STERNER T (2003) Policy Instruments for Environmental and Natural Resource Management. Resources for Future, Washington DC. [ Links ]
THULLEN JS, SARTORIS JJ and NELSON SM (2005) Managing vegetation in surface-flow wastewater-treatment wetlands for optimal treatment performance. Ecol. Eng. 25 583-593. [ Links ]
TILTON DL and KADLEC RH (1979) The utilisation of a fresh-water wetland for nutrient removal from secondarily treated waste water effluent. J. Environ. Qual. 8 328-334. [ Links ]
TONGESAYI S and TONGESAYI T (2017) Water quality and public health: Role of wastewater. In: Ahuja S (ed.) Chemistry and Water. Elsevier, Amsterdam. 553-596. [ Links ]
TURPIE JK, DAY E, ROSS-GILLESPIE V and LOUW A (2010) Estimation of the water quality amelioration value of wetlands: a case study of the Western Cape, South Africa. Environment for Development Discussion Paper Series EfD DP 10-15. URL: http://www.rff.org/files/sharepoint/WorkImages/Download/EfD-DP-10-15.pdf. [ Links ]
UNECE (1994) Standard statistical classification of surface freshwater quality for the maintenance of aquatic life. In: Readings in International Environment Statistics. United Nations Economic Commission for Europe, United Nations, New York and Geneva. [ Links ]
WESTERN CAPE GOVERNMENT PROVINCIAL TREASURY (2014) Provincial Economic Review and Outlook (PERO), 2014. Western Cape Provincial Government, Cape Town. ISBN: 978-0-621-42999-2. [ Links ]
XUE C-H, YIN H-L and XIE M (2015) Development of integrated catchment and water quality model for urban rivers. J. Hydrodyn. Ser. B 27 593-560. [ Links ]
Received 22 September 2017
Accepted in revised form 14 June 2018
* To whom all correspondence should be addressed. e-mail: james.cullis@aurecongroup.com

