


Servicios Personalizados
Articulo
 Inglés (pdf)
 Articulo en XML
 Referencias del artículo
Indicadores

Links relacionados
-
 Citado por Google
 -
 Similares en Google
Compartir

 Permalink
Water SA
versión On-line ISSN 1816-7950
versión impresa ISSN 0378-4738
Water SA vol.44 no.3 Pretoria jul. 2018
http://dx.doi.org/10.4314/wsa.v44i3.10
ORIGINAL ARTICLES
Predicting continuous form of soil-water characteristics curve from limited particle size distribution data
Samaneh AmanabadiI, *; Mohammad Hossien MohammadiII; Mohammad Hassan MasihabadiI; Mehran VaziriniaI
IDepartment of Soil Science, Faculty of Agriculture and Natural Resources, Science and Research Branch, Islamic Azad University, Tehran, Iran
IIDepartment of Soil Science, Faculty of Agriculture, University of Tehran, Alborz, Iran
ABSTRACT
Detailed information derived from a soil moisture characteristics curve (SMC) helps in water flow and solute transport management. Hence, prediction of the SMC from soil particle size distribution (PSD), which is easy to measure, would be convenient. In this study, we combine an integrated robust PSD-based model and a Van Genuchten SMC model to predict a continuous form of SMC using sand, silt and clay percentages for 50 soils selected from the UNSODA database. We compare the performance of the proposed approach with some previous prediction models. The results indicated that the SMC can be predicted and modelled properly by using sand, silt, clay and bulk density data. The model's bias was attributed to the high fine particle and organic carbon (OC) content. We concluded that independence of the proposed method from the database and any empirical coefficients make predictions more reliable and applicable for large-scale water and solute transport management.
Keywords: relative improvement, ROSETTA software, scaling approach, UNSODA database
INTRODUCTION
The soil's unsaturated zone forms a pivotal part of the hydrological cycle as it connects surface water to groundwater through the porous medium of soil. Therefore, a comprehensive evaluation of unsaturated soil proves useful for studying water flow and solute transport (Harter and Hopmans 2004). One of the most important challenges in soil physics is to deal with the estimation of the hydraulic conductivity curve (HCC) and soil moisture characteristic curve (SMC) (Futter et al., 2007; Balland et al., 2008). The SMC, which indicates the functional relationship between soil water content and matric potential, is used to model the solute transport and water flow in the vadose zone (Hunt et al., 2013). However, due to temporal and spatial variability, a direct measurement of the hydraulic properties is labour-intensive, costly and inaccurate (Schaap and Leij 1998; Christiaens and Feyen 2001; Islam et al., 2006; Abbasi et al., 2011). Therefore, considerable efforts have been made to estimate the SMC indirectly (Antinoro et al., 2014).
Easily available soil properties have been used extensively as a basis for alternative methods to estimate the HCC and SMC. In recent years, researchers have paid considerable attention to predicting SMC in terms of pore size distribution (PoSD) using basic soil physical properties (Nimmo et al., 2007; Mohammadi and Meskini-Vishkaee, 2013). These approaches, which are dubbed transfer functions, can be classified into three groups:
-
Statistical techniques (pedo-transfer functions) or neural network models determine the correlation of basic soil properties (for instance sand, silt and clay percentages and organic matter content) to SMC points or parameters (Dashtaki et al., 2010; Vereecken et al., 2010; Abbasi et al., 2011). Available and reliable soil databases provide a variety of inputs for statistical models and, therefore, these models have been widely used (Hwang and Choi, 2006). For instance, ROSETTA software uses neural network analysis to estimate soil hydraulic parameters with hierarchical pedo-transfer functions. However, some researchers have shown that ROSETTA software did not estimate the Van Genuchten model (VG model) parameters properly (Yang and You, 2013).
-
Physico-empirical models express the relation of particle size distribution (PSD) with PoSD. Arya and Paris (1981) made the first attempt to develop a physico-empirical model, which connects the soil moisture content and void volume. They estimated the pore diameter from the particle size (AP model). Following Arya and Paris (1981), other researchers developed semi-physical models to overcome the shortcomings of pedo-transfer functions (PTFs) (Haverkamp and Parlange, 1986; Smettem and Gregory, 1996; Hwang and Powers, 2003), For instance, Haverkamp and Parlange (1986) developed an approach based on the Brooks and Corey (1964) model (BC model) which predicts the continuous form of SMC using PSD, soil organic matter and bulk density for sandy soils.
-
Conceptual models predict the soil hydraulic properties based on some conceptual assumptions without using any empirical coefficient. Recently, Mohammadi and Vanclooster (2011) developed a robust and conceptual transfer function to estimate SMC from PSD (MV model). Mohammadi and Meskini-Vishkaee (2013) augmented the MV model to predict a continuous form of the SMC (MM model). They showed that the MV model and the MM model under-predicted the moisture content of soils in dry ranges of the SMC. To overcome this constraint, Meskini-Vishaee et al. (2014) used a scaling approach to predict the continuous form of SMC based on their knowledge of PSD, the Van Genuchten (1980) model and particle packing state (MV-VG model). Meskini-Vishaee et al. (2014) showed that the scaling approach improves the SMC predictions by 30% for all selected soils in comparison to the MV model, the MM model and ROSETTA (Schaap et al., 2001) software. The MV-VG model is based on a full-range experimental PSD while, the full range of the PSD curve is not measured routinely and the sand, silt and clay percentages are commonly reported in many laboratory analyses.
Therefore, the objectives of this study were (i) to adjust the MV-VG model for the prediction of SMC using only sand, silt and clay percentage; (ii) to compare the performance of the proposed approach with the results from the MV-VG model using the UNSODA (Unsaturated Soil Database) database and (iii) to evaluate the performance of the adjusted MV-VG model with the ROSETTA software prediction results.
Theory
Scaling approach
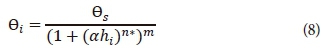
Empirical parameters of the soil water characteristic curve and database-dependent models are error sources of models which describe soil hydraulic functions. Elimination of such systematic error using scaling approaches greatly improves the SMC accuracy. Meskini-Vishkaee et al. (2014) proposed an SMC scaled model based on the VG model assuming that the residual water content equals zero (θr = 0).

where θ (L3·L-3) is the soil moisture content, θs (L3·L-3) is the saturated soil moisture content, h (L) is the matric suction, m and α are fitting coefficients and the parameter n* is the scaled pore size distribution index.

where n is a fitting coefficient and λ is defined as:

The parameter ξmax(-) equals 1.41432 and ξ (-) is a coefficient depending on the arrangement state of soil particles and is defined as:

where e(-) is the void ratio given by:
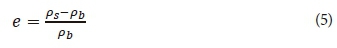
where ρb (M·L-3) and ρs (M·L-3) are bulk and particle densities, respectively.
Developed soil water characteristic curve
Mohammadi and Vanclooster (2011) presented a conceptual robust model (MV model) to predict the soil matric suction, hi, from the particle size assuming the pore space geometry:
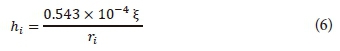
where hi (L) is the matric suction of the ith fraction size, ri (L) is the radius of the ith fraction size. Simplified assumptions of the MV model, which ignore the considerable effects of clay surface forces, lead to under-predictions in a dry range of the SMC, despite the fact that the MV model predicts the water characteristic curve accurately because of independence of SMC to the database and no empirical parameters. Following the Arya and Paris model (AP model), the mathematical equation between the moisture content (θi) and hi is defined as:
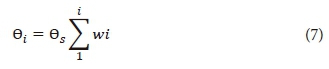
where wi(-) is the particle mass fraction of the ith fraction. Eq. (1) is the scaled form of the Van Genucthen SMC model when θr = 0.
Combining Eqs 6 to 8 gives:
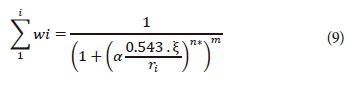
Eq. 9 is fitted to the PSD data to estimate the VG model parameters (m, n and α), which should be used as the input parameters in Eq. 1 as an SMC predictor model. Since Eq. 9 includes 3 variable fitting parameters it should be used to fit the full range of PSD data containing at least 4 measured points. For limited-availability data points, Eq. 9 can be represented with the assumption of m = 1-1/n.

Eq. 10 can be used to fit PSD data including the sand, silt and clay percentages only. In summary, fitting of Eq. 10 or Eq. 9 allows the estimation of SMC parameters (n, m, α). Considering that ρb is known and the scaling factor and subsequently n* can be calculated, the continuous form of SMC is predicted using Eq. 1.
MATERIALS AND METHODS
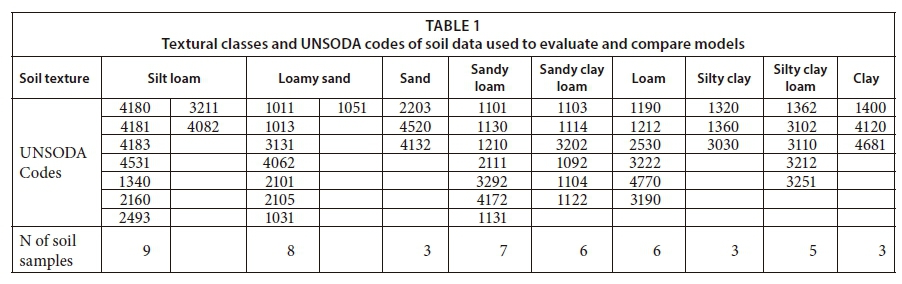
Fifty soil samples from the UNSODA database (Nemes et al., 2001) having PSD data with at least 4 fractions were selected to estimate SMC. The selected codes are presented in Table 1. The UNSODA database contains unsaturated hydraulic characteristics of 790 soil samples from all over the world, and especially Europe and America. They are used to develop estimations of water flow and solute transport management.
Equation 9 was used to fit the full range of PSD data with at least 4 measured points (Method 1: full PSD method) and Eq. 10 was used to fit the PSD data by assuming that only the sand, silt and clay percentages are known (Method 2: limited PSD method). To evaluate the unknown coefficients of Eq. 9 and Eq. 10, the trust region algorithm of Matlab8.3 software (Matlab 8.3, The Mathworks Inc., Natick, MA, USA) was used. The parameters e, ξ and λ were easily calculated using available bulk and particle densities. In most UNSODA soil samples, θs data are available. For those samples with no θs data we used the suggestion of Chan and Govindaraju (2004), who assumed saturation moisture content to be equal to the corresponding moisture content of the lowest matric potential.
The ROSETTA software is also used to estimate the SMC parameters of the VG model using the SSCBD model option (sand, silt and clay percentages and bulk density are model predictors).
Statistical analysis
To calculate the accuracy of each prediction, the root mean square error (RMSE) between the measured and predicted moisture content was computed:

where N is the number of measured moisture contents, θi(p) and θi(m) are predicted and measured moisture content in the ith matric suction, respectively. The coefficient of determination (R2) is also presented to evaluate the correlation between the measured and predicted moisture content. Relative improvement (RI) was calculated to compare the prediction methods (McBratney, 2002):
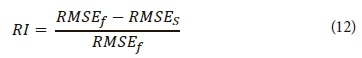
where RMSEf and RMSEs are RMSE of Method 1 (as the reference model) and Method 2 or ROSETTA (as the comparative approaches), respectively. A positive value of dimensionless RI indicates that the accuracy of the predicted moisture contents improves by using Method 2 or the ROSETTA approach.
To compare the measured and predicted moisture content for the dataset containing 50 soils, UNSODA codes were evaluated using the mean absolute error (MAE) and mean bias error (MBE) defined as:
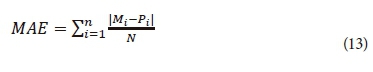
and

where Mi, Pi are the measured and predicted values of moisture content, respectively, and N is also the number of measured and predicted points. MAE is a statistical criterion to show the average of error magnitude and MBE is used to show the average bias of each method. A positive MBE value indicates over-prediction.
RESULTS AND DISCUSSION
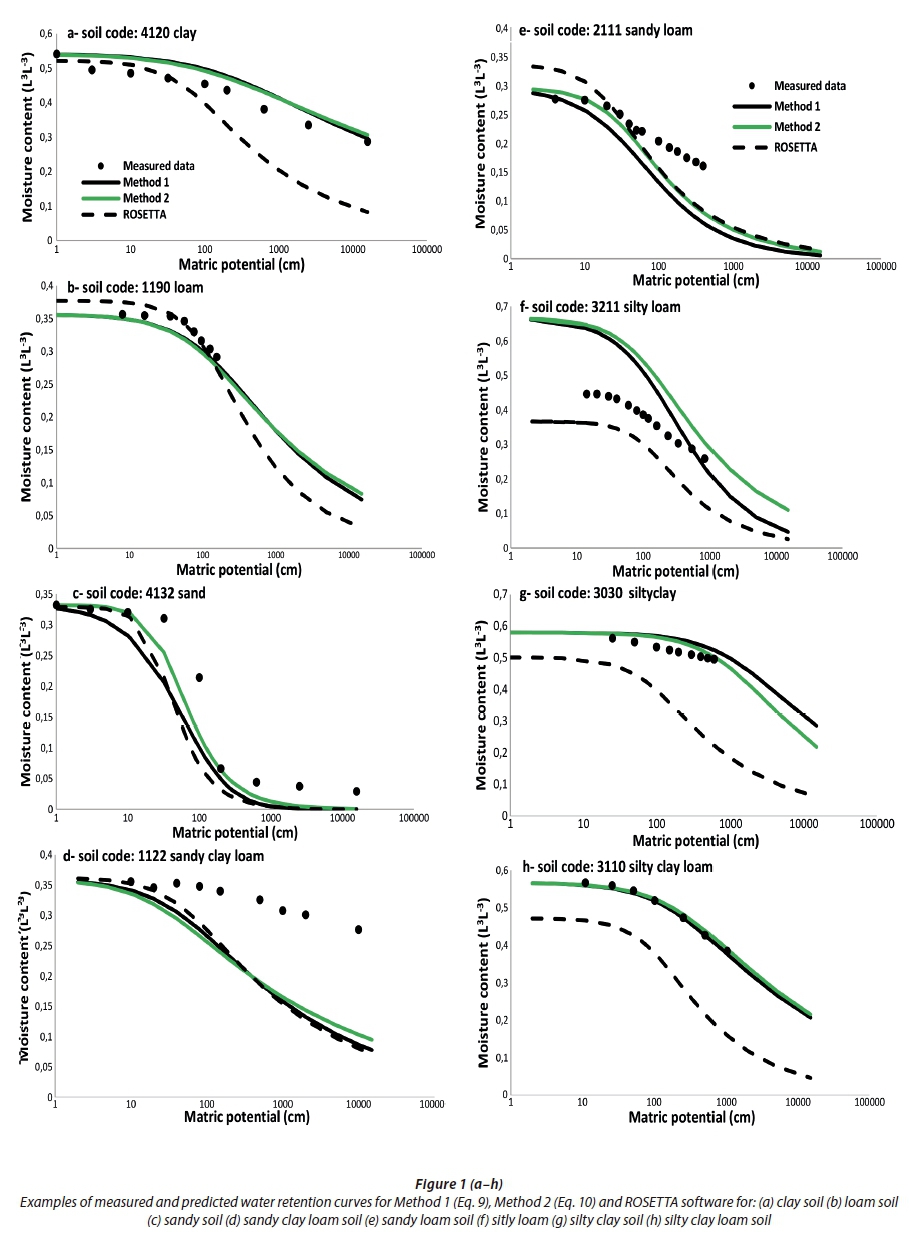
Figure 1 (a-h) displays the actual measured and estimated SMC for clay (Code 4120), loam (Code 1190), sand (Code 4132), sandy clay loam (Code 1122), sandy loam (Code 2111), silty loam (Code 3211), silty clay (Code 3030) and silty clay loam (Code 3110) soils. The SMC is estimated using Prediction Method 1, Method 2 and the ROSETTA software. Method 1, Method 2 and the ROSETTA software estimated SMC adequately for Soil Codes 1190, 4132 and 2111. However, for the dry ranges of the SMC, these methods under-predicted the soil moisture content. Moreover, the ROSETTA software slightly over-predicted the moisture content of soil in wet ranges of the SMC (low matric suction) for Soil Code 2111. For Codes 3030, 4120 and 3110, Method 1 and Method 2 predict SMC properly, while the ROSETTA software does not provide appropriate estimations for all ranges of SMC (for Soil Code 3030 and 3110) or for the main part of SMC (for Soil Code 4120). For silty loam (Code 3211), Methods 1 and 2 significantly over-estimated the soil water content in the low matric suction range, while the ROSETTA software underestimated for all ranges.
Methods 1 and 2 are based on the MV model. This model assumes that all soil particles are spherical and that soil structure can only influence soil bulk density. The effects of soil organic matter content, particle surface energy, lens and film water volume are not supported by this model (Mohammadi and Vanclooster, 2011; Mohammadi and Meskini-Vishkaee, 2013). Therefore, the under-prediction by Method 1 and Method 2 can be partially attributed to the assumptions of the MV model. For all sample soils represented in Fig. 1, Method 1 and Method 2 provide consistent predictions, especially for the wet ranges of SMC.
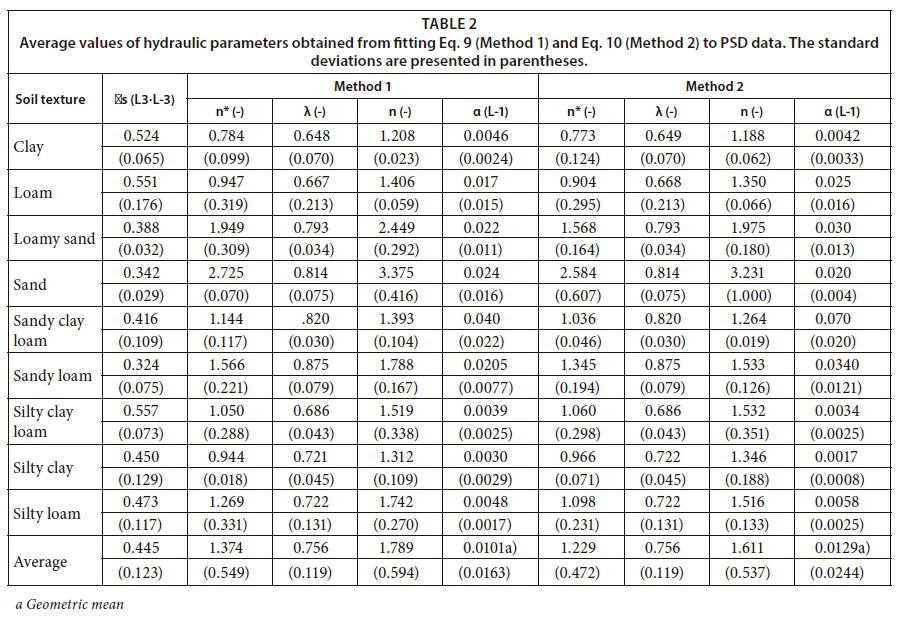
The results of fitting Eq. 9 (Method 1: full PSD method) and Eq. 10 (Method 2: limited PSD method) are presented in Table 2.
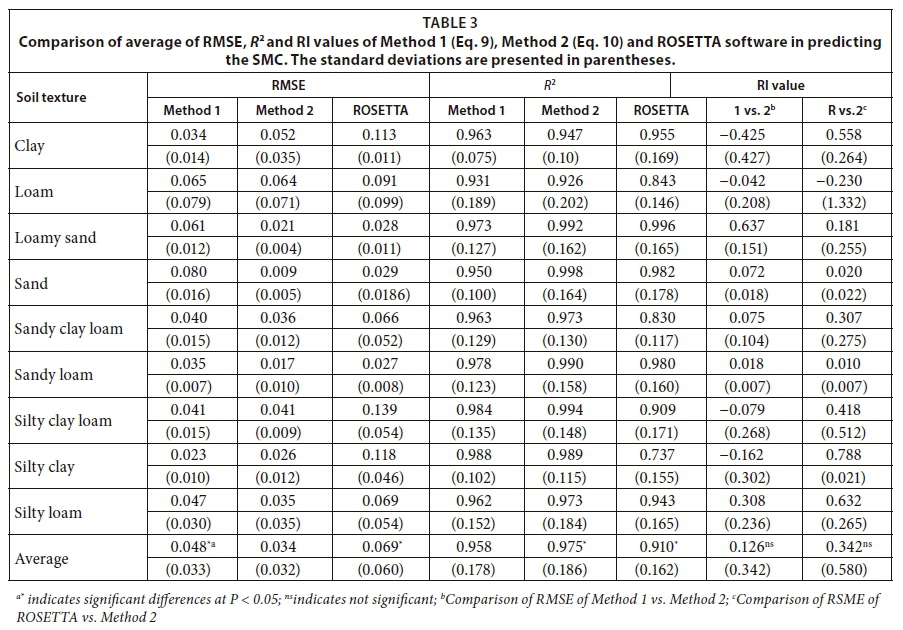
Table 2 shows that the average value of θs is 0.445 for all selected soils and varies from 0.324 for sandy loam soils to 0.557 for silty clay loam soils. For Methods 1 and 2, the average values of n* were 1.374 and 1.229, respectively. Regarding Eqs 3 to 5, the λ value is computed using bulk and particle densities; the average λ values of Method 1 and Method 2 are the same (0.756). For Method 1 and Method 2, the geometric average values of α are 0.0101 and 0.0129, respectively. The prediction results of Method 1, Method 2 and the ROSETTA software are summarized in Table 3 by comparing the statistical criteria, including RMSE, R2 and RI.
The average RMSEs of Method 1, Method 2 and the ROSETTA software are 0.048 (varying from 0.023 for silty clay soils to 0.080 for sandy soils), 0.034 (varying from 0.009 for sandy soils to 0.064 for loam soils) and 0.069 (varying from 0.027 for sandy loam soils to 0.139 for silty clay loam soils), respectively. In terms of RMSE, Method 1 and Method 2 predicted consistently better than ROSETTA software. The RMSEs derived from Method 1 and Method 2 are smaller than the 0.060 and 0.2071 obtained from the scaling approach by Meskini et al., (2014) and Mohammadi and Vanclooster (2011) (MV model), respectively. The RMSE results of the ROSETTA software in the current study (0.069) are approximately the same as for ROSETTA software by Meskini et al. (2014) (0.0745). Comparison of the performances of Method 1 and Method 2 with the performance of ROSETTA software reveals that ROSETTA software is not capable of predicting SMC accurately in fine textured soils because of the fine particles. The average value of R2 for all selected UNSODA soil textures is 0.958, 0.975 and 0.910 for Method 1, Method 2 and the ROSETTA software, respectively (Table 3). In terms of R2 values, Method 1 and Method 2 performed consistently better than the ROSETTA software. The small difference between the R2 values of Method 1 and Method 2 is not statistically significant.
Overall comparison of developed model
Comparison of Method 1 and Method 2 according to the average RI value (0.126) indicated that, in general, the accuracy of the MV-VG model does not increase with an increased number of measured points of the PSD curve. However, the average RI value per texture class varies from -0.425 for clay soils to 0.637 for loamy sand soils. The RI values in comparison of Method 1 and Method 2 for clay, loam, silty clay loam, and silty clay textured soils were slightly negative, revealing that a low number of model inputs reduce the SMC accuracy in fine to moderate textured soils (Table 3). The average RI value for comparison of ROSETTA and Method 2 is 0.342 (varying from -0.230 for loam soils to 0.788 for silty loam soils), which indicated that, although ROSETTA and the limited PSD method require the same input data, Method 2 (limited PSD method) predicts SMC more accurately.
In many pedological studies, sand, silt and clay percentages are measured routinely and this information is usually available in most soil survey reports. Method 2 can be used to predict SMC easily. Moreover, Method 2 does not need any empirical coefficient or database-dependent parameter. This advantage allows for prediction of the soil hydraulic characteristics regardless of spatio-temporal variations; thus SMC can be estimated for large-scale studies.
Table 4 represents statistical criteria to compare the measured vs. predicted moisture content using mean absolute error, mean bias error and R2 of linear regression. In terms of MAE, Method 2 predicts SMC more accurately. As can be seen in Table 3, that is also evident from comparing average values of RMSE and R2 obtained for Method 2 (0.034, 0.975) and Method 1 (0.048, 0.958) and ROSETTA software (0.069, 0.910). The negative MBE shows that Method 2 over-predicts SMC while Method 1 and ROSETTA under-predict.
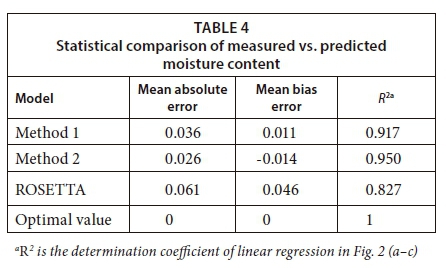
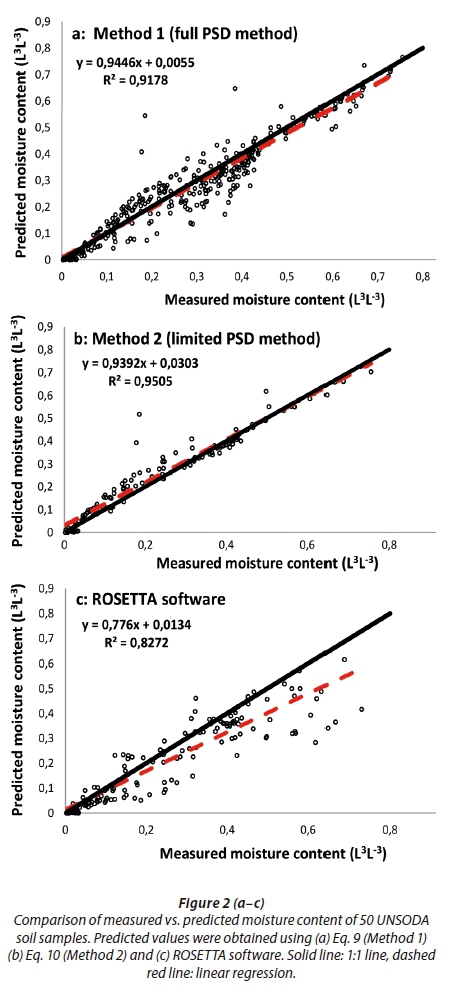
Comparison of measured and predicted soil moisture content of the full dataset for Method 1, Method 2 and the ROSETTA software is respectively shown in Fig. 2 (a-c). In general, the 1:1 line shows the equal measured and predicted moisture content to reveal the bias of measured vs. predicted moisture content of the dataset. Linear regression (dashed red line) is considered to evaluate the best fitting line through predicted and measured moisture content. The slope values of linear regression between measured and predicted moisture content were 0.94 (Method 1), 0.93 (Method 2) and 0.77 (ROSETTA software). The R2 of the linear regressions were 0.917, 0.950 and 0.827 for Method 1, Method 2 and the ROSETTA software, respectively. According to the slope values, Fig. 2 (a-c) and MBE criteria, Method 2 slightly over-predicts moisture contents, while the ROSETTA software and Method 1 under-predict. Comparison of the proposed methods revealed that Method 1 and Method 2 generally predict SMC more accurately than ROSETTA software, according to statistical criteria, including RMSE, RI, MBE and R2.
CONCLUSIONS
In this study, we adopted the MV-VG model for the prediction of SMC using only sand, silt and clay percentages, and we also evaluated the performance of this approach with the experimental data and results of ROSETTA software. Results showed that the continuous form of SMC can be predicted accurately assuming that sand, silt and clay percentages are the only known properties of the soil. Full PSD data are not usually available while sand, silt and clay percentages are measured conventionally in all soil analyses.
In general, we summarized the advantages of the proposed method for proper SMC prediction: (i) This method does not depend on a database or any empirical parameter. (ii) The proposed approach predicts continuous forms of SMC for all tested soils. (iii) In comparison with the well-known ROSETTA software, this method is capable of predicting SMC more accurately, especially in a dry range of SMC. Since sand, silt and clay percentages are readily available, soil properties and their spatial-temporal variability are approximately constant. The proposed method can be used as an alternative for predicting SMC in large-scale studies.
REFERENCES
ABBASI Y, GHANBARIAN-ALAVIJEH B, LIAGHAT A and SHORAFA M (2011) Evaluation of pedotransfer functions for estimating soil water retention curve of saline and saline-alkali soils of Iran. Pedosphere 21 (2) 230-237. https://doi.org/10.1016/S1002-0160(11)60122-7 [ Links ]
ANTINORO C, BAGARELLO V, FERRO V, GIORDANO G and IOVINO M (2014) A simplified approach to estimate water retention for Sicilian soils by the Arya-Paris model. Geoderma 213 226-234. https://doi.org/10.1016/j.geoderma.2013.08.004 [ Links ]
ARYA LM and PARIS JF (1981) A physicoempirical model to predict the soil moisture characteristic from particle-size distribution and bulk density data. Soil Sci. Soc. Am. J. 45 (6) 1023-1030. https://doi.org/10.2136/sssaj1981.03615995004500060004x [ Links ]
BALLAND V, POLLACCO JA and ARP PA (2008) Modeling soil hydraulic properties for a wide range of soil conditions. Ecol. Model. 219 (3) 300-316. https://doi.org/10.1016/j.ecolmodel.2008.07.009 [ Links ]
BROOKS R and COREY T (1964) Hydraulic properties of porous media. [ Links ]
CHAN T and GOVINDARAJU R (2004) Estimating soil water retention curve from particle-size distribution data based on polydisperse sphere systems. Vadose Zone J. 3 (4) 1443-1454. https://doi.org/10.2136/vzj2004.1443 [ Links ]
CHRISTIAENS K and FEYEN J (2001) Analysis of uncertainties associated with different methods to determine soil hydraulic properties and their propagation in the distributed hydrological MIKE SHE model. J. Hydrol. 246 (1) 63-81. https://doi.org/10.1016/S0022-1694(01)00345-6 [ Links ]
DASHTAKI SG, HOMAEE M and KHODAVERDILOO H (2010) Derivation and validation of pedotransfer functions for estimating soil water retention curve using a variety of soil data. Soil Use Manage. 26 (1) 68-74. https://doi.org/10.1111/j.1475-2743.2009.00254.x [ Links ]
FUTTER M, BUTTERFIELD D, COSBY B, DILLON P, WADE A and WHITEHEAD P (2007) Modeling the mechanisms that control in‐stream dissolved organic carbon dynamics in upland and forested catchments. Water Resour. Res. 43 (2). https://doi.org/10.1029/2006WR004960 [ Links ]
HARTER T and HOPMANS JW (2004) Role of Vadose Zone Flow Processes in Regional Scale Hydrology: Review, Opportunities and Challenges. Kluwer Academic Press, Dordrecht. 179-208. [ Links ]
HAVERKAMP RT and PARLANGE J-Y (1986) Predicting the water-retention curve from particle-size distribution: 1. Sandy soils without organic matter. Soil Sci. 142 (6) 325-339. https://doi.org/10.1097/00010694-198612000-00001 [ Links ]
HUNT AG, GHANBARIAN B and SAVILLE KC (2013) Unsaturated hydraulic conductivity modeling for porous media with two fractal regimes. Geoderma 207 268-278. https://doi.org/10.1016/j.geoderma.2013.05.023 [ Links ]
HWANG SI and CHOI SI (2006) Use of a lognormal distribution model for estimating soil water retention curves from particle-size distribution data. J. Hydrol. 323 (1) 325-334. https://doi.org/10.1016/j.jhydrol.2005.09.005 [ Links ]
HWANG SI and POWERS SE (2003) Lognormal distribution model for estimating soil water retention curves for sandy soils. Soil Sci. 168 (3) 156-166. https://doi.org/10.1097/01.ss.0000058888.60072.e3 [ Links ]
ISLAM N, WALLENDER WW, MITCHELL JP, WICKS S and HOWITT RE (2006) Performance evaluation of methods for the estimation of soil hydraulic parameters and their suitability in a hydrologic model. Geoderma 134 (1) 135-151. https://doi.org/10.1016/j.geoderma.2005.09.004 [ Links ]
MESKINI-VISHKAEE F, MOHAMMADI MH and VANCLOOSTER M (2014) Predicting the soil moisture retention curve, from soil particle size distribution and bulk density data using a packing density scaling factor. Hydrol. Earth Syst. Sci. 18 (10) 4053-4063. https://doi.org/10.5194/hess-18-4053-2014 [ Links ]
MINASNY B and MCBRATNEY B (2002) The neuro-m method for fitting neural network parametric pedotransfer functions. Soil Sci. Soc. Am. J. 66 (2) 352-361. https://doi.org/10.2136/sssaj2002.1407a [ Links ]
MOHAMMADI M and MESKINI-VISHKAEE F (2013) Predicting soil moisture characteristic curves from continuous particle-size distribution data. Pedosphere 23 (1) 70-80. https://doi.org/10.1016/S1002-0160(12)60081-2 [ Links ]
MOHAMMADI MH and VANCLOOSTER M (2011) Predicting the soil moisture characteristic curve from particle size distribution with a simple conceptual model. Vadose Zone J. 10 (2) 594-602. https://doi.org/10.2136/vzj2010.0080 [ Links ]
NEMES A, SCHAAP M, LEIJ F and WöSTEN J (2001) Description of the unsaturated soil hydraulic database UNSODA version 2.0. J. Hydrol. 251 (3) 151-162. https://doi.org/10.1016/S0022-1694(01)00465-6 [ Links ]
NIMMO JR, HERKELRATH WN and LAGUNA LUNA AM (2007) Physically based estimation of soil water retention from textural data: General framework, new models, and streamlined existing models. Vadose Zone J. 6 (4) 766-773. https://doi.org/10.2136/vzj2007.0019 [ Links ]
SCHAAP MG and LEIJ FJ (1998) Using neural networks to predict soil water retention and soil hydraulic conductivity. Soil Till. Res. 47 (1) 37-42. https://doi.org/10.1016/S0167-1987(98)00070-1 [ Links ]
SCHAAP MG, LEIJ FJ and VAN GENUCHTEN MT (2001) ROSETTA: a computer program for estimating soil hydraulic parameters with hierarchical pedotransfer functions. J. Hydrol. 251 (3) 163-176. https://doi.org/10.1016/S0022-1694(01)00466-8 [ Links ]
SMETTEM K and GREGORY P (1996) The relation between soil water retention and particle size distribution parameters for some predominantly sandy Western Australian soils. Soil Res. 34 (5) 695-708. https://doi.org/10.1071/SR9960695 [ Links ]
VAN GENUCHTEN MT (1980) A closed-form equation for predicting the hydraulic conductivity of unsaturated soils. Soil Sci. Soc. Am. J. 44 (5) 892-898. https://doi.org/10.2136/sssaj1980.03615995004400050002x [ Links ]
VEREECKEN H, WEYNANTS M, JAVAUX M, PACHEPSKY Y, SCHAAP M and GENUCHTEN MT (2010) Using pedotransfer functions to estimate the van Genuchten-Mualem soil hydraulic properties: A review. Vadose Zone J. 9 (4) 795-820. https://doi.org/10.2136/vzj2010.0045 [ Links ]
YANG X and YOU X (2013) Estimating parameters of Van Genuchten model for soil water retention curve by intelligent algorithms. Appl. Math. Inf. Sci. 7 (5) 1977-1983. https://doi.org/10.12785/amis/070537 [ Links ]
Received 24 July 2017
Accepted in revised form 12 June 2018
* To whom all correspondence should be addressed. +989123797845. e-mail: amanabadi@ut.ac.ir, s_amanabadi@yahoo.com

