


Servicios Personalizados
Articulo
 Inglés (pdf)
 Articulo en XML
 Referencias del artículo
Indicadores

Links relacionados
-
 Citado por Google
 -
 Similares en Google
Compartir

 Permalink
Water SA
versión On-line ISSN 1816-7950
versión impresa ISSN 0378-4738
Water SA vol.44 no.3 Pretoria jul. 2018
http://dx.doi.org/10.4314/wsa.v44i3.01
ORIGINAL ARTICLES
Prediction of wind drift and evaporation losses of a sprinkler irrigation system using principal component analysis and artificial neural network technique
Samy A MareyI, III, *; Mohamed SA El MarazkyII, III; Abdulwahed M AboukarimaII, III
ISciences, Technology and Innovation Unit, Rector's for Graduate Studies & Scientific Research, King Saud University, PO Box 2454, Riyadh 11451, Saudi Arabia
IIDepartment of Agricultural Engineering, College of Food and Agriculture Sciences, King Saud University, PO Box 2460, Riyadh 11451, Saudi Arabia
IIIAgricultural Engineering Research Institute (AEnRI), Agricultural Research Centre, Egypt
ABSTRACT
Principal component analysis was merged with the artificial neural network (ANN) technique to predict wind drift and evaporation losses (WDEL) from a sprinkler irrigation system. For this purpose, field experiments were conducted to determine WDEL under different conditions. Data from field experiments and previous studies were used as sample data to train the ANN model. Three models were developed to predict WDEL. In the first model (ANN1), 9 neurons (riser height, main nozzle diameter, auxiliary nozzle diameter, discharge rate of the main nozzle, discharge rate of the auxiliary nozzle, operating pressure, wind speed, air temperature and relative humidity) were used as the input layer. In the second model (ANN2), 7 neurons (riser height, operating pressure, wind speed, air temperature and relative humidity, diameter ratio and discharge ratio) were used as the input layer. The third model (ANN3) used a multivariate technique (PC1, PC2, and PC3). Results revealed that the ANN3 model had the highest coefficient of determination (R2 = 0.8349). The R2 values for the ANN1 and ANN2 models were 0.7792 and 0.4807, respectively. It can be concluded that the ANN3 model has the highest predictive capacity.
Keywords: sprinkler irrigation systems, neural networks, modelling, evaporation and drift losses
INTRODUCTION
The popularity of sprinkler irrigation systems is increasing in different parts of the world. Sprinkler systems are mainly used because of their high efficiency and flexibility in applying small amounts of water (Mohamed et al., 2016). The application of the right amount of water and the uniformity of distribution of water over the field are important issues for such systems (Michael, 1978). In an experiment on cumin using sprinkler and surface irrigation in Egypt, sprinkler irrigation reduced the amount of irrigation water by 47%, increased irrigation efficiency by 53%, and increased crop yield by 11% (Bondok and El-Sharkawy, 2014). Design and operation factors affect the performance of sprinkler irrigation systems. Operation factors include operational pressure at the nozzle, wind speed, air temperature, and relative humidity. Design factors include riser height, sprinkler type, number of nozzles, nozzle diameters, sprinkler spacing, and the design pressure and its variability (Fukui et al., 1980; Kincaid et al., 1996; Playan et al., 2005; Tarjuelo et al., 1999; Zapata et al., 2007).
During operation of a sprinkler irrigation system, a significant part of the water discharged by the system does not reach the crop canopy. This unaccounted-for water is referred to as 'wind drift and evaporation losses' (WDEL), and is expressed as a percentage of the gross volume of irrigation water. WDEL has been assessed using laboratory tests, field tests and different analyses. The first analysis of WDEL was published by Frost and Schwalen (1955, 1960). They developed a nomograph to estimate WDEL as a function of sprinkler characteristics, operating pressure, and climatic factors.
Several studies have been conducted to develop sprinkler irrigation simulation models that can be used to estimate water distribution patterns of irrigation systems under real or controlled conditions (Sayyadi et al., 2012). These models can minimize the use of field tests and can improve the design and management of sprinkler irrigation systems. Models often focus on irrigation uniformity, which is an important performance indicator commonly used in the design and evaluation of sprinkler irrigation systems. Pressure-nozzle relations, sprinkler heads and spacing, and wind conditions are key variables affecting uniformity.
Relevant efforts have been devoted to experimentally characterize WDEL under various operating conditions. These experiments are costly and time-consuming. Thus, modelling WDEL stands as an adequate approach. The artificial neural network (ANN) technique has proved capable of successfully addressing problems that differ widely in nature (Hota, 2014; Arif et al., 2012; Hardaha et al., 2012; Karasekreter et al., 2012; Ahmadaali et al., 2013; Nithya and Srinivasan, 2015; Da Rocha Neto et al., 2015). This is due to its ability to describe complex real-world problems, especially when the relationships between the dependent and independent variables are unclear. Moreover, the appeal of utilizing ANN also lies in its remarkable information processing characteristics, specifically, nonlinearity, high parallelism, fault tolerance, and learning and generalization capabilities (Basherr and Hajmeer, 2000). The most generally used type of neural network is the multilayer feedforward neural network (Balas et al., 2010).
The performance of an ANN usually depends on data representation. An important characteristic is that data is not correlated (Sratthaphut et al., 2013). In fact, correlated data reduce the distinctiveness of data representation and introduce confusion in the ANN model during the learning process (Mohamad-Saleh and Hoyle, 2008). In addition, many input variables may cause poor generalization performance (Pakath and Zaveri, 1995; Walczak and Cerpa, 1999). These problems can be solved by combining a feedforward neural network with principal component analysis (Zhang et al., 2006; He and Ma, 2010; Farajpour, 2012; Padma et al., 2014). Principal component analysis transforms the original dataset into a set of uncorrelated variables that capture all the variance of the original dataset (Dunteman, 1989). Wang et al. (2003) used a combination of neural networks and principal component analysis to enhance forecasting of air quality. Omid et al. (2010) used an approach based on combining principal component analysis and ANN to design an intelligent sorting system for pistachio nuts. Noori et al. (2010) also compared two common methods of ANN and principal component analysis to predict river flow.
The application of neural networks to sprinkler irrigation has received very little attention by the research community. As an example, a multilayer feedforward neural network with 2 input parameters (wind speed and wind direction) was employed by Sayyadi et al. (2012) to simulate the effects of wind on the distribution pattern of a single sprinkler under a centre pivot or block irrigation system. A multi-layer perceptron neural network with a back propagation-training algorithm was used; furthermore, 2 hidden layers (20 neurons in the first hidden layer and 6 neurons in the second hidden layer) and a tangent-sigmoid transfer function were utilized. The selected structure produced a coefficient of determination (R2) of 0.929 for the test subset. In another study by De Menezes et al. (2015), an ANN model used operating pressure, wind speed, wind direction, and sprinkler nozzle diameter to estimate the uniformity of a sprinkler irrigation system. Field trials were performed with one sprinkler operating in a grid of 16 × 16 collectors with spacing of 1.5 m and different combinations of nozzle diameters, pressure, and wind conditions. The ANN model showed adequate agreement with experimental data, with a correlation coefficient ranging from 0.92 to 0.97. Zhang and Qie (2007) applied a radial basis function neural network model to estimate sprinkler irrigation uniformity.
In this study, multilayer feedforward artificial neural networks and hybrid artificial neural networks with principal component analysis are introduced for the prediction of WDEL in a sprinkler irrigation system. Hybrid artificial neural networks utilize principal component analysis to enhance the overall performance of the multilayer feedforward neural network. Results were evaluated to examine the applicability of these models to the generation of accurate predictions of WDEL from a sprinkler irrigation system. Thus, this study aims to investigate the use of ANN combined with principal component analysis in modelling sprinkler irrigation performance.
MATERIALS AND METHODS
Field experiments site and procedures for sprinkler tests
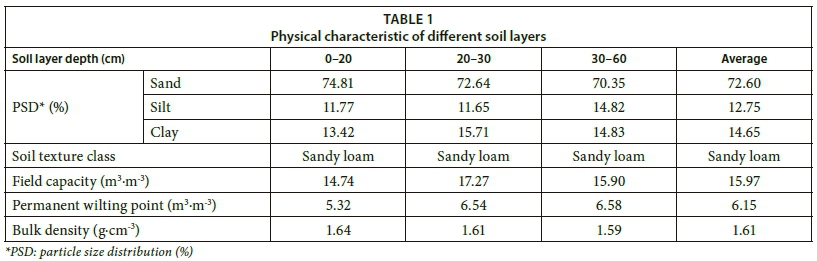
Field experiments were conducted at the experimental farm of the College of Food and Agriculture Sciences, King Saud University, Riyadh, (latitude: 24.67°N, longitude: 46.69° E), Saudi Arabia, during the period of February to April, 2017. Soil samples were randomly collected from the experimental sites at 0-60 cm depth and air dried, sieved through a 2.0 mm sieve, and taken for routine analysis (Page et al., 1982). The soil texture was sandy loam, and additional soil physical properties are presented in Table 1.
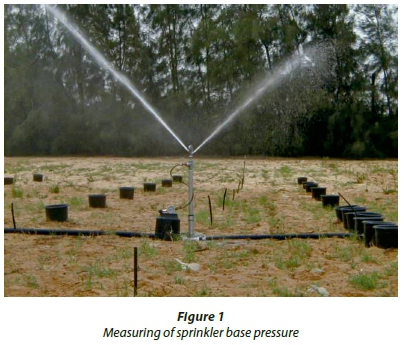
The experiments were executed in an area of 324 m2 (18 × 18 m) using an isolated sprinkler system. The brass impact sprinkler model RC130-BY (Riegos Costa, Lleida, Spain) (Note: The use of the trade name does not imply recommendation or endorsement of this product) was used in the experiments. It was installed 2 m above ground level using a riser pipe. The main and auxiliary nozzles were manufactured in plastic, and installed using a bayonet-type coupling. The auxiliary nozzle used in all tests had an internal diameter of 2.5 mm. The water discharged from the sprinklers was collected in pluviometers located in 4 lines and 6 perpendicular rows, with distances of 1.5 m between the line and 0.75 m between the containers (Fig. 1). The pluviometers were cylindrical, with a diameter of 230 mm and a height of 230 mm. Windbreak trees with lengths of 6-8 m were used to minimize the effect of the wind surrounding the experimental area. The experiments were conducted based on the recommendations of Merriam and Keller (1978) and the relevant International Standards: ASAE S330.1 (ASAE, 1987), ISO 7749/1 (ISO, 1995) and ISO 7749/2 (ISO, 1990).
Experiments were conducted at 3 different operating pressures (200, 300, and 400 kPa) with 3 main nozzle diameters (4.0, 4.5, and 5.0 mm). Each treatment was replicated 9 times, resulting in 81 experiments. Each experiment lasted for 30 min (irrigation time), plus the preparation and measuring time. A graduated glass cylinder was used to measure the water stored in each collector. Dead calm conditions could not be achieved, since the tests were performed under open-air conditions.
A manual valve and a manometer were installed at the head control of the experiment (Fig. 1) to control the operating pressure in the sprinkler. The operating pressure of the sprinkler was recorded using a pressure transducer model PS series (Gems Sensors Inc., Basingstoke, Hampshire, UK) connected to a data logger (E120, Dixon, Addison, IL, USA) installed in the pipe riser 200 mm below the sprinkler nozzles. Pressure data was recorded at a 5 min interval.
Wind speed, air temperature, and relative humidity were monitored by an automatic meteorological station located in a plot adjacent to the experimental site during the tests. A 3-cup rotor anemometer Series A-100 and a wind direction sensor model 024-L (Campbell Scientific Ltd., Shepshed, UK) were used to measure the wind speed and direction, respectively. A combined probe was used to measure the temperature and relative humidity (model CS-215, Campbell Scientific Ltd., Shepshed, UK). The meteorological variables were recorded every 5 min by a data-logger of model CR10X (Campbell Scientific Ltd, Shepshed, UK). For each test of the solid-set experiment, WDEL was assessed from the irrigation depth (ID) collected in the pluviometers. WDEL was estimated as the percentage of the water emitted by the sprinklers (IDe) but not collected inside the pluviometers (Dechmi et al., 2003; Playán et al., 2005; Sanchez et al., 2010a), according to the following equations:


where Q is the discharge (L·s-1), t is the operating time (s), and Ss and Sl are the side and lateral distances between two sprinklers, respectively. Q was assessed by collecting the water discharged by the sprinkler into a tared container. The discharge was calculated by dividing the weight of the collected volume by the time of filling.
Previous studies used for modelling of WDEL
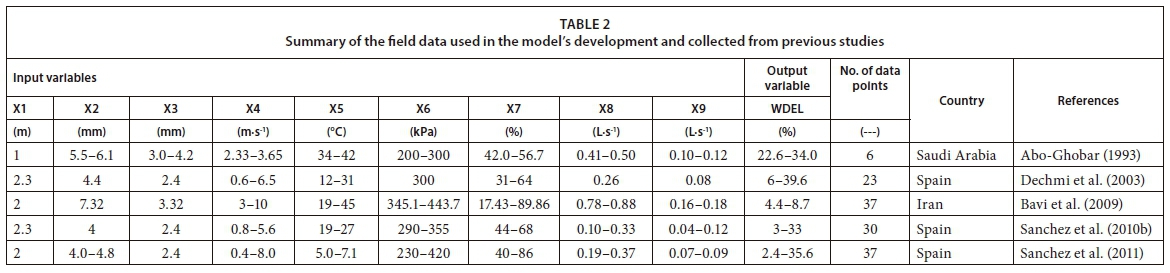
A WDEL ANN model was developed using 148 observations collected from 5 published datasets (Abo-Ghobar, 1993; Dechmi et al., 2003; Bavi et al., 2009; Sanchez et al., 2010b; Sanchez et al. 2011). From these studies, different parameters (riser height (X1), main nozzle diameter (X2), auxiliary nozzle diameter (X3), wind speed (X4), air temperature (X5), operating pressure (X6), relative humidity (X7), water discharge by main nozzle (X8) and water discharge by auxiliary nozzle (X9), were evaluated. A summary of the field data and no. of data points reported in these studies is presented in Table 2, along with the range in the experimental variables and the range of observed WDEL. Abo-Ghobar (1993) reported using 10 types of impact sprinklers of different nozzle diameters. The system was operated for 1 to 2 h per run, depending on the nozzle size, in order to collect a sufficient amount of water in the catch cans. Dechmi et al. (2003) used nozzle diameters of 4.4 mm (main) and 2.4 mm (auxiliary). The system was installed 2.30 m above ground level. The nozzle operating pressure was kept constant during the season at 300 kPa, and resulted in a wetted radius of 11 m. Bavi et al. (2009) used nozzle diameters of 7.32 mm (main) and 3.32 mm (auxiliary), and the riser was installed at 2 m above ground level. The system was operated at 3 pressure levels, of 345.1, 394.4, and 443.7 kPa. Sanchez et al. (2010b) used a main 4.0 mm main nozzle with a jet-straightening vane. The auxiliary nozzle was 2.4 mm in diameter. Sanchez et al. (2011) used a main nozzle of 4.0-4.8 mm. The sprinkler also included an auxiliary nozzle of 2.4 mm. An ample range of pressure, from 230 to 420 kPa, was tested. All tests lasted for 2 h and were performed under low wind conditions.
Modelling WDEL from a sprinkler
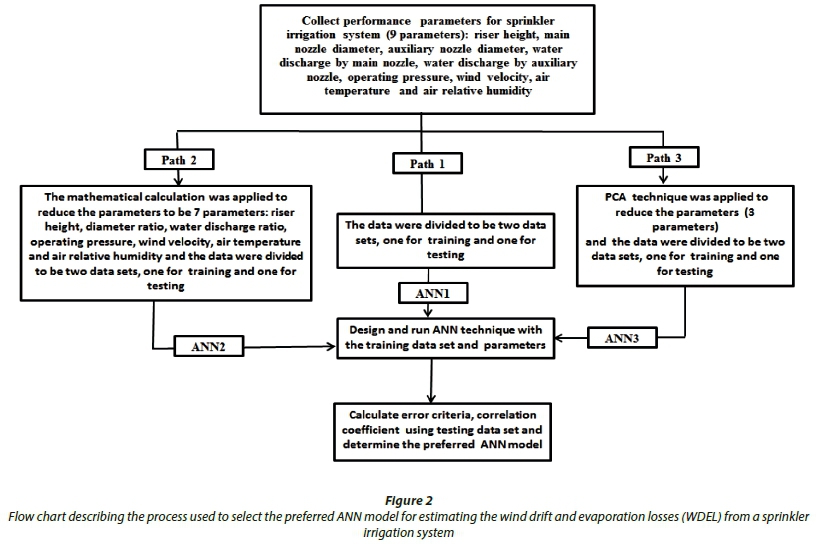
Three paths are described that are involved in the selection of an ANN model for the estimation of WDEL. These paths are presented in Fig. 2. Path 1 presented data describing the effect of the collected 9 parameters on the drift and evaporation losses. In Path 2, the mathematical calculation was applied to reduce the parameters to be 7 parameters: riser height, diameter ratio, water discharge ratio, operating pressure, wind velocity, air temperature and air relative humidity and the data were divided to create 2 datasets, 1 for training and 1 for testing. However, the diameter ratio (X10) and discharge ratio (X11), are as follows:
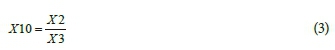

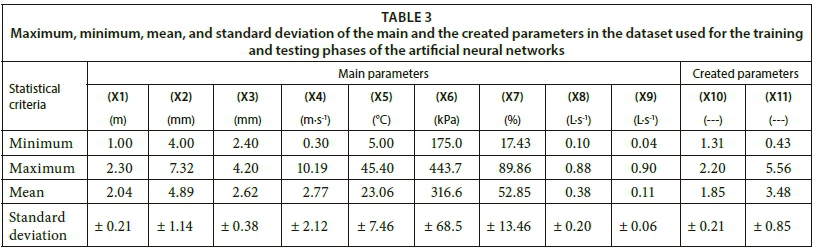
Table 3 illustrates the maximum, minimum, mean, and standard deviation of the main and the created parameters in the dataset used for the training and testing phases of the ANNs. However, in Path 3, the principal component analysis was applied to reduce the parameters to a set of 3 parameters. Then, an appropriate ANN model was developed that used different input variables to model WDEL. The estimates were compared to the original data, and error estimates and correlation coefficients were obtained for each method. The ANN model was selected that had a low error criteria and high correlation coefficients.
Principal component analysis (PCA)
PCA is a multivariate technique used to reduce the dimensions of a dataset consisting of a large number of interrelated variables, while retaining as much as possible of the variation present in the dataset (Sharma, 1996; Özkan and Mendeş 2004). This is achieved by transforming the set of original variables to a new set of variables, the principal components (PCs), which are ordered so that the first few retain most of the variation present in all of the original variables (Joliffe, 2002). As PCAs have been explained in detail elsewhere (Johnson and Wichern, 1982; Sharma, 1996), limited information about them will be provided in this section. However, transforming a p-dimensional vector XT = [X1, X2,…, Xp] into PCs designates an orthogonal rotation in p-space. Hence, a new vector can be obtained YT = [Y1, Y2,…,Yp] with elements that are uncorrelated, and with a decreasing variance from the first to last element. Each Yj, j = 1,…, p is a linear combination of Xj, j = 1,…, p with a vector of constants or weighting factors of aTj = [a1j, a2j,…, apj], j = 1,…., p, namely, Yj = a1jX1 + a2jX2 +…. + apjXp, j = 1,…, p.
The units of the variables could have an effect on PCA. Owing to differences in the units of variables used in PCA, the SPSS software (SPSS Inc., 2008) was used to pre-process the data according to the following formula:

where: Z are the original values of the input and output parameters, T is the normalized value, Z− is average value, and Sd is standard deviation. The correlation matrix of parameters was used to obtain the eigenvalues and weights of the variables (Mendeş, 2011). In this study, the PCA was performed on 9 parameters to rank their relative significance and to describe their interrelation patterns. The Kaiser-Meyer-Olkin (KMO) value was used to measure the sample adequacy, and the Bartlett's test of sphericity was applied to verify the applicability of PCA (Pallant et al., 2007). KMO is a measure of sampling adequacy that varies between 0 and 1, with values closer to 1 considered good and those below 0.50 considered unacceptable. The KMO value can be increased in many ways, such as increasing the sample size or increasing the number of variables. If the average correlations among the variables are high or the numbers of factors are diminished, the value of KMO becomes large (Hair et al., 2003). The Kaiser rule states that only those components or factors which have eigenvalues greater than 1 (Gaur and Gaur, 2006) should be selected. The Bartlett's sphericity test is used to test the null hypothesis that the correlation matrix is an identity matrix or all correlations are zero; the significance level of the Barttlet's test should also be lower than 0.05. In this study, PCs with eigenvalues greater than 1 were selected (Kaiser, 1960). Communalities measure the amount of variance that a variable shares with all the other variables in the analysis. This is also the proportion of each variable's variance explained by the principal components. It is also noted that the communality can be defined as the sum of squared factor (component) loadings. A large communality means a large amount of the variance in a parameter is extracted by the factor solution. In other words, parameters with high values are well represented in the common factor space while low value variables are not well represented (Malhotra, 2004). The eigenvalue is the variance explained by a component or factor. A low eigenvalue contributes little to the explanation of variances in the set of variables being analysed. The component matrix table shows the component loadings that are the correlations between the parameters and the components. The first component is generally more highly correlated with the variables than the second component and so on. Loadings above 0.5 were considered high, whereas those below 0.4 were considered low. PCA analysis was carried out using the SPSS software (SPSS Inc., 2008).
Artificial neural network (ANN)
The ANN has been used in sprinkler irrigation systems for the prediction of water distribution patterns. The back-propagation algorithm has emerged as one of the most widely used learning procedures for multilayer networks in the irrigation field (Sayyadi et al., 2012; De Menezes et al., 2015). In Fig. 3, a three-layer multi-input ANN model is presented; the corresponding structure is m-q-1, where m is the number of inputs, q is the number of neurons in the hidden layer, and 1 represents the one output unit. Let Xi (i = 1, 2,… m) denote the set of input vector of neurons, and Y denote the output of the network. Between the inputs and the output, there is a layer of processing units called hidden units. Zj (j = 1,2, … q) denotes the output of the hidden layer neurons, Wij is the weight that connects the node i in the input layer neurons to the node j in the hidden layer, Vj is the weight that connects the node j in the hidden layer neurons to the node in the output layer. Haykin (1999) gives the input of all neurons in the hidden layer

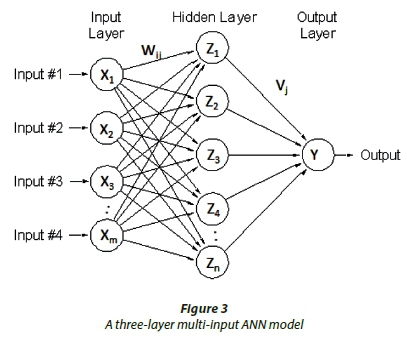
The output of hidden neuron is given by:

where θj is the threshold of neurons in the hidden layer. The sigmoid function in the hidden layer fH is selected in this study as the activation function. The output of the hidden layer is given as follows:

where θj is the threshold of neurons in the output layer and fH is the activation function in the output layer.
In this study, a feedforward artificial neural network model was developed. The model was built with the help of the commercially available QNET 2000 software (Vesta Services, 2000). This software supports a standard back-propagation algorithm for training purposes. QNET 2000 operates via a graphical user interface (GUI) that enables the user to load the training and test sets, design the network architecture, and feed values for the training parameters. The ANN models proposed in this study were supposed to be m-Hn1-1, which implies m neurons in the input layer. Hn1 is the number of neurons in the first hidden layer, and 1 represents the one neuron in the output layer. There were 9 neurons in the input layer for the ANN1 model and one in the output layer; 7 neurons in the input layer for the ANN2 model and one in the output layer; and 3 neurons in the input layer for the ANN3 model and one in the output layer. The whole dataset (229 data points) was randomly divided into 216 data points and 13 data points, for training and testing purposes, respectively.
At the beginning of the training process, the weights were initialized with a set of random values. The goal of learning is to determine a set of weights that will minimize the error function. As training proceeds, the weights are systematically updated according to a training rule. The ANN model with the highest correlation coefficient and lowest training error was selected as the best model. The optimal number of hidden neurons in the ANN was determined based on the trial-and-error method.
Evaluation of model predictive capacity
The coefficient of determination (R2), mean absolute error (MAE), and root mean square error (RMSE) were determined to assess the accuracy of the proposed models. The MAE and RMSE were determined as follows:

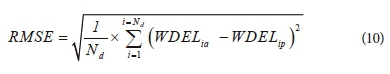
where WDELia and WDELip are actual and predicted wind drift and evaporation losses from a sprinkler irrigation system, respectively; Nd is the number of data points in the test dataset. MAE measures the average magnitude of errors in a set of forecasts without considering their direction.
RESULTS AND DISCUSSION
Results of principal component analysis
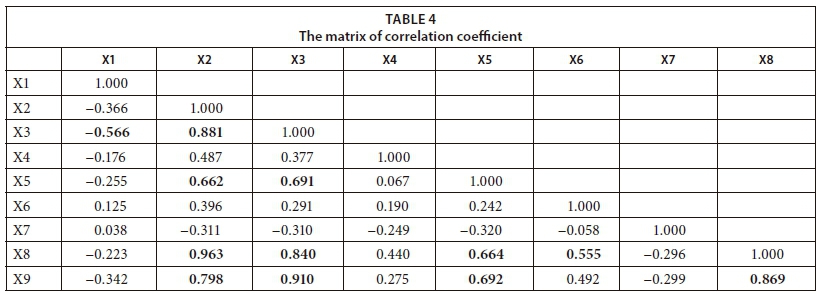
Table 4 shows the correlation coefficients of the nine parameters. The correlation coefficients are high; therefore, this study is proposing the PCA technique for two reasons: firstly, it removes the correlation among the independent parameters and, secondly, it reduces the number of parameters to a minimum (Ismail and Abdullah, 2016). The null hypothesis of the Bartlett's sphericity test is that the input variables are uncorrelated. This null hypothesis was rejected with a statistical significance of 5%. The Kaiser-Meyer-Olkin (KMO) parameter, a measure of sample adequacy, was found to be 0.588.
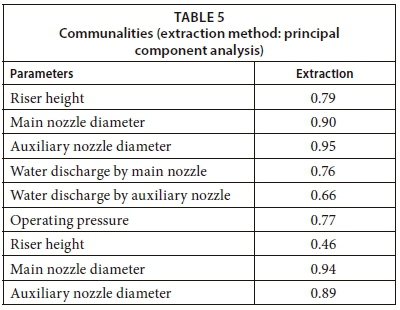
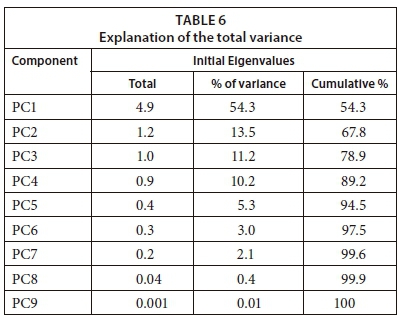
Initial communalities are estimates of the variance in each variable accounted for by all components or factors. For principal components extraction, this is always equal to 1.0 for correlation analyses (https://www.ibm.com) and, as shown in Table 5, variance ranges from 0.46 to 0.95 and can be reduced to factors. However, the initial eigenvalues for the first, second, and third components were 4.9, 1.2, and 1.0, respectively (Table 6). The percentage variance thus explained by each of the three components was about 54.3, 13.5, and 11.2, respectively, with a cumulative percentage of 78.9. The three selected PCs were fed to the proposed ANN prediction model to estimate WDEL.
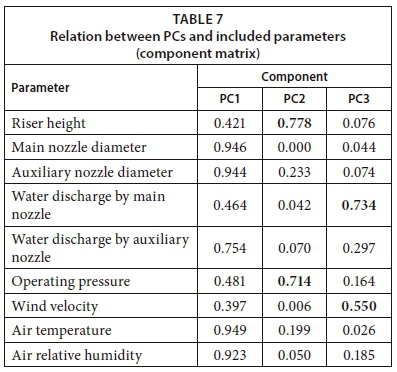
As shown in Table 7, the first component had high loadings (highlighted in bold) for 5 parameters, namely, main nozzle diameter, auxiliary nozzle diameter, water discharge by the auxiliary nozzle, air temperature, and air relative humidity. For the second component, riser height and operating pressure were strongly associated. For the third component, water discharge by the main nozzle and wind velocity were strongly associated. Although there are many criteria for selecting components, for the output analysis, only 3 components were selected based on the Kaiser criterion. The component score coefficient matrix of the first 3 factors that were used in the ANN model is shown in Table 8.
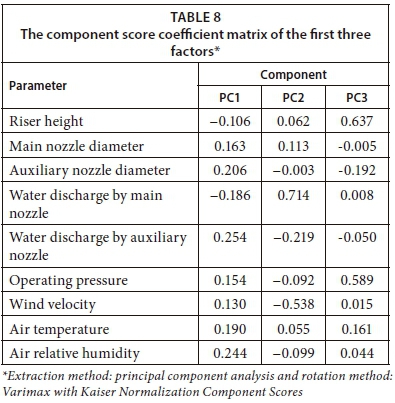
The composite score F, that is, the sum of the product of each factor and its contribution to the total variance, is:

Results of wind drift and evaporation losses from a sprinkler irrigation system by ANN models
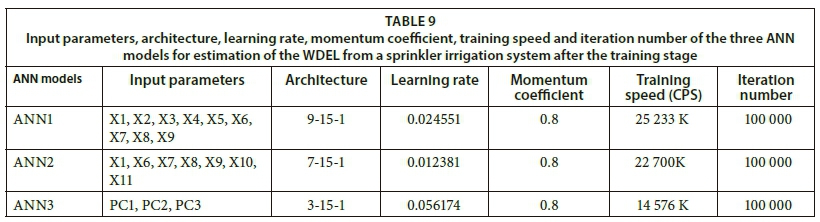
After testing various ANN architectures by varying the activation function, number of hidden units, and number of neurons in the hidden layers, the MLP (multilayer perceptron) with the sigmoid activation function produced the best prediction values of all three tested ANN models. The training results of the three ANN models are presented in Table 9 and Table 10. The mean absolute error, root mean square error, and coefficient of determination of the three ANN models in estimating the WDEL from a sprinkler irrigation system after the testing stage are presented in Table 11. The predictive capacity of each model is evaluated by its error values, as shown in Table 11 and Fig. 4.
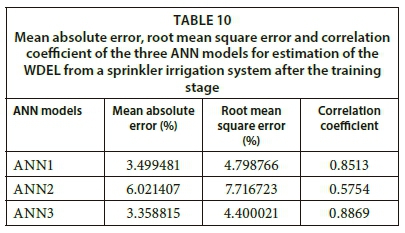
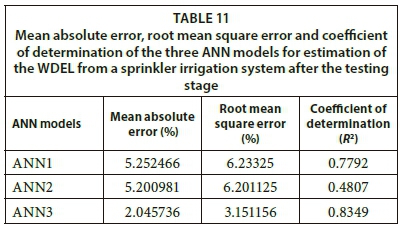
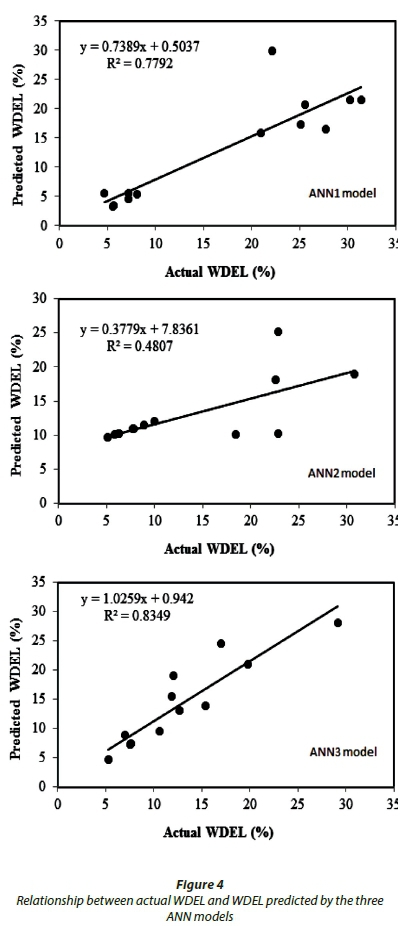
ANN3 showed the lowest MAE and RMSE and the highest R2, followed by ANN1. The training speed was highly dependent on the number of input variables, and was the highest in ANN1 (25 233 K), followed by ANN2 (22 700 K) and ANN3 (14 576 K), while the lowest training speed was observed in ANN3. As the accuracy of ANN3 in predicting WDEL was higher than the accuracy of ANN1 and ANN2, it can be concluded that ANN3 (with PCs as input variables) contributes to reducing the training speed. These results indicate that ANN3 is the most efficient among the three tested models.
CONCLUSIONS
The accuracy in predicting WDEL is important for the design of sprinkler irrigation systems. This study has demonstrated that an accurate prediction of WDEL can be obtained with a hybrid approach combining PCA and ANN. The goal of utilizing this combination was to capture different patterns of the independent variables. The PCR-ANN model provided a better result than the ANN model based on the selected parameters. This combination method is to be recommended because it improved the prediction of WDEL. Hybrid combinations may have other applications in the irrigation field.
ACKNOWLEDGMENTS
The authors offer sincere thanks and appreciation to the Deanship of Scientific Research, King Saud University, Saudi Arabia, for supporting this research effort.
REFERENCES
ABO-GHOBAR HM (1993) Evaporation and drift losses from sprinkler irrigation systems under hot and dry conditions. J. King Saud Univ. Agric. Sci. 5 (2) 153-164. [ Links ]
AHMADAALI K, LIAGHAT AM, HEYDARI N and HADDAD OB (2013) Application of artificial neural network and adaptive neural-based fuzzy inference system techniques in estimating of virtual water. Int. J. Comput. Appl. 76 12-19. https://doi.org/10.5120/13250-0715 [ Links ]
ARIF C, MIZOGUCHI M, SETIAWAN BI and DOI R(2012) Estimation of soil moisture in paddy field using artificial neural networks. Int. J. Adv. Res. Artif. Intell. 1 17-21. https://doi.org/10.14569/IJARAI.2012.010104 [ Links ]
ASAE (1987) Procedure for sprinkler distribution testing for research purposes. ASAE, St. Joseph, MI, USA. 487-489. [ Links ]
BALAS CE, KOÇ, ML and TÜR R (2010) Artificial neural networks based on principal component analysis, fuzzy systems and fuzzy neural networks for preliminary design of rubble mound breakwaters. Appl. Ocean Res. 32 425-433. https://doi.org/10.1016/j.apor.2010.09.005 [ Links ]
BASHERR IA and HAJMEER M (2000) Artificial neural networks: fundamentals, computing, design, and application. J. Microbiol. Meth. 43 3-31. https://doi.org/10.1016/S0167-7012(00)00201-3 [ Links ]
BAVI A, KASHKULI HA, BOROOMAND S, NASERI A and ALBAJI M (2009) Evaporation losses from sprinkler irrigation system under various operating conditions. J. Appl. Sci. 9 795-600. https://doi.org/10.3923/jas.2009.597.600 [ Links ]
BONDOK, MY and EL-SHARKAWY AF (2014) Management of sprinkler irrigation system for cumin in old valley. Egypt. J. Agric. Res. 92 1047-1062. [ Links ]
DA ROCHA NETO OC, DOS S, TEIXEIRAA, DE S BRAGAAP, DOS SANTOSCC and DE O LEÃORA (2015) Application of artificial neural networks as an alternative to volumetric water balance in drip irrigation management in watermelon crop. J. Braz. Assoc. Agric. Eng. 35 266-279. https://doi.org/10.1590/1809-4430-Eng.Agric.v35n2p266-279/2015 [ Links ]
DE MENEZES PL, DE AZEVEDO CAV, EYNG E, NETO JD and DE LIMA VLA (2015) Artificial neural network model for simulation of water distribution in sprinkle irrigation. Rev. Bras. Eng. Agríc. Ambient. 19 817-822. https://doi.org/10.1590/1807-1929/agriambi.v19n9p817-822 [ Links ]
DECHMI F, PLAYAN E, CAVERO J, FACI JM and MARTANEZ-COB A (2003) Wind effects on solid set sprinkler irrigation depth and yield of maize (Zea mays). Irrig. Sci. 22 67-77. https://doi.org/10.1007/s00271-003-0071-9 [ Links ]
DUNTEMAN GH (1989) Principal Component Analysis. Sage Publications, Newbury Park. https://doi.org/10.4135/9781412985475 [ Links ]
FARAJPOUR G (2012) Forecasting postage traffic using principal component analysis and artificial neural network. Afr. J. Bus. Manage. 6 9496-9503. https://doi.org/10.5897/AJBM12.038 [ Links ]
FROST KR and SCHWALEN HC (1955) Sprinkler evaporation losses. Agric. Eng. 36 526-528. [ Links ]
FROST KR and SCHWALEN HC (1960) Evapotranspiration during sprinkler irrigation. Trans. ASAE 3 18-20, 24. https://doi.org/10.13031/2013.41072 [ Links ]
FUKUI Y, NAKANISHI K and OKAMURA S (1980) Computer evaluation of sprinkler irrigation uniformity. Irrig. Sci. 2 23-32. https://doi.org/10.1007/BF00285427 [ Links ]
HAIR J F, ANDERSON RE, TATHAM RL and BLACK WC (2003) Multivariate Data Analysis. Pearson Education, Singapore and India. [ Links ]
HARDAHA MK, CHOUHAN SS and AMBAST SK (2012) Application of artificial neural network in prediction of response of farmers' water management decisions on wheat yield. J. Indian Water Resour. Soc. 32 1-12. [ Links ]
HAYKIN S (1999) Neural Networks. A Comprehensive Foundation. Prentice Hall International Inc., New Jersey. [ Links ]
HE F and MA C (2010) Modeling greenhouse air humidity by means of artificial neural network and principal component analysis. Comput. Electron. Agric. 71 19-23. https://doi.org/10.1016/j.compag.2009.07.011 [ Links ]
HOTA SK (2014) Artificial neural network and efficiency estimation in rice yield. Int. J. Innov. Res. Sci. Eng. Technol. 3 14787-14805. [ Links ]
ISMAIL N and ABDULLAH S (2016) Principal component regression with artificial neural network to improve prediction of electricity demand. Int. Arab J. Inf. Technol. 13 196-202. [ Links ]
ISO (1990) Agricultural irrigation equipment. Rotating sprinklers. Part 2. Uniformity of distribution and test methods. ISO standard 7749/2. ISO, Geneva. [ Links ]
ISO (1995) Agricultural irrigation equipment. Rotating sprinklers. Part 1. Design and operational requirements. ISO standard 774 9/1. ISO, Geneva. [ Links ]
JOHNSON RA and WICHERN DW (1982) Applied Multivariate Statistical Analysis (5th edn). Prentice Hall, Upper Saddle River, NJ. [ Links ]
JOLIFFE I (2002) Principal Component Analysis (2nd edn). Springer, New York. [ Links ]
KAISER HF (1960) The application of electronic computers to factor analysis. Educ. Psychol. Meas. 20 141-151. https://doi.org/10.1177/001316446002000116 [ Links ]
KARASEKRETER N, BAŞÇIFTÇI F and FIDAN U (2012) A new suggestion for an irrigation schedule with an artificial neural network. J. Exp. & Theor. Artif. Intell. 25 1-12. [ Links ]
KINCAID DC, SOLOMON KH and OLIPHANT JC (1996) Drop size distributions for irrigation sprinklers. Trans. ASAE 39 839-845. https://doi.org/10.13031/2013.27568 [ Links ]
MALHOTRA NK (2004) Marketing Research - An Applied Orientation. Pearson Education, Singapore and India. [ Links ]
MENDEŞ M (2011) Multivariate multiple regression analysis based on principal component scores to study relationships between some pre- and post-slaughter traits of broilers. J. Agric. Sci. 17 77-83. [ Links ]
MERRIAM JL and KELLER J (1978) Farm irrigation system evaluation: A guide for management. Dept. of Agricultural and Irrigation Engineering, Utah State Univ., Logan, Utah. [ Links ]
MICHAEL AM (1978) Irrigation Theory and Practice. Viskas Publishing House PVTLTD, New Delhi. 448-584 [ Links ]
MOHAMAD-SALEH J and HOYLE BS (2008) Improved neural network performance using principal component analysis on Matlab. Int. J. Comput. Internet Manage. 16 1-8. [ Links ]
MOHAMED AE, ALI AM, ADAM AB and MOHAMED ZY (2016) Effect of different patterns and types of heads on the performance of a portable sprinkler irrigation system. Palgo J. Agric. 3 212-217. [ Links ]
NITHYA R and SRINIVASAN R (2015) Maximization of crop yield based on water management using artificial neural network. Int. J. Sci. Eng. Technol. Res. 4 2501-2505. [ Links ]
NOORI R, KHAKPOUR A, OMIDVAR B and FAROKHNIA A (2010) Comparison of ANN and principal component analysis multivariate linear regression models for predicting the river flow based on developed discrepancy ratio statistic. Expert Syst. Appl. 37 5856-5862. https://doi.org/10.1016/j.eswa.2010.02.020 [ Links ]
OMID M, MAHMOUDI A and OMID MH (2010) Development of pistachio sorting system using principal component analysis assisted artificial neural networks of impact acoustics. Expert Syst. Appl. 37 7205-7212. https://doi.org/10.1016/j.eswa.2010.04.008 [ Links ]
ÖZKAN M M and MENDEŞ M (2004) Empirical table values of Eigen values for different variable numbers and sample size combinations. Pak. J. Biol. Sci. 7 870-878. https://doi.org/10.3923/pjbs.2004.870.878 [ Links ]
PADMA K, SAMUEL SELVARAJ R, ARPUTHARAJ S and MILTON BOAZ B (2014) Improved artificial neural network performance on surface ozone prediction using principal component analysis. Int J. Curr. Res. Rev. 6 1-6. [ Links ]
PAKATH R and ZAVERI JS (1995) Specifying critical inputs in a genetic algorithm-driven decision support system: an automated facility. Decis. Sci. 26 749-779. https://doi.org/10.1111/j.1540-5915.1995.tb01574.x [ Links ]
PALLANT J, CHORUS, I and BARTRAM J (2007) Toxic Cyanobacteria in Water, SPSS Survival Manual. McGraw Hill, New York. [ Links ]
PLAYAN E, SALVADOR R, FACI J M, ZAPATA N, MARTINEZ-COB, A and SANCHEZ I (2005) Day and night wind drift and evaporation losses in sprinkler solid-sets and moving laterals. Agric. Water Manage. 76 139-159. https://doi.org/10.1016/j.agwat.2005.01.015 [ Links ]
SANCHEZ I, FACI JM and ZAPATA N (2011) The effects of pressure, nozzle diameter and meteorological conditions on the performance of agricultural impact sprinklers. Agric. Water Manage. 102 13-24. https://doi.org/10.1016/j.agwat.2011.10.002 [ Links ]
SANCHEZ I, ZAPATA N and FACI JM (2010a) Combined effect of technical, meteorological and agronomical factors on solid-set sprinkler irrigation: I. Irrigation performance and soil water recharge in alfalfa and maize. Agric. Water Manage. 97 1571-1581. https://doi.org/10.1016/j.agwat.2010.05.012 [ Links ]
SANCHEZ I, ZAPATA N and FACI JM (2010b) Combined effect of technical, meteorological and agronomical factors on solid-set sprinkler irrigation. II. Modifications of the wind velocity and of the water interception plane by the crop canopy. Agric. Water Manage. 97 1591-1601. https://doi.org/10.1016/j.agwat.2010.05.013 [ Links ]
SAYYADI H, SADRADDINI AA, ZADEH DF and MONTERO J (2012) Artificial neural networks for simulating wind effects on sprinkler distribution patterns. Span. J. Agric. Res. 10 1143-1154. https://doi.org/10.5424/sjar/2012104-445-11 [ Links ]
SHARMA S (1996) Applied Multivariate Techniques. John Wiley & Sons, Inc., Canada. [ Links ]
SPSS INC (2008) Released 2008. SPSS Statistics for Windows, Version 17.0. Chicago: SPSS Inc. [ Links ]
SRATTHAPHUT L, JAMRUS S, WOOTHIANUSORN S and TOYAMA O (2013) Principal component analysis coupled with artificial neural networks for therapeutic indication prediction of Thai herbal formulae. Silpakorn Univ Sci. Technol. J. 7 41-48. [ Links ]
TARJUELO JM, MONTERO J, CARRION PA, HONRUBIA FT and CALVO A (1999) Irrigation uniformity with medium size sprinklers part II: influence of wind and other factors on water distribution. Trans. ASAE. 42 677-690. https://doi.org/10.13031/2013.13229 [ Links ]
VESTA SERVICES INC (2000) Qnet2000 Shareware, Vesta Services, Inc., 1001 Green Bay Rd STE 196 Winnetka IL 60093. [ Links ]
WALCZAK S and CERPA N (1999) Heuristic principles for the design of artificial neural networks. Inf. Softw. Technol. 41 107-17. https://doi.org/10.1016/S0950-5849(98)00116-5 [ Links ]
WANG W, XU Z and LU JW (2003) Three improved neural network models for air quality forecasting. Eng. Comput. 20 192-1.. https://doi.org/10.1108/02644400310465317 [ Links ]
ZAPATA N, PLAYAN E, MARTINEZ-COB A, FACI JM and LECINA S (2007) From on-farm solid-set sprinkler irrigation design to collective irrigation network design in windy areas. Agric. Water Manage. 87 187-199. https://doi.org/10.1016/j.agwat.2006.06.018 [ Links ]
ZHANG Y, LI H, HOU A and HAVEL J (2006) Artificial neural networks based on principal component analysis input selection for quantification in overlapped capillary electrophoresis peaks. Chemometr. Intell. Lab. 82 165-175. https://doi.org/10.1016/j.chemolab.2005.08.012 [ Links ]
ZHANG Z and QIE Z (2007) The calculation of sprinkler irrigation uniformity based on radial basis function neural network and the optimization of sprinkler combination spacing. Proc. 2007 International Conference on Agricultural Engineering 5 116-120. [ Links ]
Received 3 July 2017
accepted in revised form June 2018
* To whom all correspondence should be addressed. e-mail: samarey@ksu.edu.sa

