


Services on Demand
Article
 English (pdf)
 Article in xml format
 Article references
Indicators

Related links
-
 Cited by Google
 -
 Similars in Google
Share

 Permalink
Water SA
On-line version ISSN 1816-7950
Print version ISSN 0378-4738
Water SA vol.44 n.2 Pretoria Apr. 2018
http://dx.doi.org/10.4314/wsa.v44i2.15
ORIGINAL ARTICLES
Climate trends across South Africa since 1980
Mark R JuryI, II, *
IPB X1001, Geography Dept, University of Zululand, KwaDlangezwa, South Africa
IIPhysics Dept, University of Puerto Rico Mayagüez, USA
ABSTRACT
Observed and simulated climate trends across South Africa in the period 1980-2014 are studied. Observed CRU3/CAMS (Climate Research Unit v3 / Climate Analysis and Monitoring System) air temperatures have increased by 0.02°C-yr-1 while NOAA/SODA sea temperatures have risen by 0.03°Gyr-1 in the Agulhas Current. A poleward expansion of the South Atlantic high in NCEP2/MERRA (National Center for Environmental Prediction v2 / Modern-Era Retrospective analysis for Research and Applications) has produced a trend toward south-easterly flow which contributes to a moist-east/dry-west pattern. Observed CHIRPS2 rainfall and NDVI vegetation fraction show no appreciable trend except near Cape Town where drier conditions in the period 1980-2014 correspond with enhanced coastal upwelling. CMIP5 model projections for rainfall up to 2050 reflect drying, except in the eastern coastal plains. While inter-annual fluctuations of South African rainfall overshadow linear trends, temperature increases account for 32% of observed variance.
Keywords: South Africa, climate change, satellite era
INTRODUCTION
The semi-arid climate of South Africa is shaped by its plateau topography, sub-tropical latitude and the Agulhas and Benguela ocean currents. The low level zonal circulation alternates seasonally and rainfall fluctuations are influenced by the Pacific El Nino Southern Oscillation (ENSO) and adjacent South Atlantic and Indian Ocean sea surface temperatures (SST). Apart from external forcing, moisture is internally recycled via surface fluxes and local overturning circulations (Chikoore and Jury, 2010). There is feedback between land use, vegetation cover, soil evaporation and increasing CO2 (Ainsworth and Rogers, 2007; Leakey et al., 2009), which numerical models can resolve.
Understanding trends in climate can assist resource management and determine possible economic impacts. Past research has found trends -+0.02°C-yr-1 in observed temperature (Kruger and Shongwe, 2004; Morishima and Akasaka, 2010; Jury, 2013) consistent with the global average, but trends in rainfall are weak and heterogeneous (Tadross et al., 2005; MacKellar et al., 2014; Kruger and Nxumalo, 2017). Although century-long meteorological measurements exist, coverage is uneven and instrument/station changes could affect trend estimates. Reanalysis systems that augment surface observations with other measurements and satellite estimates can limit the effects of station uncertainties and provide a more reliable means for evaluating trends since 1980. Climate observations, data assimilation, historical reanalysis and coupled general circulation models (cGCM) are constantly improving (Meehl et al., 2007; Taylor et al., 2012); thus explorations of new data for observed and projected trends may provide new and better constrained information on which strategic adaptation and mitigating actions can be based.
Nowadays, cGCM are the main tool for estimating the future climate under rising greenhouse gases. To be included in the Intergovernmental Panel for Climate Change (IPCC) assessment, cGCM must demonstrate skill in replicating the past global climate, its annual cycle, key circulations and observed trends. If an ensemble of cGCM simulations of the past forced by increasing greenhouse gases fits an observed trend in surface air temperature, then their evolution is probably associated with anthropogenic emissions. Outputs between cGCM may diverge due to model physics and spatial resolution (typically -1.7°), notwithstanding uncertainties in initial baseline and forcing data.
The main objective of this research was to quantify the rate and pattern of observed climate trends during the satellite era (1980-2014) over South Africa and its ocean margins. A second objective was an inter-comparison with trends resulting from an ensemble average of cGCM outputs prepared for the IPCC. Century-long climate trends in diverse cGCM have been evaluated for southern Africa in Jury (2013); here the analysis starts in 1980 so as to exploit the stabilizing impact of satellite observations on reanalyses. In addition, the spatial domain is confined to South Africa and the data resolution (< 50 km) enables understanding of mesoscale features. The following sections outline the data and analysis methods utilized to generate trend estimates. Results are given with emphasis on spatial patterns and area-averages of trends during the satellite era over South Africa and its ocean margins, derived from observation, hindcast reanalyses, and model simulations, followed by area-averaged temporal trends during the satellite era and from cGCM projections out to 2050. The final section summarizes the results.
DATA AND METHODS
South Africa and its ocean margins are well observed with numerous regularly reporting national meteorological stations of the national meterorological services and busy shipping lanes (Fig. 1a,b). Satellites provide global coverage and modern reanalysis systems blend these observations with in-situ data since 1980, and thus offers a 35-yr history of climate evolution for the evaluation of trends during a time when global greenhouse gases rose by 2 ppm-yr1, and local emissions increased commensurately (Semazzi and Song, 2001; Sinha et al., 2003; DEAT, 2009).
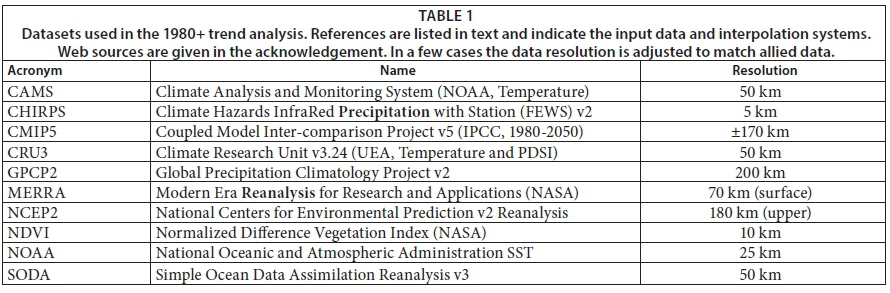
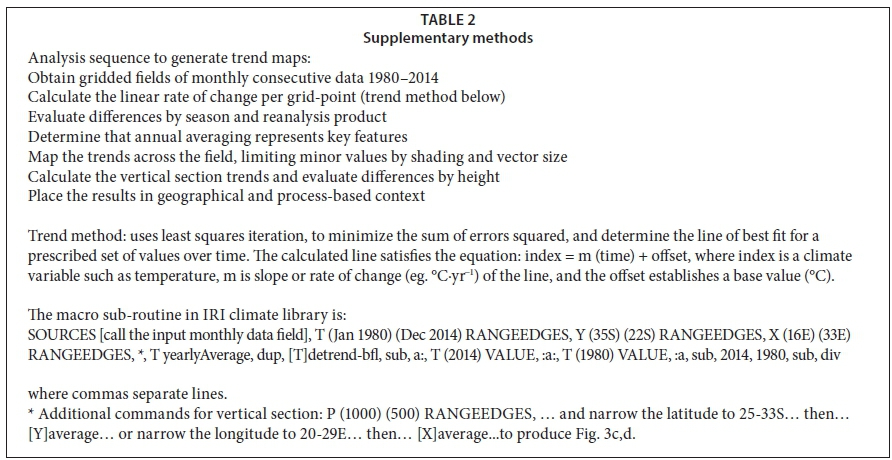
The monthly-averaged reanalysis products employed here (cf. Table 1) include: CHIRPS(2) rainfall (Huffman et al., 2009; Funk et al., 2014); CRU3 and CAMS temperature (Mitchell and Jones, 2005; Fan and Van den Dool, 2008) and CRU3 Palmer Drought Severity Index (Harris et al., 2013); NCEP(2) and NASA MERRA atmosphere (Kanamitsu et al., 2002; Rienecker et al., 2011, respectively); SODA ocean (Carton and Geise, 2008); NOAA sea surface temperature (SST; Reynolds et al., 2007); NASA GIMMS and NOAA NESDIS vegetation fraction (Tucker et al., 2005). Table 1 lists the acronyms, resolution and source of these datasets, and the aforementioned references cover how the data are blended and validated (Harris et al., 2013). For purposes of trend analysis, all data were annually averaged, given that preliminary research found that changes tend to be evenly spread over the year. The linear trends over the period 1980-2014 are mapped over the South Africa area 35°-22°S, 16°-33°E, which includes the continental area between the Benguela and Agulhas Currents. The trends for U and V wind components were determined separately and combined into vector maps for the surface and the 700 hPa levels. Trends in the vertical profiles of SODA ocean temperature and zonal current component were averaged over the marginal seas. Trends in NCEP2 three-dimensional winds and air temperature were also analysed for a vertical cross-section over South Africa up to 500 hPa. For area-averaged data, the r2 fit of the trend to the annual time series was calculated. For guidance, the statistical significance at 95% confidence is reached with r2 fit > 10.5% observed and > 5.4% projected, with 33 and 69 degrees of freedom respectively. The spatial analysis uses neutral shading for weak trends. In the case of multiple products for observed temperature, rainfall and vegetation, the trend from difference datasets is averaged. Table 2 provides a summary of methods to calculate the trend maps and sections. Appendix Fig. A1, A2 compares area-averaged rainfall and temperature from CMIP5 models, reanalysis and observations.
Trend estimates depend on record length and - for reanalyses - the data assimilation scheme (Bosilovich et al., 2008, Chaudhuri et al., 2013). The MERRA and ECMWF (interim) atmospheric reanalyses show similar trends (Kennedy et al., 2011, Decker et al., 2012) and yield comparable turbulent fluxes over South Africa. Station-based gridded products such as CAMS and CRU3 use a Cressman algorithm to interpolate data according to station proximity, climatology and elevation; while CHIRPS uses METEOSAT radiance patterns and a dynamical model (CFS, Saha et al., 2010) to interpolate gauge measurements. These techniques limit the impact of poor quality or missing data. Because the analysis presented here starts in 1980, discontinuities caused by introduction of satellite data are limited (Hurrell et al., 2000, Fan and Van den Dool, 2008; Mayer and Haimberger, 2012).
The South Africa Weather Service maintains a dense station network (Fig. 1a,b) of temperature, rainfall, wind, humidity, and solar radiation measurements. In the lower atmosphere, 12 operational radiosonde stations and many commercial aircraft profiles allow the mapping of circulation trends. The coastal waters of South Africa are covered by long-term dense and persistent observations from commercial and research ships, which are assimilated into the SODA ocean reanalysis with sea surface height measurements from stations and satellite, to quantify transport in the Benguela and Agulhas Currents.
Outputs from a 17-member ensemble of CMIP5 models in the IPCC database (Taylor et al., 2012) were analysed over South Africa (35°-22°S, 16°-33°E, land only) for the period 1980-2050. The models used here were forced by the 'moderate' RCP6 scenario (Van Vuuren et al., 2011), and overlap the observations in the first 30 years. Area-averages and the mean annual cycle were computed and trends were estimated for 2 m air temperature and rainfall. Trends were also spatially mapped and compared with observed trends from GPCP2 rainfall estimates (Adler et al., 2003). Although cGCM trends are forced primarily by rising greenhouse gases, there are secondary influences from multi-decadal oscillations (Jury, 2014) and model initialization (Poccard et al., 2000). To provide a wider regional context, NCEP2 surface pressure and wind trends were also analysed over a broader region extending across the adjacent oceans into the mid-latitudes (cf. Fig. 7). While the scope of work excludes validation, the Appendix covers the spread of CMIP5 projections.


RESULTS
Observation-based trend maps
Surface air temperature in the CAMS-CRU3 ensemble reanalysis increases by up to 0.03°C-yr1 (Fig. 1c). The rate of warming is greater over the northern tier of South Africa and in the west near Cape Town, consistent with Kruger and Shongwe (2004). Trends are much less over the plateau south of 27°S and the east-facing coast (Port Elizabeth to Durban). This area of near-zero trend is supported by sufficient station density (Fig. 1a) and may relate to circulation trends as described below.
Rainfall trends in the CHIRPS-CRU3 map (Fig. 1d) are small. Slight increases are noted across the interior, while drying prevails over the southwest coastal mountains (Cape Town) and near Polokwane (25°S, 29°E. The rainfall trend is overshadowed by inter-annual fluctuations related to ENSO (Dieppois et al., 2015).
Surface winds become more easterly (Fig. 2a) due to a poleward shift of the South Atlantic high. Easterly trends also prevail across Namibia; however, at about 30°S over the plateau, westerlies have increased. There is a trend for offshore flow over the Western Cape (34°S, 20°-26°E) that contributes to warm and dry trends there. Over the east-facing coast (30°-32°S, 29°-32°E) the surface wind trends are onshore from the southeast, so temperature trends are small and rainfall may increase here due to cyclonic and orographic lift. Key features in the 700 hPa layer (Fig. 2b) are north-easterly trends across the interior and southeasterly trends over Cape Town (34°S, 18°E). Westerly trends are confined to the southern escarpment 31°S, 28°E (Lesotho). The wind trend maps reflect a poleward shift of the sub-tropical anti-cyclonic ridge (South Atlantic high).
Trend maps and upper air sections
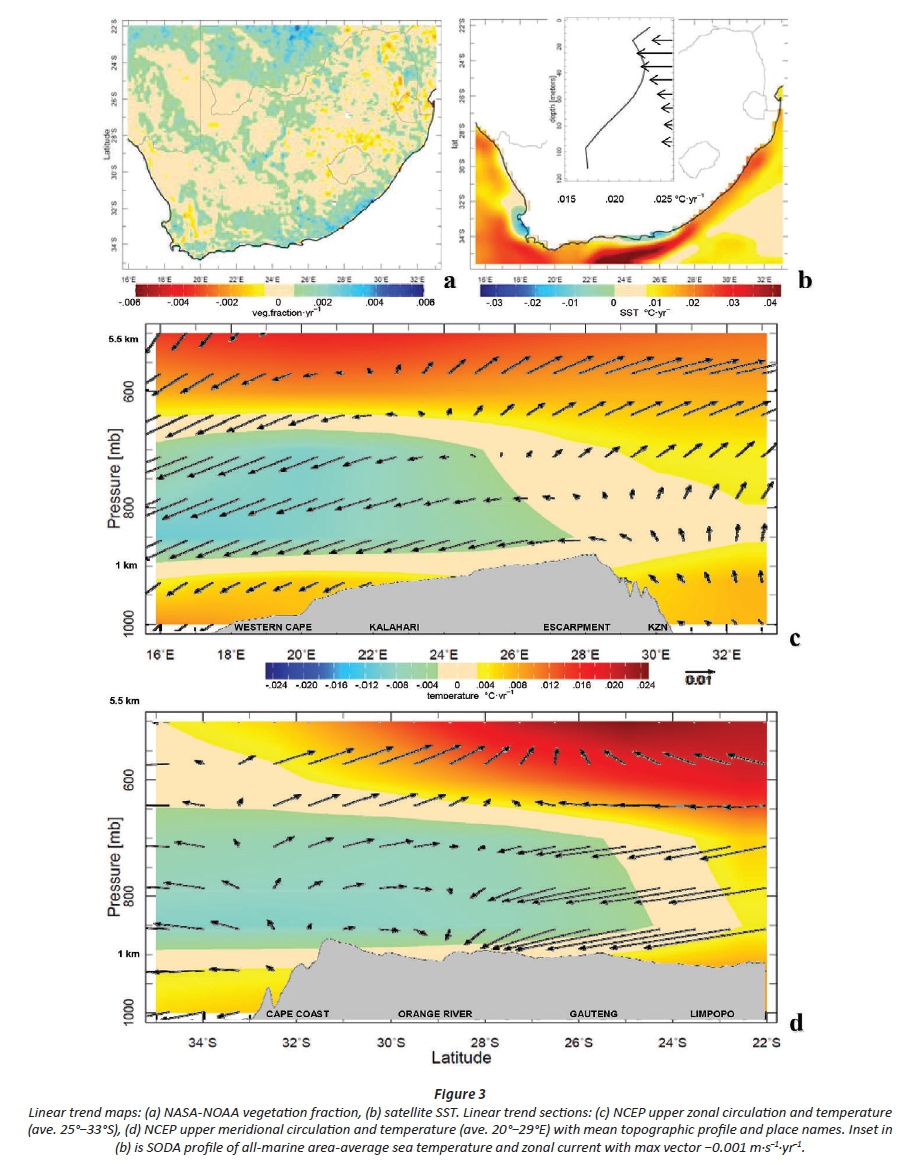
The vegetation fraction has increased (Fig. 3a) in areas with rising rainfall and onshore flow, commensurate with accelerated photosynthesis (Olsson et al., 2005, Fensholt et al., 2012). There are localized down-trends over the escarpment (Bekker et al., 2008; V an Wilgen, 2009; Josipovic et al., 2011). Over the Eastern Cape coastal belt (33°S, 28°E) the vegetation increase coincides with a trend towards south-easterly winds, a long-term wet trend (Kruger and Nxumalo, 2017) and little change in air temperature. The SST is warming by 0.03°C-yr-1 off the shelf in the Agulhas Current (Fig. 3b) consistent with Rouault et al. (2010). Most of this warming happens in the upper 60 m where near-shore currents from the warm Indian Ocean are increasing, consistent with Biastoch et al. (2009) and Beal et al. (2011). In contrast, the coast near Port Elizabeth and Cape Town exhibits decreasing SST due to increasing easterly winds which favour upwelling (cf. Fig. 2a).
Trends in vertical section (Fig. 3c,d) are dominated by a subsident easterly circulation over the Western Cape and Kalahari 16°-22°E (Fig. 3c). Over the escarpment there are westerly wind trends and rising motions, evident in longitudes 28°-33°E, tilt westward with height. There is a wedge of declining air temperatures in the 850-700 hPa layer in the west (also noted in MERRA and ECMWF atmospheric reanalyses, not shown). This cool wedge extends from the south (Fig. 3d) and can be attributed to advection on the eastward flank of a strengthening South Atlantic high. Northerly wind trends in the north subside in the lower layers and rise in the upper layers, and trends are rising at 500 hPa around 27°S. Warming is seen above 600 hPa in the northwest part (upper left) of these sections. The reader may understand these trends in context of the mean circulation given in Jury (2012).
Trend maps for secondary variables
In Fig. 4a-f trend maps of South Africa's changing climate are given. MERRA skin temperatures near the coast reflect the Agulhas Current warming and the Benguela Current cooling, consistent with the results for SST (Fig. 3b). Skin temperature trends are weak over the Kalahari (Fig. 4a). Over the eastern lowlands, there is weak cooling accompanied by diminished sensible heat flux (Fig. 4b) indicating that the air temperature is warming faster than the skin temperature (cf. Fig. 1c,d).
Concurrently, the latent heat flux in the eastern lowlands is increasing, consistent with findings elsewhere (Bounoua et al., 2000). The surface wind speed increases (0.02 m·s-1·yr-1) over the ocean margins particularly over the Agulhas Current (Fig. 4c). Wind speeds have diminished over the Limpopo Valley, in the MERRA reanalysis. The CRU3 Palmer Drought Severity Index (PDSI, standardized precipitation minus potential evaporation) has increased over the Kalahari (Fig. 4d) and decreased over the Western Cape, consistent with rainfall and, to a lesser extent, vegetation fraction.
Temporal analysis over South Africa
The annual cycle of observed temperature and rainfall (Fig. 5a, b) compared with CMIP5 data over land for 1980-2014 shows that the models reproduce temperature well, but precipitation is generally too high. Temperatures are projected to increase by ~1°C in the future, independent of season. The annual cycles of modelled and observed rainfall are largely in phase (Fig. 5b), and the projected trends from CMIP5 are small and statistically insignificant. The IPCC (2013) report highlights cGCM predicted increases/decreases in rainfall over eastern/western parts of South Africa.
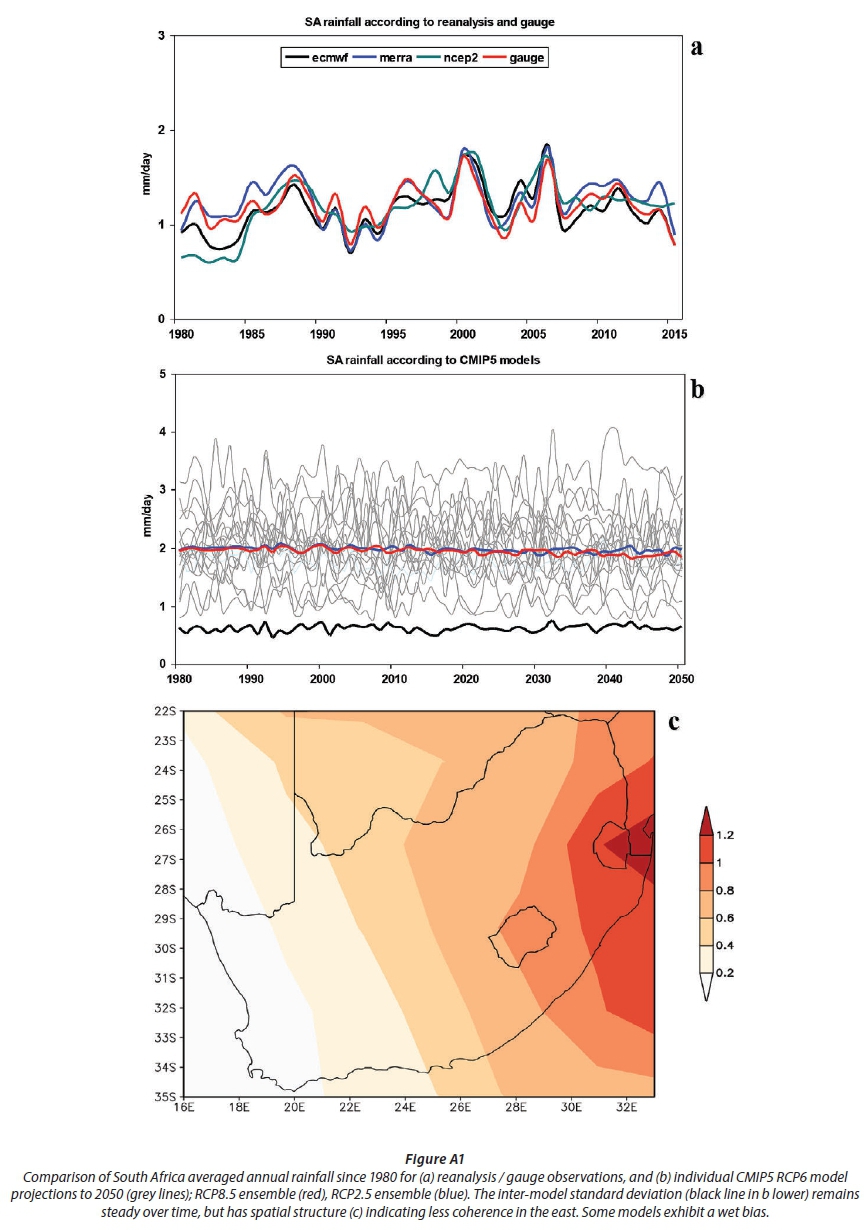
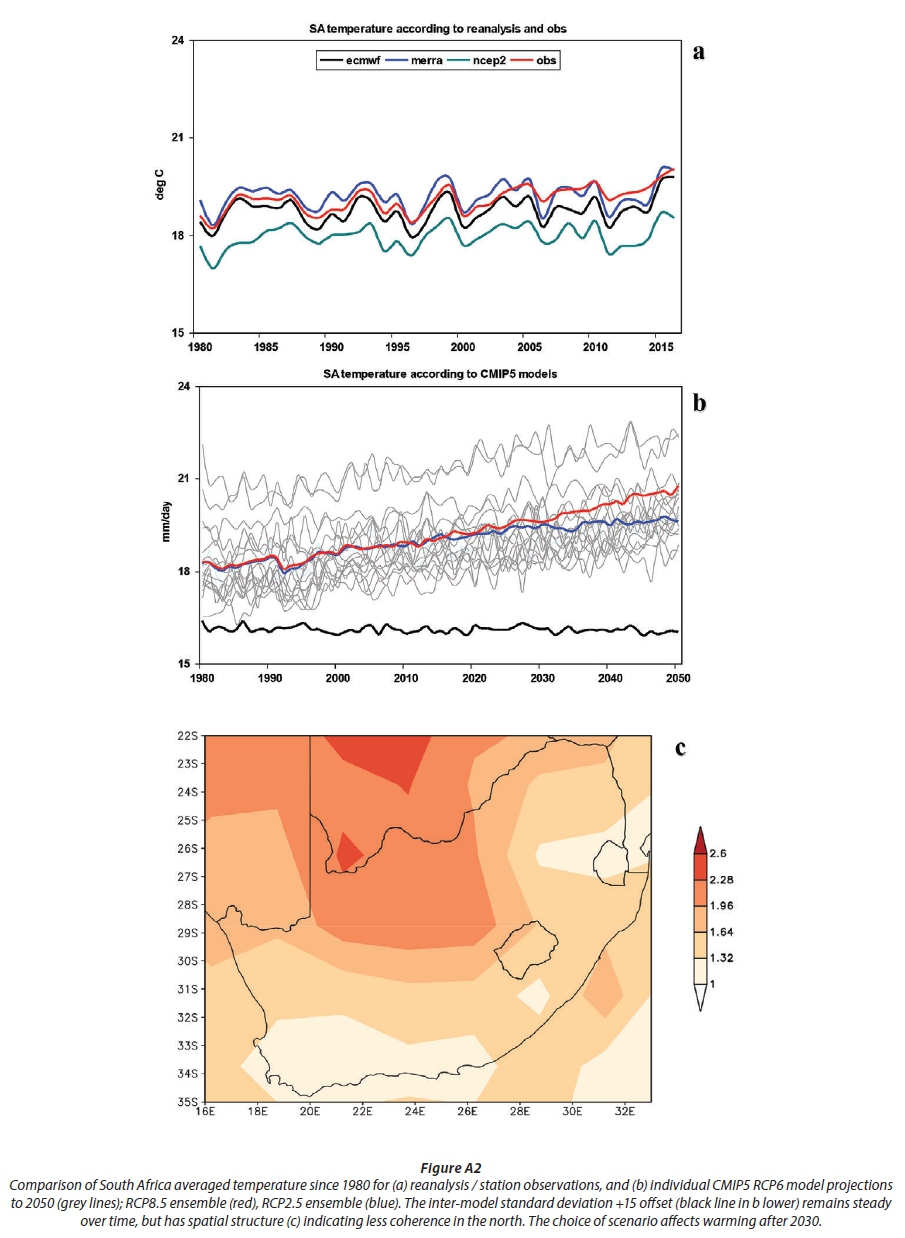
The South Africa area-averaged time series (Fig. 5c, d) demonstrate that observed fluctuations in rainfall exceed temperature. Linear trends account for 32% of the observed temperature variance but only 1% of the observed rainfall variance consistent with Dieppois et al. (2015). Hence the observed rainfall shows no appreciable trend. The CMIP5 model projection, based on the RCP6 scenario 1980-2050, shows a warming rate of 0.28°Cyr-1 (Fig. 5d), while area-averaged rainfall trends are downward (the trend having r2 12% fit). The CMIP5 does not involve data assimilation and so offers guidance only on scenario-dependent trends. While the ensemble average of multiple models offers certain benefits, year-to-year variability tends to cancel out. In comparison with observations during the satellite era, trends in model temperature are steeper and continue that way under the RCP6 scenario, while trends in model rainfall are opposing and statistically significant only because of the artificially low variability from multi-model averaging. Naturally the individual CMIP5 model projections show year-to-year fluctuations and a range of mean and trend values (Appendix Fig. A1, A2), as summarized for rainfall in Table 3.

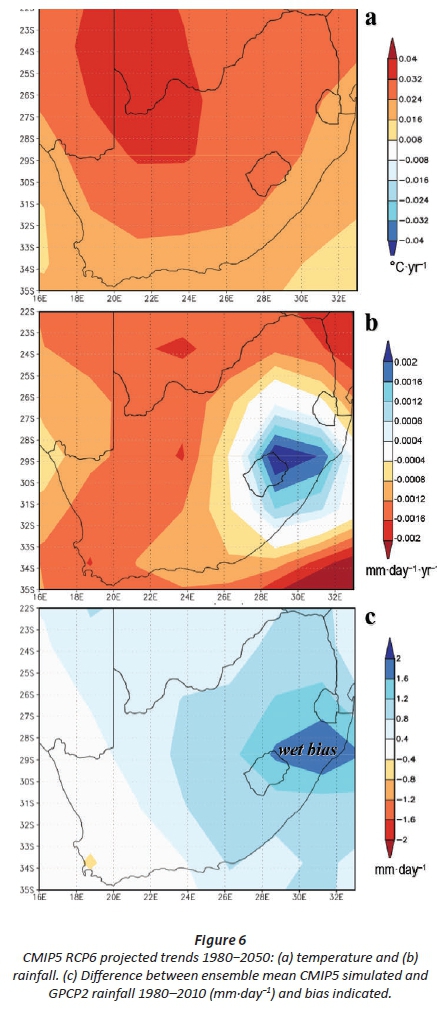
Spatial maps of ensemble mean CMIP5 RCP6 projected trends for temperature and rainfall over the period 1980-2050 (Fig. 6a, b) suggest continued warming, especially over the Kalahari (0.04°Gyr-1). Projected rainfall trends are weak but slightly downward over much of the western interior region. The tendency for wetter conditions is confined to the eastern coastal plains, where the CMIP5 ensemble mean exhibits a wet bias (Fig 6c) with respect to GPCP2 rainfall in the overlapping period.
CONCLUSION
In this study, new datasets (CHIRPS, MERRA) have been used for mapping and describing climate trends over South Africa in the satellite era. The spatial pattern of temperature and rainfall trends was related to a tendency for increased easterly winds, leading to a wet-east/dry-west gradient.
The climate of South Africa has warmed significantly by > 0.02°Gyr1 during the period 1980-2014. Although rainfall and vegetation show no appreciable trend over the plateau, sensible heat has declined in the eastern lowlands. The circulation trends found here (Fig 3d) do not support an accelerating Hadley Circulation as suggested by IPCC (2013). Instead the South Atlantic high did expand poleward into the mid-latitudes (Fig. 7), which corresponds with a positive trend in the Southern Annular Mode (0.025 hPa-yr1, Marshall, 2003). One outcome of the anti-cyclonic ridging is a trend of clean, moist, south-easterly flow (Fig. 2b) and rising vegetation fraction (Fig. 3a) along the southeast coast, where the Agulhas Current is warming and accelerating as part of the global ocean conveyor belt (Broecker, 1991). Most of South Africa has escaped a drying trend except the Western Cape (Fig. 4d), where action is needed to safeguard water resources. Observations show slight increases of rainfall over the interior following the drought in the 1980s, but CMIP5 simulations in the overlap period, and in future projections based on rising greenhouse gases, indicate drying over the western plateau. Disparities between cGCM and observed rainfall over the escarpment suggest the need for better simulation of topographically lifted easterly flow. Uncertainties in CMIP5 projections arise from inter-model dispersion (Figs A1, A2) and, to a lesser extent, from differences in the rate of GHG increase. The RCP6 scenario used here anticipates a continued ~3 ppm-yr1 rise of CO2.
A weak cooling trend in the 850-700 hPa layer ±30°S (Fig. 3c,d) appears to be generated by a trend toward equatorward flow (cool advection) around the South Atlantic High (Fig. 2b). Atmospheric reanalyses confirm the -0.01°C-yr-1 cooling trend at 700 hPa across the southern tier of South Africa during the period 1980-2014. Further work is needed on the factors moderating South Africa's changing climate, and how the trends affect different seasons.
ACKNOWLEDGEMENTS
SAPSE funding support from South Africa is acknowledged. Some data were analysed within the IRI Climate Library and KNMI Climate Explorer. Useful comments were provided by C. Simmer of Univ. Bonn.
REFERENCES
ADLER RF, HUFFMAN GJ, CHANG A, FERRARO R, XIE P, JANOWIAK J, RUDOLF B, SCHNEIDER U, CURTIS S, BOLVIN D, GRUBER A, SUSSKIND J, ARKIN P and NELKIN E (2003) The Version 2 Global Precipitation Climatology Project (GPCP) monthly precipitation analysis (1979-Present). J. Hydrometeorol. 4 1147-1167. https://doi.org/10.1175/1525-7541(2003)004<1147:TVGPCP>2.0.CO;2 [ Links ]
AINSWORTH EA and ROGERS A (2007) The response of photosynthesis and stomatal conductance to rising CO2: mechanisms and environmental interactions. Plant Cell Environ. 30 258-270. https://doi.org/10.1111/j.1365-3040.2007.01641.x [ Links ]
BIASTOCH A, BONING CW, SCHWARZKOPF FU and LUTJEHARMS JRE (2009) Increase in Agulhas leakage due to poleward shift of Southern Hemisphere westerlies. Nature 462 495498. https://doi.org/10.1038/nature08519 [ Links ]
BEAL LM, DE RUIJTER WPM, BIASTOCH A and ZAHN R (2011) On the role of the Agulhas system in ocean circulation and climate. Nature 472 429-436. https://doi.org/10.1038/nature09983 [ Links ]
BEKKER B, EBERHARD A, GAUNT T and MARQUARD A (2008) South Africa's rapid electrification programme: Policy, institutional, planning, financing and technical innovations. Energ. Polic. 36 3125-3137. https://doi.org/10.1016/j.enpol.2008.04.014 [ Links ]
BOSILOVICH MG, CHEN J, ROBERTSON FR and ADLER RF (2008) Evaluation of global precipitation in reanalysis. J. Appl. Meteorol. Climatol. 47 2279-2299. https://doi.org/10.1175/2008JAMC1921.1 [ Links ]
BOUNOUA L, COLLATZ GJ, LOS SO, SELLERS PJ, DAZLICH DA, TUCKER CJ and RANDALL DA (2000) Sensitivity of climate to changes in NDVI. J. Clim. 13 2277-2292. https://doi.org/10.1175/1520-0442(2000)013<2277:SOCTCI>2.0.CO;2 [ Links ]
BROECKER WS (1991) The great ocean conveyor. Oceanography 4 79-89. https://doi.org/10.5670/oceanog.1991.07 [ Links ]
CARTON JA and GIESE BS (2008) A reanalysis of ocean climate using Simple Ocean Data Assimilation (SODA). Mon. Weather Rev. 136 2999-3017. https://doi.org/10.1175/2007MWR1978.1 [ Links ]
CHAUDHURI AH, PONTE RM, FORGET G and HEIMBACH P (2013) A comparison of atmospheric reanalysis surface products over the ocean and implications for uncertainties in air-sea boundary forcing. J. Clim. 26 153-170. https://doi.org/10.1175/JCLI-D-12-00090.1 [ Links ]
CHIKOORE H and JURY MR (2010) Intra-seasonal variability of satellite derived rainfall and vegetation over southern Africa. Earth Interactions 14 1-26. https://doi.org/10.1175/2010EI26Z1 [ Links ]
DEAT (Department of Environmental Affairs and Tourism, South Africa) (2009) Greenhouse gas inventory of South Africa: 19902000. Pretoria. URL: www.erc.uct.ac.za/Information/Climate%20change/Climate_change_info-complete.pdf (Accessed 3 April 2017) [ Links ]
DECKER M, BRUNKE MA, WANG Z, SAKAGUCHI K, ZENG X and BOSILOVICH MG (2012) Evaluation of the reanalysis products from GSFC, NCEP, and ECMWF using flux tower observations. J Clim. 25 1916-1944. https://doi.org/10.1175/JCLI-D-11-00004.1 [ Links ]
DIEPPOIS B, ROUAULT M and NEW M (2015) The impact of ENSO on Southern African rainfall in CMIP5 ocean atmosphere coupled climate models. Clim. Dyn. 44 1-18. https://doi.org/10.1007/s00382-015-2480-x [ Links ]
FAN Y and VAN DEN DOOL H (2008) A global monthly land surface air temperature analysis for 1948-present. J. Geophys. Res. 113 D01103. https://doi.org/10.1029/2007JD008470 [ Links ]
FENSHOLT R, LANGANKE T, RASMUSSEN K, REENBERG A, PRINCE SD, TUCKER C, SCHOLES RJ, LE QB, BONDEAU A, EASTMAN R, EPSTEIN H and co-authors (2012) Greenness in semi-arid areas across the globe 1981-2007, An earth observing satellite based analysis of trends and drivers. Remote Sens. Environ. 121 144-158. https://doi.org/10.1016/j.rse.2012.01.017 [ Links ]
FUNK CC, PETERSON PJ, LANDSFELD MF, PEDREROS DH, VERDIN JP, ROWLAND JD, ROMERO BE, HUSAK GJ, MICHAELSEN JC and VERDIN AP (2014) A quasi-global precipitation time series for drought monitoring: U.S. Geological Survey Data Series 832 4 pp. http://dx.doi.org/110.3133/ds832 [ Links ]
HARRIS I, JONES PD, OSBORN TJ and LISTER DH (2013) Updated high-resolution grids of monthly climatic observations. Int. J. Climatol. 34 (3) 623-642. https://doi.org/10.1002/joc.3711 [ Links ]
HAWKINS MD, MORRIS VR, NALLI NR and JOSEPH E (2007) Comparison of aeroso1 and ozone profiles within Saharan dust and biomass burning plumes. Proc AMS Conf Atmos Chem, Austin TX. J7.9. [ Links ]
HOBBS PV (2000) Introduction to Atmospheric Chemistry. Cambridge Univ. Press, New York. 276 pp. https://doi.org/10.1017/CBO9780511808913 [ Links ]
HUFFMAN GJ, ADLER R, BOLVIN D and GU G (2009) Improving the global precipitation record: GPCP Version 2.1. Geophys. Res. Lett. 36 L17808. https://doi.org/10.1029/2009GL040000 [ Links ]
HURRELL JW, BROWN SJ, TRENBERTH KE and CHRISTY JR (2000) Comparison of tropospheric temperatures from radiosondes and satellites: 1979-98. Bull. Am. Meteorol. Soc. 81 2165-2177. https://doi.org/10.1175/1520-0477(2000)081<2165:COTTFR>2.3.CO;2 [ Links ]
IPCC (2013) The Physical Science Basis, WG1 Technical Summary, Ch 12. In: Long-term Climate Change: Projections, Commitments and Irreversibility. IPCC, Geneva. 108 pp. [ Links ]
JOSIPOVIC M, ANNEGARN HJ, KNEEN MA, PIENAAR JJ and PIKETH SJ (2011) Atmospheric dry and wet deposition of sulphur and nitrogen species and assessment of critical loads of acidic deposition exceedance in South Africa. S. Afr. J. Sci. 107. [ Links ]
JURY MR (2012) An inter-comparison of model simulated east-west climate gradients over South Africa. Water SA 38 1-11. https://doi.org/10.4314/wsa.v38i4.1 [ Links ]
JURY MR (2013) Climate trends in southern Africa. S. Afr. J. Sci. 109 53-63. https://doi.org/10.1590/sajs.2013/980 [ Links ]
JURY MR (2014) Factors contributing to a decadal oscillation in South African rainfall. Theor. Appl. Climatol. 120 227-237. https://doi.org/10.1007/s00704-014-1165-4 [ Links ]
KANAMITSU M, EBISUZAKI W, WOOLLEN J, YANG SK, HNILO JJ, FIORINO M and POTTER GL (2002) NCEP-DOE AMIP-II Reanalysis (R-2). Bull. Am. Meteorol. Soc. 83 1631-1643. https://doi.org/10.1175/BAMS-83-11-1631 [ Links ]
KENNEDY AD, DONG X, XI B, XIE S, ZHANG Y and CHEN J (2011) A comparison of MERRA and NARR reanalyses with the DOE ARM SGP data. J. Clim. 24 4541-4557. https://doi.org/10.1175/2011JCLI3978.1 [ Links ]
KRUGER AC and SHONGWE S (2004) Temperature trends in South Africa: 1960-2003. Int. J. Climatol. 24 1929-1945. https://doi.org/10.1002/joc.1096 [ Links ]
KRUGER AC and NXUMALO MP (2017) Historical rainfall trends in South Africa: 1921-2015. Water SA 43 285-297. https://doi.org/10.4314/wsa.v43i2.12 [ Links ]
LEAKEY ADB, AINSWORTH EA, BERNACCHI CJ, ROGERS A, LONG SP and ORT DR (2009) Elevated CO2 effects on plant carbon, nitrogen, and water relations; six important lessons from FACE. J. Expl. Bot. 60 2859-2876. https://doi.org/10.1093/jxb/erp096 [ Links ]
MACKELLER N, NEW M and JACK C (2014) Observed and modelled trends in rainfall and temperature for South Africa: 1960-2010. S. Afr. J. Sci. 110 1-13. https://doi.org/10.1590/sajs.2014/20130353 [ Links ]
MARSHALL GJ (2003) Trends in the Southern Annular Mode from observations and reanalyses. J Clim. 16 4134-4143. https://doi.org/10.1175/1520-0442(2003)016<4134:TITSAM>2.0.CO;2 [ Links ]
MAYER M and HAIMBERGER L (2012) Poleward atmospheric energy transports and their variability as evaluated from ECMWF reanalysis data. J. Clim. 25 734-752. https://doi.org/10.1175/JCLI-D-11-00202.1 [ Links ]
MEEHL GA, COVEY C, DELWORTH T, LATIF M, McAVANEY B, MITCHELL JF, STOUFFER RJ and TAYLOR KE (2007) The WCRP CMIP3 multimodel dataset: A new era in climate change research. Bull. Am. Meteorol. Soc. 88 1383-1394. https://doi.org/10.1175/BAMS-88-9-1383 [ Links ]
MITCHELL TD and JONES PD (2005) An improved method of constructing a database of monthly climate observations and associated high-resolution grids. Int. J. Climatol. 25 693-712. https://doi.org/10.1002/joc.1181 [ Links ]
MORISHIMA W and AKASAKA I (2010) Seasonal trends of rainfall and surface temperature over Southern Africa. Afr. Study Monogr. 40 67-76. [ Links ]
OLSSON L, EKLUNDH L and ARDO J (2005) A recent greening of the Sahel: trend, patterns and potential causes. J. Arid Environ. 63 556-566. https://doi.org/10.1016/j.jaridenv.2005.03.008 [ Links ]
POCCARD I, JANICOT S and CAMBERLIN P (2000) Comparison of rainfall structures between NCEP/NCAR reanalyses and observed data over tropical Africa. Clim. Dyn. 16 897-915. https://doi.org/10.1007/s003820000087 [ Links ]
REYNOLDS RW, SMITH TM, LIU C, CHELTON DB, CASEY KS and SCHLAX MG (2007) Daily high-resolution blended analyses for sea surface temperature. J. Clim. 20 5473-5496. https://doi.org/10.1175/2007JCLI1824.1 [ Links ]
RIENECKER MM, SUAREZ MJ, GELARO R, TODLING R, BACMEISTER J, LIU E, BOSILOVICH MG, SCHUBERT SD, TAKAES L, KIM G-K, BLOOM S and co-authors (2011) MERRA: NASA's Modern-Era Retrospective Analysis for Research and Applications. J. Clim. 24 3624-3648. https://doi.org/10.1175/JCLI-D-11-00015.1 [ Links ]
ROUAULT M, POHL B and PENVEN P (2010) Coastal oceanic climate change and variability from 1982 to 2009 around South Africa. Afr. J. Mar. Sci. 32 237-246. https://doi.org/10.2989/1814232X.2010.501563 [ Links ]
SAHA S, MOORTHI S, PAN H, WU X, WANG J, NADIGA S, TRIPP P, KISTLER R, WOOLLEN J, BEHRINGER D, LIU H and co-authors (2010) The NCEP Climate Forecast System reanalysis. Bull. Am. Meteorol. Soc. 91 1015-1057. https://doi.org/10.1175/2010BAMS3001.1 [ Links ]
SEMAZZI FHM and SONG Y (2001) A GCM study of climate change induced by deforestation in Africa. Clim. Res. 17 169-182. https://doi.org/10.3354/cr017169 [ Links ]
SINHA P, HOBBS PV, YOKELSON, RJ, BERTSCHI IT, BLAKE DR, SIMPSON IJ, GAO S, KIRCHSETTER TW and NOVAKOV T (2003) Emissions of trace gases and particles from savanna fires in southern Africa. J. Geophys. Res. 108 d13, 8487. https://doi.org/10.1029/2002JD002325 [ Links ]
TADROSS M, JACK C and HEWITSON B (2005) On RCM-based projections of change in southern African summer climate. Geophys. Res. Lett. 32 L23713. https://doi.org/10.1029/2005GL024460 [ Links ]
TAYLOR KE, STOUFFER RJ and MEEHL GA (2012) An overview of CMIP5 and the experiment design. Bull. Am. Meteorol. Soc. https://doi.org/10.1175/BAMS-D-11-00094.1 [ Links ]
TUCKER CJ, PINZON JE, BROWN ME, SLAYBACK DA, PAK EW and MAHONEY R (2005) An extended AVHRR 8 km NDVI dataset compatible with MODIS and SPOT vegetation data. Int. J. Remote Sens. 26 4485-4498. https://doi.org/10.1080/01431160500168686 [ Links ]
VAN VUUREN DP, EDMONDS J, KAINUMA M, RIAHI K, THOMSON A, HIBBARD K, HURTT GC, KRAM T, KREY V, LAMARQUE J-F, MASUI T and co-authors (2011) The representative concentration pathways: an overview, Clim. Change 109 5-31. https://doi.org/10.1007/s10584-011-0148-z [ Links ]
VAN WILGEN BW (2009) The evolution of fire management practices in savanna protected areas in South Africa. S. Afr. J. Sci. 105 343-349. [ Links ]
Received 7 May 2017
Accepted in revised form 3 April 2018
* To whom all correspondence should be addressed. e-mail: mark.jury@upr.edu

