


Servicios Personalizados
Articulo
 Inglés (pdf)
 Articulo en XML
 Referencias del artículo
Indicadores

Links relacionados
-
 Citado por Google
 -
 Similares en Google
Compartir

 Permalink
Water SA
versión On-line ISSN 1816-7950
versión impresa ISSN 0378-4738
Water SA vol.44 no.2 Pretoria abr. 2018
http://dx.doi.org/10.4314/wsa.v44i2.12
ORIGINAL ARTICLES
Driving factors of temporary and permanent shallow lakes in and around Hwange National Park, Zimbabwe
Stembile Msiteli-ShumbaI; Shakki KativuI; Beaven UteteII; Edwin MakuweIII; Florence D HulotIV, V, *
IUniversity of Zimbabwe, Biological Sciences Department, P.O. Box MP 167, Mt Pleasant, Harare, Zimbabwe
IIChinhoyi University of Technology, Department of Wildlife Ecology and Conservation, P. Bag 7744, Chinhoyi, Zimbabwe
IIIZimbabwe Parks and Wildlife Management Authority, Harare, Zimbabwe
IVEcologie Systématique Evolution, Univ. Paris-Sud, CNRS, AgroParisTech, Université Paris-Saclay, Orsay, France
VZone Atelier Hwange - Hwange LTER, CNRS-CIRAD, Box62, Dete, Zimbabwe
ABSTRACT
Small aquatic ecosystems in semi-arid environments are characterised by strong seasonal water level fluctuations. In addition, land use as well as artificial pumping of groundwater to maintain water resources throughout the dry season may affect the functioning of aquatic ecosystems. In this study, we investigated pans situated in and around Hwange National Park, Zimbabwe, where certain waterholes are artificially maintained during the dry season for conservation purposes. We monitored 30 temporary and permanent waterholes for 7 months across the wet and dry seasons in 2013, and analysed them for standard parameters to investigate seasonal variations, assess the effects of land use and pumping on lake functioning, and determine the driving factors of these aquatic systems. Results show an increase in conductivity, hardness, and turbidity when temporary pans dry up and permanent ones are filled with groundwater. Prominent parameters explaining the diversity of aquatic ecosystems are water hardness, conductivity, turbidity, and the presence of vegetation. Seasonality differences in certain parameters suggest the influence of water level fluctuations associated with rainfall, evaporation, and pumping activities. Further, the distinction between turbid pans and those with clear water and vegetation suggests the alternative functioning of pans. Land use had no significant effects, while the effects of pumping are discussed. In times of water scarcity, animals gather around artificially maintained waterholes and foul water with faeces and urine, thus inducing water eutrophication.
Keywords: eutrophication, water level fluctuation, organic matter inputs, groundwater pumping
INTRODUCTION
Water level fluctuation (WLF) is an important driver of shallow lakes in temperate and tropical zones (Beklioglu et al., 2007; Blaustein and Schwartz, 2001; Coops et al., 2003; Hofmann et al., 2008; Jeppesen et al., 2015; Mustapha, 2008; Schwartz and Jenkins, 2000). Although most research in aquatic ecology focuses on permanent water bodies (Schwartz and Jenkins, 2000), studying the role of WLF in the drying up of ecosystems and their responses is in great need (Coops et al., 2003). Water levels in shallow lakes depend on regional climatic conditions (from temperate to arid), as well as human activities such as water abstraction for irrigation (Coops et al., 2003; Jeppesen et al., 2015). WLF and drying up affect species living in the aquatic-terrestrial transition zones, in particular, littoral helophytes (Riis and Hawes, 2003; Thomas et al., 2000; Thomaz et al., 2006) and benthic invertebrates (Bazzanti et al., 2009; Coops et al., 2003; Strachan et al., 2014; White et al., 2008), as well as organisms living in the pelagic zone (Kelley et al., 2000; Medeiros et al., 2015; Michaloudi et al., 2012; Ovie and Adeniji, 1994; Teferi et al., 2014). Chemical properties and nutrient concentrations are also affected by WLF with the alternation of dilution and concentration (Barson and Nhiwatiwa, 2010; Coops et al., 2003; Coppens et al., 2016; Jeppesen et al., 2015; McCulloch et al., 2008; Nhiwatiwa et al., 2011; Ozen et al., 2010). The effects will be increasingly amplified by climate change because of increased temperatures that enhance evaporation and evapotranspiration, and decreased precipitation (Jeppesen et al., 2015). As a consequence, increased salinity and eutrophication poses a strong threat to shallow lakes, especially in semi-arid and arid regions (Coppens et al., 2016, Jeppesen et al., 2015). Land use is another strong driver of aquatic ecosystems: it determines allochthonous substances and the concentrations that reach water, as well as transportation rates and fluxes between the terrestrial and aquatic habitats (Brendonck et al., 2008; Davis et al., 2015; Nhiwatiwa et al., 2011; Pacheco and Fernandes, 2016; Williams et al., 2016). As a consequence, land use also drives species diversity and abundance, and so any changes in land use such as deforestation and increased agriculture and urbanisation have and will have profound effects on freshwater communities (Catherine et al., 2008, Kelley et al., 2000, Stomp et al., 2011).
WLF and water scarcity in arid and semi-arid ecosystems are a major issue for wildlife conservation and domestic herbivores (Epaphras et al., 2008; Fynn et al., 2015; James et al., 1999; Pettit et al., 2012; Wolanski and Gereta, 2001). In addition to drinking water, WLF determine plant zonation in wetlands and, as a result, access to key sources of forage for wild and domestic herbivores during the dry season (Fynn et al., 2015; Pettit et al., 2012). To support pastoralism and conservation objectives, artificial sources of water have been created, by feeding natural waterholes with ground-water, for instance. As aquatic ecosystems provide valuable water and forage sources in semi-arid regions, it is important to understand their structure and functioning for management and conservation purposes. Furthermore, they are major contributors to regional biodiversity (Williams, 2005).
Hwange National Park (HNP), Zimbabwe, is a typical semi-arid savanna with a surface water deficit for the greater part of the year (Chamaille-Jammes et al., 2007). Due to this water deficit, 67 boreholes were installed at some natural waterholes and wetlands, allowing for the artificial pumping of groundwater and maintenance of surface-water availability throughout the year (Chamaille-Jammes et al., 2007). According to Chammaillé-Jammes (2007), without artificial pumping, only 19.6% of the park remains within 5 km of a water source under average climatic conditions. These artificial waterholes help alleviate the effects of water shortage and variability for wildlife conservation. However, modifying the hydroperiod of HNP aquatic ecosystems might have profound effects on their functioning and change the driving factors. HNP is surrounded by communal areas and a forest reserve. It is therefore a very interesting site to explore the effects of WLF and land use on the physico-chemical characteristics of water. The objectives of the present study were therefore (i) to monitor natural and artificial waterholes in HNP and the neighbouring forest reserve and dams in the communal area over the course of a year; (ii) to investigate the underlying factors driving the physico-chemical characteristics of waterholes and dams; (iii) to study whether these factors change with the seasons; and (iv) to examine whether the physico-chemical characteristics of waterholes and dams differ according to their location (i.e., inside the park, in the communal or forestry areas) and their pumping status.
METHODS
Study area
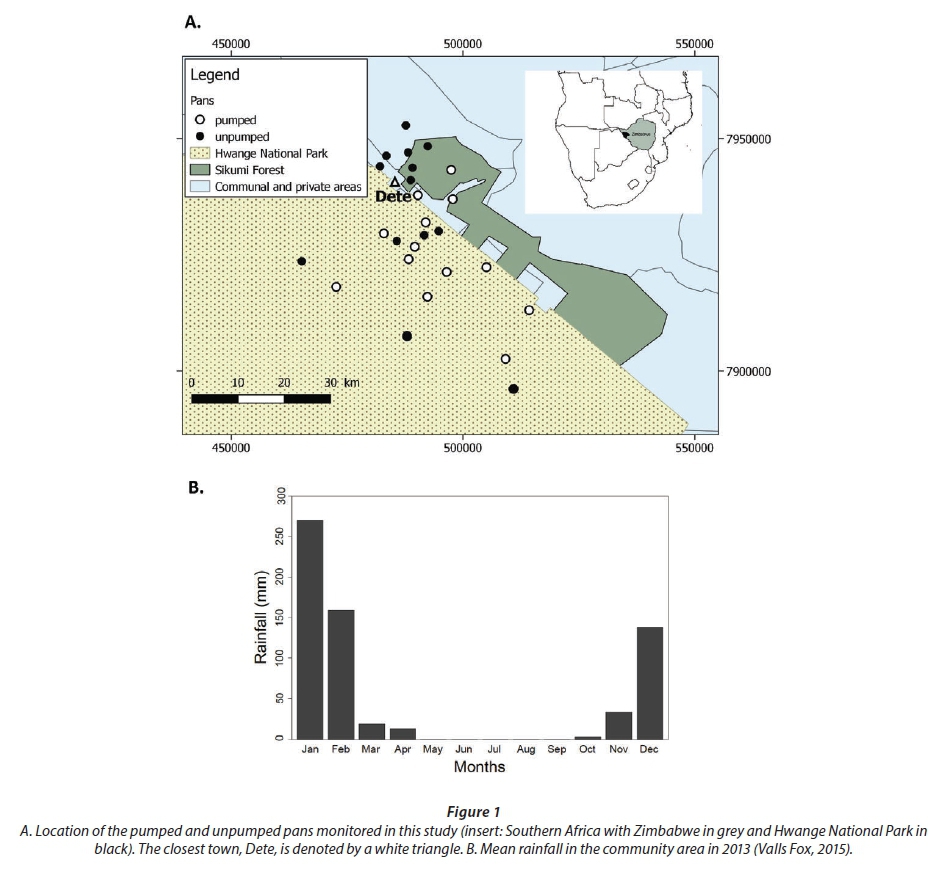
HNP is situated in Matabeleland North Province, Zimbabwe (Fig. 1). It covers an area of about 14 651 km2 (Child and Reese, 1977) and is located in a semi-arid region with an average annual rainfall of 650 mm (Dudley et al., 2001). The vegetation in most of the park consists of mixed woodland and bushland on Kalahari sands (Chamaille-Jammes et al., 2007), especially in the Hwange Main Camp area, the Sikumi Forest, and communal areas adjacent to the park where this study was carried out (Fig. 1, Table 1). In the National Park, there are no inhabitants and space is devoted to wildlife conservation. Domestic and wildlife coexist in the forest reserve and in the communal area but the former is uninhabited. The rainy season lasts from December to April, with January being the wettest month. The cool dry winter months extend from May to July, and the hot dry months from August to November.
Waterholes in HNP and in the forestry and communal areas are depressions that are fed during the rainy season by rainwater runoff; we refer to them in this paper as pans (Fynn et al., 2015). Some natural pans in the communal area are dammed up to store water; we refer to them in this paper as dams. Artificial pans are fed by groundwater during the dry season and are found in the park and forestry area. The surface area of dams found in the communal area ranged from 21 903 m2 during the rainy season to 531 m2 during the dry season, if they did not dry up completely, while the natural and artificial pans in the park and forestry area ranged from 26 788 m2 during the rainy season to 453 m2 during the dry season, or 0 m2 for natural pans that dried up. Both the dams and water pans were very shallow, with a depth not exceeding 3 m during the rainy season, while the natural water bodies retained water for only 3 to 6 months.
Sampling and analysis procedures
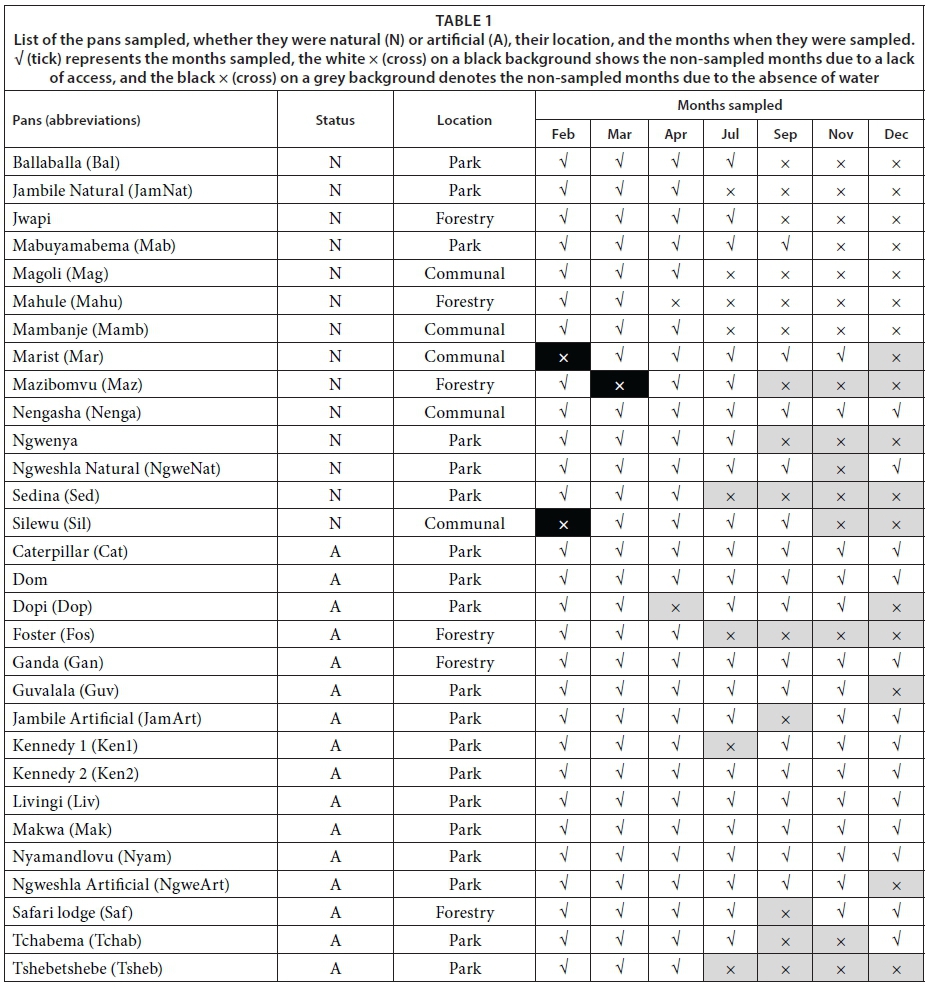
Sampling was carried out over 7 months during the wet (February, March, April, and December) and dry (July, September, and November) seasons in 2013. Thirty pans were selected to represent a diversity of artificial and natural pans with or without vegetation, and located inside or outside the park. These comprised 5 dams from the communal lands (Hwange communal area and private area), 5 pans in the forestry area (Sikumi Forest), and 20 pans in the Hwange Main Camp and Sinamatella area (Fig. 1, Table 1). Some pans were not sampled in February and March, because gaining access was not possible. Natural, unpumped pans started to dry up in April. As some of the pumps may have been out of order, the artificial pans may have dried up and were only sampled occasionally (i.e., Kennedy 1 in July).
Water samples were taken before 12:00 so as to standardise sampling and minimise variability in the time of day. The following variables were measured in situ near the shoreline of the pans and dams with a YSI 6600 VZ Multiparameter Water Quality Sonde: dissolved oxygen (DO), pH, conductivity (Con), total dissolved solids (TDS), turbidity (Tur), chlorophyll a (Chl a), and phycocyanin (PC). Water samples for laboratory analysis were collected on site and stored in ice in 1-L polyethene bottles. An assessment of vegetation cover was made using the following arbitrary scale: 0% = absent, 25% = one-quarter coverage, 50% = half coverage, 75% = three-quarter coverage, and 100% = full coverage of the waterhole. Suspended matter (SM) was measured by filtering a known volume of water over pre-weighed GF/F 47 mm filters, drying the filter at 105°C for 24 h, and then measuring the difference in mass before and after filtration. Chemical variables were determined with a HACH DR 3900 portable data logging spectrophotometer and reagents. Total nitrogen (TN) and total phosphorus (TP) were determined from unfiltered water samples, while filtered samples were used to determine total organic carbon (TOC), hardness, calcium, magnesium, nitrate, nitrite, and ammonia concentrations in accordance with the manufacturer's manual (HACH DR/3900 manual, 2011).
Statistical analysis
This study aimed to explore the factors driving the functioning of pans, determine whether these factors change with the seasons, and ascertain whether the pans' functioning differs according to their location (inside the park, in the communal or forestry areas) and pumping status (natural or artificial). To respond to these questions, first we used regressions to look for differences among the months, pumping status, and location for the different variables. We compared the full model where the months, pumping status, and location interacted. The comparison of the models with two independent variables (i.e., pumping status and months) with the models including location had a lower AIC value (data not shown). Therefore, we discarded the location variable from the analysis. To decrease the over-dispersion of the variables, some were either log- or square-root transformed. Second, multiple factorial analysis (MFA) (Escofier and Pages, 1994) was applied to the dataset comprising monthly variables in order to assess the general structure of the data and determine the relationships between the monthly data and variables structuring these relationships. This analysis allows us to show the correlations between variables, summarized as the dimensions, and the resemblances between pans based on the similarity of variables. The group structure of the MFA corresponds to the monthly variables. MFA allows both qualitative (i.e., pumping status and location) and quantitative variables to be used. Consequently, the location and pumping status of the pans were included in the MFA as qualitative variables and all other parameters as quantitative variables. In total, 30 pans were monitored. However, occasionally, some pans could not be sampled for technical reasons, while natural pans dried up during the dry season (for an overview, see Table 1). For these reasons, two MFAs were conducted: one on a dataset restricted to the wet season (February, March, and April) involving 27 pans, and another on a dataset limited to the 10 pans that did not dry up during the dry season. The first analysis allows us to compare all the pans, while the second allows us to study the changes during the course of a year. The numerical analysis and preparation of figures were carried out using software R (R Development Core Team, 2008), version 3.1.1. MFA was conducted using the FactoMineR package (Husson et al., 2015), version 1.29. Due to missing values in our data, the missMDA package (Husson and Josse, 2013), version 1.7.2, was used to impute the missing values.
RESULTS
Seasonal variation in physico-chemical parameters
The tested water pH ranged from 6 to 9.94 (Fig. 2b). Conductivity increased from the rainy season to the dry season, while its levels at all sites was generally high (Fig. 2a). Variability between the pans was low during the wet season (0 - approx. 1 mS/cm), later increasing from July to November (0 - approx. 5 mS/cm). Similarly to conductivity, there was a corresponding increase in salinity (Fig. 2c) from the rainy to dry months of the year. Even though most values were within acceptable ranges of less than 1 ppt, some values were saline. There was a steady increase in water hardness from February to September 2013 (Fig. 2d), which was associated with calcium (Fig. 2e) and magnesium (Fig. 2f) ions. Calcium, however, mostly determines the trend of water hardness for the year 2013. Statistical analyses reveal a significant effect of pumping on conductivity in February (p < 0.009), showing a lower conductivity for March, July, and November (p < 0.03, p < 0.001, and p < 0.008, respectively), and a marginal effect on salinity in February (p < 0.09). The hardness and calcium concentration were significantly higher in September (p < 0.03 and p < 0.01, respectively). Hardness was marginally lower in February and March (p < 0.06 and p < 0.07, respectively), the calcium concentration marginally lower in February (p < 0.07), and the magnesium concentration marginally higher in September and December (p < 0.08 and p < 0.06, respectively). The results revealed a significant effect of pumping on pH in September (p < 0.002) and on magnesium concentration in July (p < 0.03). In addition, we show a general effect of pumping in terms of water hardness (p < 0.03) and calcium concentration (p < 0.02).
Turbidity levels were highly variable, ranging from 50 NTU to 600 NTU with values rising up to 1 200 NTU (Fig. 3a). Turbidity was also low during the rainy season, increasing from April to December. The high variability in turbidity between sites should be noted during the dry season. Similarly to turbidity, suspended matter concentration (Fig. 3b) also increased during the dry season. Values generally ranged between 0 and 8 g/L, even though outliers reached up to 13 g/L in September. Dissolved oxygen (DO) (Fig. 3c) values were highly variable despite a decrease from the rainy to the dry season.
TOC (Fig. 3d) gradually increased from the rainy to the dry season with values ranging from 3 mg/L during the wet months to approximately 55 mg/L during the dry season. Variability between sites was greater during the dry season as compared to the rainy season. Statistical analyses show significantly lower turbidity in February and March (p < 0.008 and p < 0.007, respectively), significantly lower SM concentration in February (p < 0.007), and significantly higher SM concentration in July (p < 0.03). The saturation in DO was significantly higher in September and November (p < 0.02 and p < 0.03, respectively), while the TOC was marginally higher in November and December (p < 0.06 and p < 0.07, respectively). There was a marginal general effect of pumping on turbidity (p < 0.06), a significant effect of pumping on DO in September and November (p < 0.0002 and p < 0.02, respectively), and a marginal effect of pumping on SM concentration in September (p < 0.06).
There was an increase in TN (Fig. 4a) with a weak variability observed except for the month of September; all monthly values were within 20 mg/L, excluding September when TN went up to about 70 mg/L. Between September and December, there was a high variability in ammonium concentration, which reached very high values (up to 21 mg/L) (Fig. 4b). Nitrate and nitrite concentrations (Fig. 4c-d) were fairly constant. Phosphorus concentrations were between 0 and 2.5 mg/L for TP (Fig. 4e). Statistical analyses show a significantly lower concentration of TN in February (p < 0.001), and significantly and marginally higher concentrations in December (p < 0.03) and November (p < 0.09), respectively. Ammonium and nitrite concentrations were significantly lower in February (p < 0.006 and p < 0.02, respectively). Nitrate concentration was significantly lower in March and November (p < 0.01 and p < 0.005, respectively). TP concentration was significantly higher in February and September (p < 0.02 and p < 0.002, respectively). RP concentration was significantly lower in February and September (p < 0.0001 and p < 0.03, respectively) and marginally lower in November (p < 0.07). Pumping has no general effect on nutrient concentrations, but it affected TN and ammonium concentrations in certain months. Pumping had a positive effect on TN concentration in November (p < 0.0001) and on ammonium concentration in July, November, and December (p < 0.06, p < 0.006, and p < 0.02, respectively).
There was no change (Fig. 5a) in chlorophyll a concentration between the different months in our study. Chlorophyll a concentrations generally ranged from 0 to around 300 μg/L, even though there were a few outliers, which reveal phytoplankton blooms at 5 sites (Kennedy 1, Kennedy 2, Guvalala, Nyamandlovu and Makwa) (Msiteli-Shumba et al., 2017). Subtle variations were observed in PC concentrations as shown in Fig. 5b, but the differences were not significant.
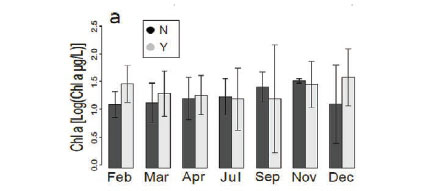
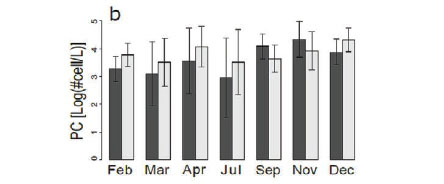
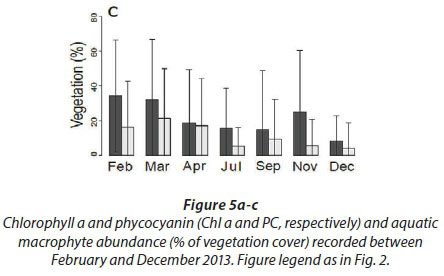
Very high densities indicated blooms of cyanobacteria in April, July, and December. Figure 5c shows the trend for aquatic macrophytes for the year 2013. The results reveal the diversity of water reservoirs during the wet season, either with or without vegetation. As pans dry out, vegetation consequently disappears, only remaining in a few pans that retain water throughout the year. Statistical analyses did not reveal any effect for the months or pumping.
Multifactorial analysis of the wet season
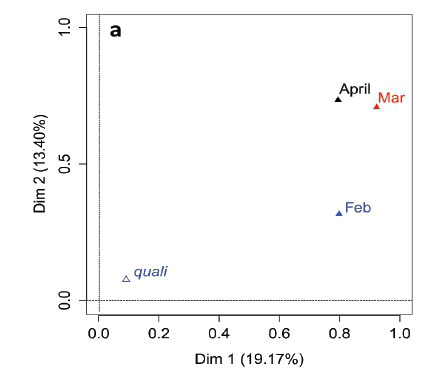
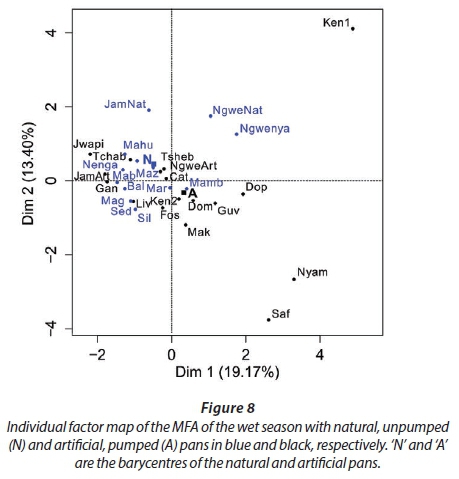
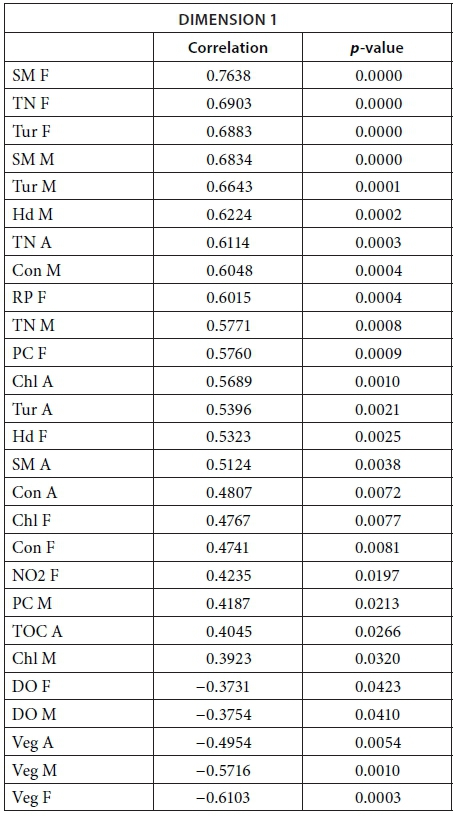
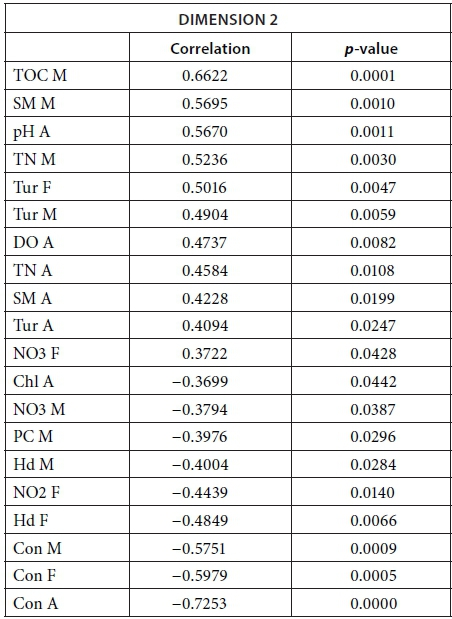
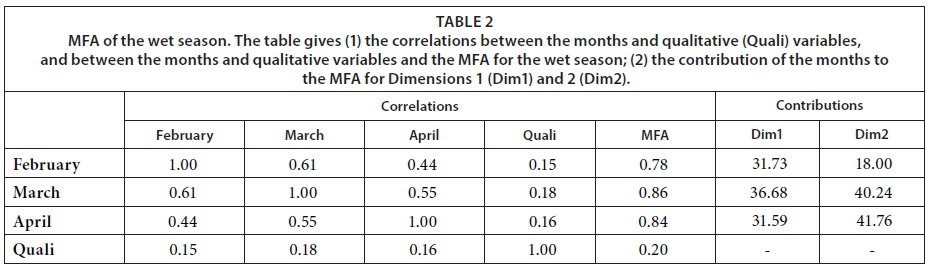
MFA was conducted on data measured in 27 pans during the wet months (February, March, and April). The aim of MFA is to extract important information from a data table and express it as a set of new variables of a reduced number. The dimensions are new variables corresponding to a linear combination of the original ones. The first two dimensions of the MFA explained 32.57% of the total variance. The parameters that significantly correlated with the first dimension and defined it (19.17% of the total variance) are represented using the correlation circle. If two parameters point in the same direction, then they are highly correlated; if they are orthogonal, they are unrelated; if they point in opposite directions, they are negatively correlated. These parameters were suspended matter, chlorophyll a, and TN concentrations, turbidity, and conductivity for the three months, phycocyanin concentration for February and March, and hardness, reactive phosphorus and nitrite concentrations for February alone, total organic carbon concentration for April (Fig. 6; Appendix 1). These parameters were negatively associated with the presence of vegetation in and around the pans during these three months and high DO concentration in February and March (Fig. 6). This homogeneity in parameters regarding the first dimension is summarised in the group representation (Fig. 7). In this figure, the influence of each group of variables on the dimensions is shown. In our study, the groups are the monthly variables represented by the month. Active groups with close coordinates for a given dimension reveal that their contribution to the dimension is quite similar. This also means that the dimension is common to all groups. The correlation of each group with Dimensions 1 and 2 along with their contributions is given in Table 2. The qualitative variables - here, pumping status and land use - do not contribute to defining the dimensions, although their correlation with the dimensions and groups can be computed. Figure 7 shows that the months have the same relative position and make a similar contribution to the first dimension in the MFA (Table 2, contribution to Dimension 1). Pumping status, included in the MFA as a qualitative value, was not significantly correlated with the first dimension. However, the individual factor map, which represents the pans in the space defined by the dimensions, shows that pans that were artificially maintained with pumped water during the dry months tend to be associated with positive values of the first dimension, while natural pans tend to be associated with negative values (Fig. 8). The location of the pans, also included in the MFA, was not significantly correlated with the first dimension. In short, the first dimension of the MFA suggests a distinction between highly conductive, turbid pans with a high abundance of phytoplankton and soft, clear pans with macrophytes and a low abundance of phytoplankton during the wet season.
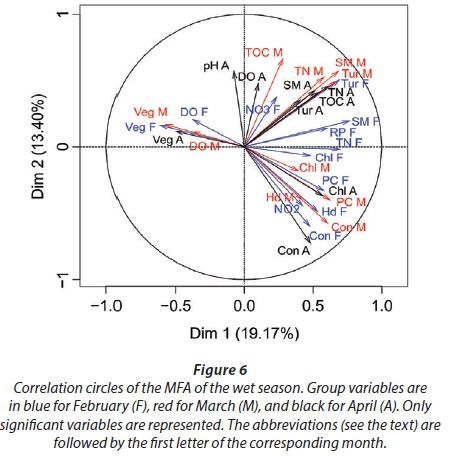
During the wet months, the parameters with a significant positive correlation to the second dimension (13.40 % of total variance) were turbidity for the 3 months, suspended matter and TN concentrations for March and April, total organic carbon concentration for March, and pH and DO concentration for April. These parameters were negatively associated with high conductivity for the three months and hardness for February and March (Fig. 6; Appendix 1).
With the second dimension, the group of pans with turbid and hard water is divided between turbid pans with high suspended matter and TN concentrations and those with hard water and a high abundance of phytoplankton (Fig. 8). The contributions of these groups are heterogeneous, with a higher contribution in March and April compared to February (Table 2, Fig. 7a). The distinction between turbid and hard water pans relies more on the dynamics of the pans at the end of the rainy season (i.e., March and April) than the mid-season (i.e., February). The correlation coefficients (Table 2) measure the extent to which the months are related to each other and to the MFA. The results (Table 2) show that February and March are more correlated to each other than are March and April, and finally February and April, which is in line with the progression of the season. The third dimension explained 9.22% of the variance and is not represented.
Multifactorial analysis of the 2013 data
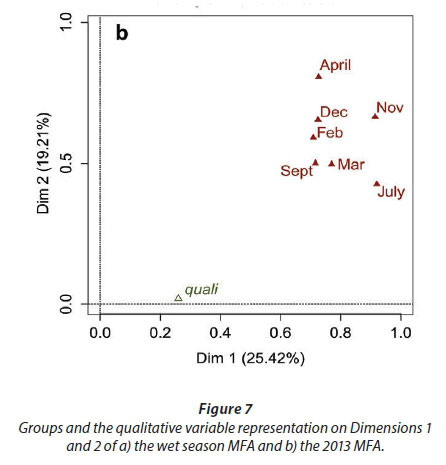
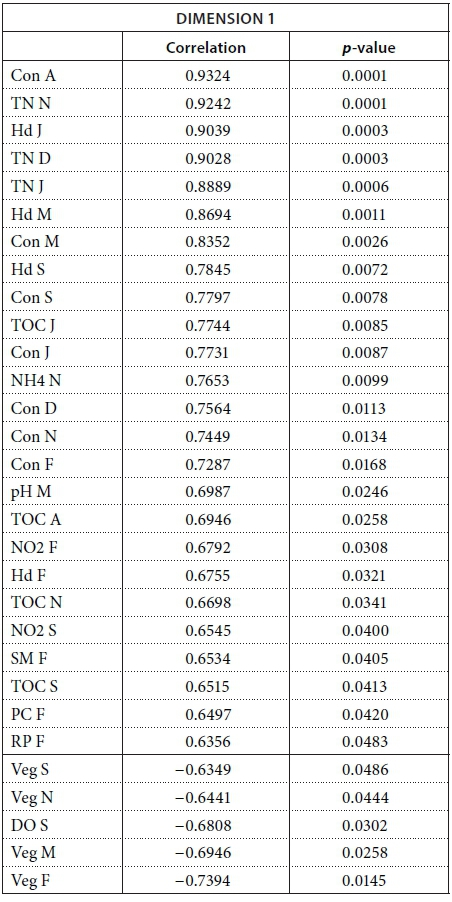
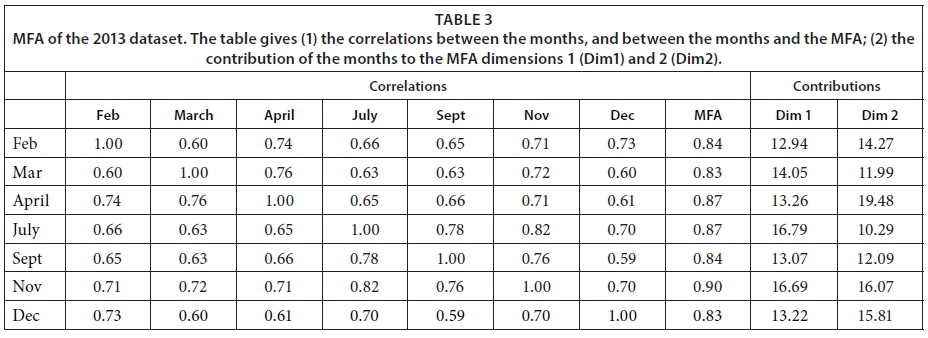
We conducted MFA on the 10 pans that retained water during the dry season, allowing us to study the changes during 2013. The MFA shows that the first two dimensions explain 44.63% of total variance, while the third dimension explains 12.61% (not shown). Similarly to the MFA of the wet season, the main parameters that were significantly correlated with the first dimension (25.42% of total variance) were conductivity for the 7 months (Fig. 9; Appendix 1). Other parameters that were significantly and positively correlated with the first dimension and shared by several months are hardness, TOC, and TN concentration. Nitrite, ammonium, SM, and PC concentrations as well as pH are also positively correlated with the first dimension but are less homogeneous between months (Fig. 9; Appendix 1).
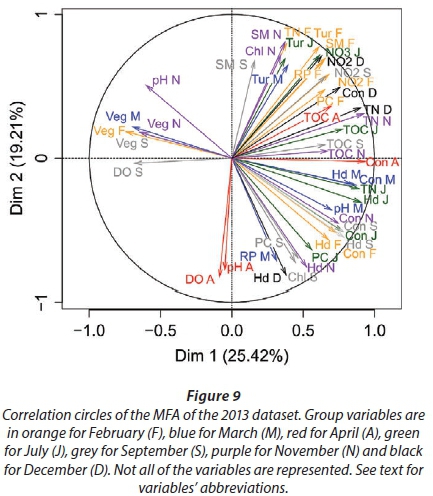
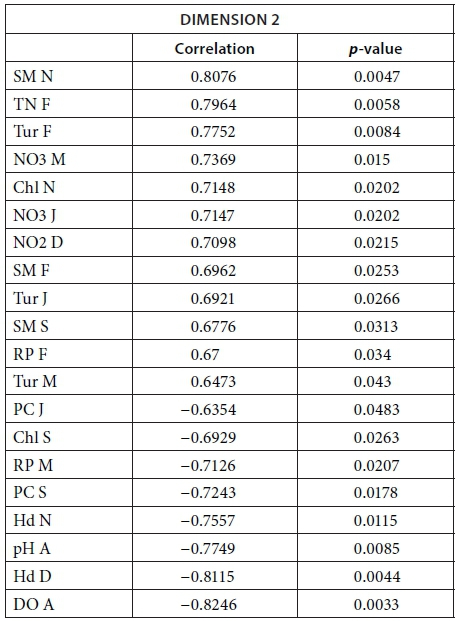
Vegetation, which was not present in all pans as it dies out with dryness, was negatively correlated with the first dimension in February, March, September, and November as was DO concentration in September (Fig. 9; Appendix 1). The results suggest again dissimilarities between pans with hard water rich in ions, TN, and TOC and those with vegetation. The contributions of the groups, i.e., months, were homogeneous (Fig. 7b, Table 3). The second dimension (19.21% of the total variance) was mainly characterised by Tur and SM concentration for positive values, and hardness and PC concentrations for negative values.
This second dimension differentiates pans that experienced cyanobacterial blooms that tend to be associated with hard water and turbid pans. The contribution of the different groups (months) to this dimension is more heterogeneous than for the first dimension, with April having the highest contribution and July the lowest (Fig. 8b, Table 3). The months' contributions to Dimensions 1 and 2 and the correlations between the months do not follow the seasons or differ between wet and dry seasons.
DISCUSSON
Our results show a strong seasonal variability in conductivity, hardness, and turbidity, as well as calcium, magnesium, suspended matter, total organic carbon, TN, and ammonium concentrations. Values are low during the rainy season and increase during the dry season. An increase in conductivity and salinity was also observed in impoundments in Southern Africa (De Klerk et al., 2012; Koning and Roos, 1999; Pettit et al., 2012; Roos and Pieterse, 1995). Low conductivity during the rainy season is due to the dilution effects of rainfall, while decreasing water levels during the dry season have a concentrating effect on dissolved ions in the water (De Klerk et al., 2012; Pettit et al., 2012). This concentration effect may be exacerbated by groundwater pumped into artificial pans. Measurements of groundwater at the opening of the pump in October 2014 show high water conductivity for some pans (Dopi: 952 μS·cm-1; Safari Lodge: 1.365 mS-cm-1; Nyamandlovu: 1.369 mS-cm-1; Guvalala: 8.549 mS-cm-1). Water hardness shows the same trend as conductivity and is also due to the concentration of calcium ions with water evaporation. Unfortunately, we did not measure pumped water hardness or calcium and magnesium concentrations. It was previously suggested that pumping water into most arid protected areas has produced more negative than positive results (Redfern et al., 2005). In addition to vegetation trampling throughout the year and increasing prey predation around waterholes (Illius and O'Connor, 2000), pumping may induce the deterioration of water quality through contamination from saltwater intrusion, a major concern in semi-arid and arid environments (Borrok and Engle, 2014).
Our results show high turbidity levels with an increase during the dry season, which is contrary to the results of Koning and Roos (1999), who demonstrated higher turbidity levels during the rainy season. Their findings were explained by the inflow of rainfall into the ecosystem. Rainfall discharge caused the re-suspension of silt molecules in the water. In HNP, the increase in turbidity seems to be related to the increase in mega-fauna activity around the remaining water bodies during the dry season (Chamaille-Jammes et al., 2007; Mukwashi et al., 2012). In addition to fouling with faeces and urine, domestic and wild fauna may also induce bioturbation, which results in organic matter and sediment re-suspension, and reduces water clarity. Fouling with dung is also observed, for instance, with feral dromedary camels in Australia (McBurnie et al., 2015). Unsurprisingly, dissolved oxygen levels were highly variable between pans. Oxygen concentration increases with photosynthesis, lower temperatures, and water stirring, while it decreases with a high concentration of decomposing organic material. In addition, turbidity reduces light penetration into the water; hence, photosynthesis is reduced, resulting in low oxygen levels, while the presence of organic matter implies that oxygen is depleted in its breakdown. Pans with a high abundance of phytoplankton or vegetation cover had higher oxygen saturation levels than turbid pans. The variability of oxygen levels between pans and throughout the year reflects the diversity of pans.
The concentrations of soluble reactive phosphorus and inorganic nitrogen (ammonium, nitrate, and nitrite) exceed 5 μg/L and 300-500 μg/L, respectively. Our results suggest an eutrophication of waterholes in HNP and its periphery, which are characterised by high densities of phytoplankton, including blooms of cyanobacteria in some pans (Msiteli-Shumba et al., 2017). Despite the presence of the nutrient-poor Kalahari sands that are distinctive of HNP and its surrounding areas (Chamaille-Jammes et al., 2007; Mukwashi et al., 2012), the observed results show very high nutrient values in water during the dry season. As suggested above, the high nutrient values may be due to the increase in the number of ungulates visiting the remaining water sources during the dry months (Chamaille-Jammes et al., 2007; Valeix et al., 2007). Our findings have also been observed in protected areas (Chaichana et al., 2010; Gereta and Wolanski, 1998) where excessive levels of nutrients in water indicate the contamination of the ecosystem.
The regressions and MFA of the parameters help us to understand the diversity and typology of pans. The MFA of the parameters during the wet season opposes the pans with clear, soft water and a high coverage of vegetation to the turbid pans with hard and electrolyte-rich water and a high abundance of phytoplankton. This distribution of pans along the axis defined by the abovementioned parameters tends to follow the separation of natural and artificial waterholes, suggesting an important effect of pumping on the diversity of pans' functioning. This effect depends on the chemistry of the pumped water, among multiple factors. MFA for the seven sampling months confirms the importance of conductivity, hardness, turbidity, and vegetation cover in explaining the diversity and typology of waterholes. Turbidity with high concentrations of free nutrients confirms the important role played by wild and domestic fauna in terms of nutrient inputs and bioturbation, which increase during the dry season. Within the pans showing high turbidity, we could distinguish a gradient from pans with high SM to those with high phytoplankton abundance. Overall, the analyses suggest alternating states between clear and turbid water in these semiarid ecosystems (Meerhoff et al., 2012).
The effect of location or land use was not significant in our research, as it was in small dams in the Mzingwane catchment and Matopos National Park in Zimbabwe (Basima et al., 2006). As land use is not intensive in the HNP periphery, this result is not surprising.
In this study, we addressed the importance of WLF among different drivers in aquatic ecosystems in a semi-arid region. The natural cycle of WLF in about half of the studied pans is modified by the pumping of groundwater. The analyses do not show a strong distinction between natural, temporary pans on the one hand and artificial, permanent ones on the other. Instead, a distinction between pans with clear water and vegetation and those with turbid water and high phytoplankton abundance is revealed in accordance with the classical model of alternative states in shallow lakes (Scheffer, 1998). One might expect that heavy trampling around the pans by megafauna, in particular elephants, will preclude macrophyte growth. However, permanent pans such as Ganda, Jwapi, and Jambile Artificial still have macrophytes during the dry season despite being frequented. Further studies should identify macrophyte species and their resistance to trampling. The history of pans, especially in terms of pump installation and soil properties like compaction, could also explain the development or local extinction of macrophytes. As expected, our results show that water becomes harder and more conductive in winter with the decreased water volume. The change in WLF might worsen this process with the filling of ion-rich groundwater and eutrophication due to the concentration of wild and domestic fauna. Hard and conductive water is also nutrient-rich according to our analyses. Therefore, measures of terrestrial wildlife conservation with the pumping of water in selected pans are also strong drivers of aquatic ecosystems in and around HNP. However, the conversion of temporary pans into permanent ones is a risky situation for species adapted to these threatened ecosystems (Blaustein and Schwartz, 2001).
ACKNOWLEDGEMENTS
This work was conducted within the framework of the Research Platform 'Production and Conservation in Partnership' (RP-PCP). We thank the ANR for their financial support through the SAVARID 2011 CEPL-003 project. The Zimbabwe National Parks and Wildlife Management Authority, Forestry Commission, and Hwange traditional leadership granted access to the study sites. The Department of Biological Sciences, University of Zimbabwe, availed the working facilities. Special thanks go to the rangers, students, and volunteers who participated in the fieldwork.
REFERENCES
BARSON M and NHIWATIWA T (2010) Influence of drought and flooding on the colonisation of floodplain pans by riverine fish in the Zimbabwean lowveld. Afr. J. Aquat. Sci. 35 (2) 205-208. https://doi.org/10.2989/16085914.2010.490983 [ Links ]
BASIMA LB, SENZANJE A, MARSHALL B and SHICK K (2006) Impacts of land and water use on plankton diversity and water quality in small man-made reservoirs in the Limpopo basin, Zimbabwe: A preliminary investigation. Phys. Chem. Earth 31 (15-16) 821-831. https://doi.org/10.1016/j.pce.2006.08.026 [ Links ]
BAZZANTI M, DELLA BELLA V and GREZZI F (2009) Functional characteristics of macroinvertebrate communities in Mediterranean ponds (Central Italy): Influence of water permanence and mesohabitat type. Ann. Limnol.-Int. J. Limnol. 45 (1) 29-39. https://doi.org/10.1051/limn/09005 [ Links ]
BEKLIOGLU M, ROMO S, KAGALOU I, QUINTANA X and BECARES E (2007) State of the art in the functioning of shallow Mediterranean lakes: workshop conclusions. Hydrobiologia 584 (1) 317-326. https://doi.org/10.1007/s10750-007-0577-x [ Links ]
BLAUSTEIN L and SCHWARTZ SS (2001) Why study ecology in temporary pools? Isr. J. Zool. 47 (4) 303-312. https://doi.org/10.1560/CKMU-Q2PM-HTGC-P9C8 [ Links ]
BORROK DM and ENGLE MA (2014) The role of climate in increasing salt loads in dryland rivers. J. Arid Environ. Ill 7-13. https://doi.org/10.1016/j.jaridenv.2014.07.001 [ Links ]
BRENDONCK L, ROGERS DC, OLESEN J, WEEKS S and HOEH WR (2008) Global diversity of large branchiopods (Crustacea : Branchiopoda) in freshwater. Hydrobiologia 595 (1) 167-176. https://doi.org/10.1007/s10750-007-9119-9 [ Links ]
CATHERINE A, TROUSSELLIER M and BERNARD C (2008) Design and application of a stratified sampling strategy to study the regional distribution of cyanobacteria (Ile-de-France, France). Water Res. 42 (20) 4989-5001. https://doi.org/10.1016/j.watres.2008.09.028 [ Links ]
CHAICHANA R, LEAH R and MOSS B (2010) Birds as eutrophicating agents: a nutrient budget for a small lake in a protected area. Hydrobiologia 646 (1) 111-121. https://doi.org/10.1007/s10750-010-0166-2 [ Links ]
CHAMAILLE-JAMMES S, FRITZ H and MURINDAGOMO F (2007) Climate-driven fluctuations in surface-water availability and the buffering role of artificial pumping in an African savanna: Potential implication for herbivore dynamics. Austral Ecol. 32 (7) 740-748. https://doi.org/10.1111/j.1442-9993.2007.01761.x [ Links ]
CHAMAILLE-JAMMES S, VALEIX M and FRITZ H (2007) Managing heterogeneity in elephant distribution: interactions between elephant population density and surface-water availability. J. Appl. Ecol. 44 (3) 625-633. https://doi.org/10.1111/j.1365-2664.2007.01300.x [ Links ]
CHILD G and REESE B (1977) Wankie National Park. Managements DoNPaW, Salisbury. [ Links ]
COOPS H, BEKLIOGLU M and CRISMAN TL (2003) The role of water-level fluctuations in shallow lake ecosystems - workshop conclusions. Hydrobiologia 506 (1-3) 23-27. https://doi.org/10.1023/B:HYDR.0000008595.14393.77 [ Links ]
COPPENS J, OZEN A, TAVSANOGLU UN, ERDOGAN S, LEVI EE, YOZGATLIGIL C, JEPPESEN E and BEKLIOGLU M (2016) Impact of alternating wet and dry periods on long-term seasonal phosphorus and nitrogen budgets of two shallow Mediterranean lakes. Sci. Total Environ. 563 456-467. https://doi.org/10.1016/j.scitotenv.2016.04.028 [ Links ]
DAVIS J, O'GRADY AP, DALE A, ARTHINGTON AH, GELL PA, DRIVER PD, BOND N, CASANOVA M, FINLAYSON M, WATTS RJ and co-authors (2015) When trends intersect: The challenge of protecting freshwater ecosystems under multiple land use and hydrological intensification scenarios. Sci. Total Environ. 534 65-78. https://doi.org/10.1016/j.scitotenv.2015.03.127 [ Links ]
DE KLERK AR, DE KLERK LP, CHAMIER J and WEPENER V (2012) Seasonal variations of water and sediment quality parameters in endorheic reed pans on the Mpumalanga Highveld. Water SA 38 (5) 663-672. https://doi.org/10.4314/wsa.v38i5.3 [ Links ]
DUDLEY JP, CRIAG GC, GIBSON DS, HAYNES G and KLIMOWICZ J (2001) Drought mortality of bush elephants in Hwange National Park, Zimbabwe. Afr. J. Ecol. 39 (2) 187-194. https://doi.org/10.1046/j.0141-6707.2000.0029.x [ Links ]
EPAPHRAS AM, GERETA E, LEJORA IA, OLE MEING'ATAKI GE, NG'UMBI G, KIWANGO Y, MWANGOMO E, SEMANINI F, VITALIS L, BALOZI J and co-authors (2008) Wildlife water utilization and importance of artificial waterholes during dry season at Ruaha National Park, Tanzania. Wetland Ecol. Manage.16 (3) 183-188. https://doi.org/10.1007/s11273-007-9065-3 [ Links ]
ESCOFIER B and PAGES J (1994) Multiple factor analysis (AFMULT package). Comput. Stat. Data Anal. 18 (1) 121-140. https://doi.org/10.1016/0167-9473(94)90135-X [ Links ]
FYNN RWS, MURRAY-HUDSON M, DHLIWAYO M and SCHOLTE P (2015) African wetlands and their seasonal use by wild and domestic herbivores. Wetland Ecol. Manage.. 23 (4) 559-581. https://doi.org/10.1007/s11273-015-9430-6 [ Links ]
GERETA E and WOLANSKI E (1998) Wildlife-water quality interactions in the Serengeti National Park, Tanzania. Afr. J. Ecol. 36 (1) 1-14. https://doi.org/10.1046/j.1365-2028.1998.102-89102.x [ Links ]
HOFMANN H, LORKE A and PEETERS F (2008) Temporal scales of water-level fluctuations in lakes and their ecological implications. Hydrobiologia 613 (1) 85-96. https://doi.org/10.1007/s10750-008-9474-1 [ Links ]
HUSSON F and JOSSE J (2013) missMDA: handling missing values with/in multivariate data analysis (principal component methods). Version 1.7.URL https://CRAN.R-project.org/package=missMDA. [ Links ]
HUSSON F, JOSSE J, LE S and MAZET J (2015) FactoMineR: Multivariate Exploratory Data Analysis and Data Mining. R package version 1.29. URL https://CRAN.R-project.org/package=FactoMineR. [ Links ]
ILLIUS AW and O'CONNOR TG (2000) Resource heterogeneity and ungulate population dynamics. Oikos 89 (2) 283-294. https://doi.org/10.1034/j.1600-0706.2000.890209.x [ Links ]
JAMES CD, LANDSBERG J and MORTON, SR. (1999) Provision of watering points in the Australian arid zone: a review of effects on biota. J. Arid Environ. 41 (1) 87-121. https://doi.org/10.1006/jare.1998.0467 [ Links ]
JEPPESEN E, BRUCET S, NASELLI-FLORES L, PAPASTERGIADOU E, STEFANIDIS K, NOGES T, NOGES P, ATTAYDE JL, ZOHARY T, COPPENS J and co-authors (2015) Ecological impacts of global warming and water abstraction on lakes and reservoirs due to changes in water level and related changes in salinity. Hydrobiologia 750 (1) 201-227. https://doi.org/10.1007/s10750-014-2169-x [ Links ]
KELLEY R, JACK J and FANT M (2000) A survey of the physiochemical characteristics and the zooplankton communities in an ephemeral karst lake. Aquat. Ecol. 34 (1) 77-89. https://doi.org/10.1023/A:1009922828999 [ Links ]
KONING N and ROOS JC (1999) The continued influence of organic pollution on the water quality of the turbid Modder River. Water SA 25 (3) 285-292. [ Links ]
MCBURNIE G, DAVIS J, THOMPSON RM, NANO C and BRIM-BOX J (2015) The impacts of an invasive herbivore (Camelus dromedaries) on arid zone freshwater pools: An experimental investigation of the effects of dung on macroinvertebrate colonisation. J. Arid Environ. 113 69-76. https://doi.org/10.1016/j.jaridenv.2014.09.011 [ Links ]
MCCULLOCH GP, IRVINE K, ECKARDT FD and BRYANT R (2008) Hydrochemical fluctuations and crustacean community composition in an ephemeral saline lake (Sua Pan, Makgadikgadi Botswana). Hydrobiologia 596 (1) 31-46. https://doi.org/10.1007/s10750-007-9055-8 [ Links ]
MEDEIROS LDC, MATTOS A, LURLING M and BECKER V (2015) Is the future blue-green or brown? The effects of extreme events on phytoplankton dynamics in a semi-arid man-made lake. Aquat. Ecol. 49 (3) 293-307. https://doi.org/10.1007/s10452-015-9524-5 [ Links ]
MEERHOFF M, TEIXEIRA-DE MELLO F, KRUK C, ALONSO C, GONZALEZ-BERGONZONI I, PACHECO JP, LACEROT G, ARIM M, BEKLIOGLU M, BRUCET S and co-authors (2012) Environmental Warming in Shallow Lakes: A Review of Potential Changes in Community Structure as Evidenced from Space-forTime Substitution Approaches. In: Jacob U and G Woodwards (eds) Advances in Ecological Research, Vol 46: Global Change in Multispecies Systems, Pt 1. Elsevier Academic Press, Cambridge MA. https://doi.org/10.1016/B978-0-12-396992-7.00004-6 [ Links ]
MICHALOUDI E, MOUSTAKA-GOUNI M, PANTELIDAKIS K, KATSIAPI M and GENITSARIS S (2012) Plankton succession in the temporary Lake Koronia after intermittent dry-out. Int. Rev. Hydrobiol. 97 (5) 405-419. https://doi.org/10.1002/iroh.201101498 [ Links ]
MSITELI-SHUMBA SM, KATIVU S and HULOT FD (2017) Influence of environmental variables on plankton community composition in permanent and temporal pools in and around Hwange National Park, Zimbabwe. Trans. R. Soc. S. Afr. 72 (3) 266-279. https://doi.org/10.1080/0035919X.2017.1293571 [ Links ]
MUKWASHI K, GANDIWA E and KATIVU S (2012) Impact of African elephants on Baikiaea plurijuga woodland around natural and artificial watering points in northern Hwange National Park, Zimbabwe. Int. J. Environ. Sci 2 (3) 1355-1368. https://doi.org/10.6088/ijes.00202030022 [ Links ]
MUSTAPHA MK (2008) Assessment of the water quality of Oyun Reservoir, Offa, Nigeria, using selected physico-chemical parameters. Turk. J. Fish. & Aquat. Sci. 8 309-319. [ Links ]
NHIWATIWA T, BRENDONCK L, WATERKEYN A and VANSCHOENWINKEL B (2011) The importance of landscape and habitat properties in explaining instantaneous and long-term distributions of large branchiopods in subtropical temporary pans. Freshwater Biol. 56 (10) 1992-2008. https://doi.org/10.1111/j.1365-2427.2011.02630.x [ Links ]
OVIE SI and ADENIJI HA (1994) Zooplankton and environmental characteristics of Shiroro Lake at the extremes of its hydrological cycle. Hydrobiologia 286 (3) 175-182. https://doi.org/10.1007/BF00006249 [ Links ]
OZEN A, KARAPINAR B, KUCUK I, JEPPESEN E and BEKLIOGLU M (2010) Drought-induced changes in nutrient concentrations and retention in two shallow Mediterranean lakes subjected to different degrees of management. Hydrobiologia 646 (1) 61-72. https://doi.org/10.1007/s10750-010-0179-x [ Links ]
PACHECO FAL and FERNANDES LFS (2016) Environmental land use conflicts in catchments: A major cause of amplified nitrate in river water. Sci. Total Environ. 548 173-188. https://doi.org/10.1016/j.scitotenv.2015.12.155 [ Links ]
PETTIT NE, JARDINE TD, HAMILTON SK, SINNAMON V, VALDEZ D, DAVIES PM, DOUGLAS MM and BUNN SE (2012) Seasonal changes in water quality and macrophytes and the impact of cattle on tropical floodplain waterholes. Mar. Freshwater Res. 63 (9) 788-800. https://doi.org/10.1071/MF12114 [ Links ]
REDFERN JV, GRANT CC, GAYLARD A and GETZ WM (2005) Surface water availability and the management of herbivore distributions in an African savanna ecosystem. J. Arid Environ. 63 (2) 406-424. https://doi.org/10.1016/j.jaridenv.2005.03.016 [ Links ]
RIIS T and HAWES I (2003) Effect of wave exposure on vegetation abundance, richness and depth distribution of shallow water plants in a New Zealand lake. Freshwater Biol. 48 (1) 75-87. https://doi.org/10.1046/j.1365-2427.2003.00974.x [ Links ]
ROOS JC and PIETERSE AJH (1995) Salinity and dissolved substances in the Vaal River at Balkfontein, South Africa. Hydrobiologia 306 (1) 41-51. https://doi.org/10.1007/BF00007857 [ Links ]
SCHEFFER M (1998) Ecology of Shallow Lakes. Springer, Netherlands. [ Links ]
SCHWARTZ SS and JENKINS DG (2000) Temporary aquatic habitats: constraints and opportunities. Aquat. Ecol. 34 (1) 3-8. https://doi.org/10.1023/A:1009944918152 [ Links ]
STOMP M, HUISMAN J, MITTELBACH GG, LITCHMAN E and KLAUSMEIER CA (2011) Large-scale biodiversity patterns in freshwater phytoplankton. Ecology 92 (11) 2096-2107. https://doi.org/10.1890/10-1023.1 [ Links ]
STRACHAN SR, CHESTER ET and ROBSON BJ (2014) Microrefuges from drying for invertebrates in a seasonal wetland. Freshwater Biol. 59 (12) 2528-2538. https://doi.org/10.1111/fwb.12451 [ Links ]
TEFERI M, DECLERCK SAJ, DE BIE T, LEMMENS P, GEBREKIDAN A, ASMELASH T, DEJENIE T, GEBREHIWOT K, BAUER H, DECKERS JAand co-authors (2014) Strong effects of occasional drying on subsequent water clarity and cyanobacterial blooms in cool tropical reservoirs. Freshwater Biol. 59 (4) 870-884. https://doi.org/10.1111/fwb.12312 [ Links ]
THOMAS S, CECCHI P, CORBIN D and LEMOALLE J (2000) The different primary producers in a small African tropical reservoir during a drought: temporal changes and interactions. Freshwater Biol. 45 (1) 43-56. https://doi.org/10.1046/j.1365-2427.2000.00616.x [ Links ]
THOMAZ SM, PAGIORO TA, BINI LM and MURPHY KJ (2006) Effect of reservoir drawdown on biomass of three species of aquatic macrophytes in a large sub-tropical reservoir (Itaipu, Brazil). Hydrobiologia 570 (1) 53-59. https://doi.org/10.1007/s10750-006-0161-9 [ Links ]
VALEIX M, FRITZ H, DUBOIS S, KANENGONI K, ALLEAUME S and SAID S (2007) Vegetation structure and ungulate abundance over a period of increasing elephant abundance in Hwange National Park, Zimbabwe. J. Trop. Ecol. 23 (1) 87-93. https://doi.org/10.1017/S0266467406003609 [ Links ]
VALLS FOX H (2015) To drink or not to drink ? The influence of resource availability on elephant foraging and habitat selection in a semi-arid savanna. PhD thesis, Montpellier University, France [ Links ]
WHITE MS, XENOPOULOS MA, HOGSDEN K, METCALFE RA and DILLON PJ (2008) Natural lake level fluctuation and associated concordance with water quality and aquatic communities within small lakes of the Laurentian Great Lakes region. Hydrobiologia 613 (1) 21-31. https://doi.org/10.1007/s10750-008-9469-y [ Links ]
WILLIAMS CJ, FROST PC, MORALES-WILLIAMS AM, LARSON JH, RICHARDSON WB, CHIANDET AS and XENOPOULOS MA (2016) Human activities cause distinct dissolved organic matter composition across freshwater ecosystems. Glob. Change Biol. 22 (2) 613-626. https://doi.org/10.1111/gcb.13094 [ Links ]
WILLIAMS DD (2005) The Biology of Temporary Waters. Oxford University Press, Oxford. https://doi.org/10.1093/acprof:oso/9780198528128.001.0001 [ Links ]
WOLANSKI E and GERETA E (2001) Water quantity and quality as the factors driving the Serengeti ecosystem, Tanzania. Hydrobiologia 458 (1-3) 169-180. https://doi.org/10.1023/A:1013125321838 [ Links ]
Received 7 August 2015
Accepted in revised form 12 March 2018
* To whom all correspondence should be addressed. 33 1 69 155 682; e-mail: florence.hulot@u-psud.fr
Description of the dimensions
The following tables give the correlation and p-value of the parameters with the Dimensions 1 and 2 for the MFA on the wet season and the MFA on the 2013 dataset. The values are given only for the parameters that are significantly correlated with the dimensions.
MFA on the 2013 dataset
MFA on the 2013 dataset

