


Services on Demand
Article
 English (pdf)
 Article in xml format
 Article references
Indicators

Related links
-
 Cited by Google
 -
 Similars in Google
Share

 Permalink
Water SA
On-line version ISSN 1816-7950
Print version ISSN 0378-4738
Water SA vol.44 n.1 Pretoria Jan. 2018
http://dx.doi.org/10.4314/wsa.v44i1.15
http://dx.doi.org/10.4314/wsa.v44i1.15
Analysis of water use by gated communities in South Africa
Jacques JL du Plessis; Heinz E Jacobs*
Department of Civil Engineering, Stellenbosch University, Private Bag X1, Matieland, 7602, South Africa
ABSTRACT
Gated communities (hereafter GCs) are popular in many countries, including South Africa, because added security and lifestyle improvements are offered relative to homes built on freestanding properties. One of the key factors for the popularity of GCs is the availability of amenities to support the demands of the residents, such as gymnasia, walkways, golf courses, play parks and polo fields. Further benefits include the improved management of infrastructure such as telecommunication services, roads, water, sewer, electrical and stormwater assets. GCs are often governed by trustees or homeowners' associations, responsible for the operation and the maintenance functions of the infrastructure, as well as implementing and adhering to legislation that pertains to the GC. As part of this study, the monthly water-use records of 2 888 GCs in 3 different South African cities were analysed. Water use was evaluated for each GC as a whole, and also per household in each case. The average number of homes per GC was 33 households/GC, with the smallest GC in the study sample containing 3 houses and the largest 524 houses. One of the study sites was in the winter rainfall region, while 2 sites were in the summer rainfall region. The average annual water use of individual households in each GC was plotted against current guidelines and was found to be relatively low. The average annual daily demands of all properties in the winter rainfall region was 0.63 kL/d, compared to 0.66 kL/d and 0.49 kL/d for the two study sites in the summer rainfall region. The results highlighted peculiarities in the water use of GCs that have not been reported on before, in particular the relatively low water use and the differences between GC homes' water use in the various rainfall regions.
Keywords: water use, outdoor, indoor, residential estates, gated communities
INTRODUCTION
Suburban areas with predominantly single-family households typically comprise communal areas and private plots. Municipally-controlled communal areas would include, for example, the roads, public open space (POS) and parks. Plots would be privately owned, with a house, and also possibly a garden and driveway with parking for vehicles. Some of these private homes would be enclosed by a fence for improved security. In this manuscript the term 'suburban house' is used to denote such private properties, with or without enclosed fence and perimeter control.
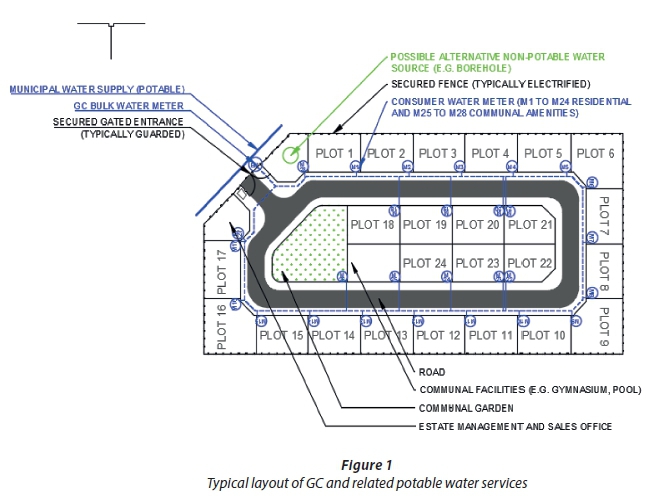
A typical layout of a gated community (GC) is shown in Fig. 1 with residential plots, communal roads and amenities. The common areas are owned by the GC body corporate, not the local municipal authority as would be the case for a suburban home. Plots are privately owned, but water users have to adhere to the GC rules of conduct as well as municipal bylaws. In this text the term 'GC home' was used to distinguish between homes in a GC and suburban homes. A GC is typically guarded and fenced for security purposes (Radetskiy et al., 2015).
GCs are commonly referred to as residential estates, common-interest housing developments, or housing estates (Landman, 2003). The popularity of GCs has increased, in South Africa (Landman, 2003) but also in the Americas, Asia and Europe (Atkinson and Blandy, 2006). The growth of GCs is ascribed to aspects such as social fear and aspirations to be ex-territorial (Bauman, 2013). Glasze (2004) reported that the prevalence of GCs is an effect of globalisation causing territorial club economies, fuelled by socio-economic and socio-political transformations. GCs are also popular in South Africa because added security and lifestyle improvements are offered to GC homes (Landman, 2004). GC homes are usually characterised by the similar architecture of the buildings and the group of houses is often closed off to the general public by means of a boundary wall and security-controlled entrances. Spocter (2011) reported that GCs became popular in South Africa for the following reasons (amongst others):
• Political insecurity after the 1994 first democratic elections in South Africa
• Desire for greater protection against crime
• Strong economic growth in the construction sector between 1995 and 2005
• Municipalities viewed GCs as a benefit to the community
Genis (2007), Thuillier (2005), Woo and Webster (2014) and Tedong et al. (2015) report on the international growth in the numbers of GCs over the past 2 decades in various countries including South Korea, Argentina, Istanbul, and Malaysia. Spocter (2011) has reported a steady increase of GC authorisations in the Western Cape Province, South Africa, until 2005. The worldwide economic downturn and the establishment of development guidelines by the South African Department of Environment Affairs and Development Planning (DEADP, 2005) have hampered growth in the construction of GCs in the Western Cape Province between 2006 and 2011 (Spocter, 2011). The DEADP (2005) released a guideline that listed 8 objectives for the development of golf estates and polo estates (both are a type of GC). These objectives included sustainable development principles such as responsible water use planning and effective stormwater management planning, and clarity with regard to the environmental application processes that had to be followed for new GCs. Although a decline since 2005 in the number of authorised GCs in South Africa has been reported, recent authorisations of GCs have included GCs with a larger number of homes (in excess of 3 000 homes per GC) located in the Western Cape and Gauteng Provinces.
GCs are governed by trustees or homeowners' associations who are responsible for the operation and the maintenance functions of the infrastructure, as well as implementing and adhering to legislation that pertains to the GC (Walks, 2014). A constitution, along with other guidelines and rules, is typically drafted prior to the establishment of the first GC homes and acts as the agreement between homeowners and the trustees. The rules typically address issues pertaining to:
•Use and maintenance of open areas
•Conduct in the public areas of the GC
•Environmental management
•Water- and electricity-use management
•Water and energy pricing strategies that have steep usage vs. cost curves
•Architectural guidelines, gardening and vegetation
•Security, levies and pets
The objective of this research was to understand how the water use of homes in GCs is different to that of suburban homes. As the popularity of GCs increases it is important to develop a method to properly plan for efficient water infrastructure in GCs.
Residential water use in general
Guidelines commonly used by planners and engineers to determine the average annual daily water demand (AADD) of residential properties, based on property size, are provided by the CSIR (2003). No guidelines are available to estimate water demand of GCs specifically. In recent years, further research has been done with regard to the estimation of AADD of suburban homes. The AADD calculated using the CSIR (2003) method was noted to be conservative for larger homes and underestimates the water use for smaller homes (Van Zyl et al., 2008). As an alternative, mathematically structured end-use models could be used to estimate water use, or estimates could be made separately for indoor- and outdoor use. End-use models allow residential water use to be split into separate water end-use components (Scheepers and Jacobs, 2014). Indoor water use has been widely modelled (Blokker et al., 2010), but outdoor use is much more variable and harder to model accurately, although models for estimating outdoor use are available (Jacobs and Haarhoff, 2004; DeOreo et al., 2011; Makwiza et al., 2015). Outdoor water use, mainly garden irrigation, is estimated to contribute approximately 40-60% to the AADD of GC homes, with a resulting seasonal water use pattern (Du Plessis and Jacobs, 2014).
Water use in GCs
Earlier research and water use guidelines do not distinguish between suburban homes and GC homes. This study focused on the water use of GCs and also individual GC homes. GCs are usually supplied with water from one or more of the following sources:
•Potable water supplied via a piped water distribution system (normally the primary source of water)
•Groundwater supply (boreholes)
•Abstraction of water from a nearby river or dam
•Treated sewage effluent and/or greywater reuse
•Stormwater run-off, often stored on site in retention ponds for irrigation purposes
In many cases water is supplied to GCs from a potable bulk water supply pipeline at a metered connection. The bulk water supply is metered and billed, typically on a monthly basis, by a municipality. The water use costs paid by the GC are cascaded to the homeowners and the communal amenities. The individual homeowners are billed for water use on an individual meter reading basis, or a fixed rate basis. The GC bulk water meter readings were obtained from the municipal authorities, with specific ethical permissions for each of the municipalities, via records extracted from the treasury database. The data were subsequently analysed as part of this research. The water use of individual GC homes was not available from the municipal data systems and thus not available for analysis in this study.
RESEARCH METHOD
This quantitative research was based on analysis of actual monthly water use, as recorded by municipal water meters. Data was extracted for analysis from the various financial treasury systems that keep records of the billed water use data. The data was received in a GIS-linked, Shape file, database format and contained records for all land use types, including business commercial, industrial, institutional and also all forms of residential properties. The water use of GCs, as recorded by means of monthly manual meter readings of the main bulk supply meter, was part of the extracted data set.
The first step was to identify records that could be classified as GCs, as per this study. Once identified, the GC water use records were analysed. Specialised software, Swift, was used to filter through the sets of water use data. Subsequent to extracting the AADD of each GC's bulk meter data, the appropriate information regarding the specific GC had to be obtained, including the number of homes in the GC, the property size of the GC, and also the plot sizes of GC homes.
Data acquisition and filtering
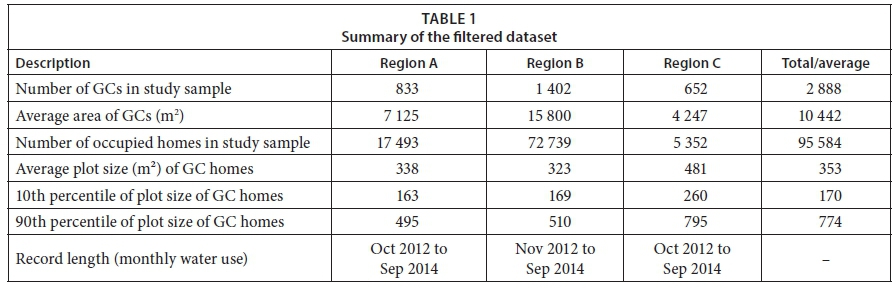
GCs located in three of South Africa's metropolitan municipalities (City of Tshwane, City of Cape Town and City of Johannesburg) were obtained from treasury data. The data obtained consisted of 658 208 water use record entries in Region A, 334 169 in Region B and 433 796 in Region C, as summarised in Table 1. The raw data set was subsequently filtered to include GCs exclusively.
Each data record contained the following fields, amongst others, that were essential to this study: GIS key; number of plots per record; plot size; AADD; 24 months' water use and land use. The following data filters were used to extract relevant data for GCs and further analysis:
•Only multi-plot GCs were included
•Cluster-type housing land use code was included
•Plot size of GC homes with an area of at least 150 m2/plot were included
•Apartments were excluded
•Total water use had to be more than zero for the sample period, so AADD > 0
Once the filters were applied, only 2 888 records passed through as qualifying CGs, with an average age since registration of 24 years. The geographical locations of filtered data were plotted to aerial photography to check the accuracy of the filtered data. The aerial imagery was used to identify if the sites were GCs, in terms of their enclosed nature and often repeated architecture.
The average area of plots in each GC had to be determined. Equation 1 describes the calculation method used for the determination of plot areas of the GCs and the individual plots in GCs:
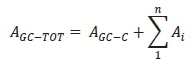
where:
AGC-TOT = Total plot area of one GC - equal to GIS polygon area
AGC-c = All communal areas in the GC, including roads, parks
Ai = Plot area of one GC home i
n = Total number of homes in the GC
The average size of the plots in GCs are relatively small when compared to suburban homes of approximately the same market value. The average GC plot size reported in Table 1 falls on the left of the x-axes of typical plot-size based techniques for estimating water demand in residential areas (CSIR, 2003; Jacobs and Haarhoff, 2004; Van Zyl et al., 2008). A premium is paid for plots located in GCs (Zimmer, 2010), thus indicating an inflated value per unit plot area. Houses in GCs are relatively large compared to the plot size, with high percentage cover and subsequently relatively small gardens.
RESULTS
The monthly water use data for the GCs listed in Table 1 was analysed. As part of the analysis, water use was expressed in the following manner:
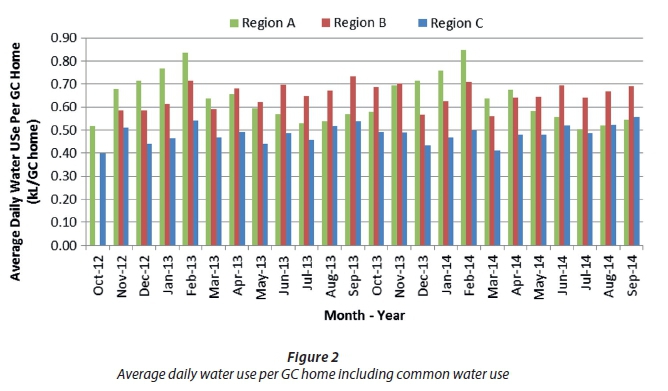
•The average monthly water use per GC home averaged over the entire record period, as shown in Fig. 2; and
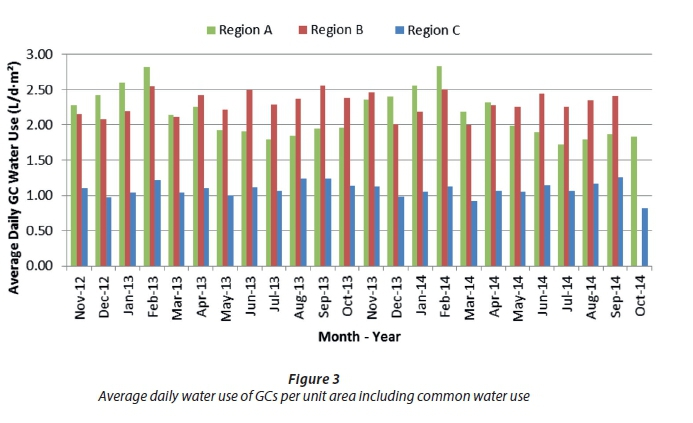
•The average monthly water use of the total GC area, averaged over the entire record period, as shown in Fig. 3.
From Fig. 2 and Fig. 3 a seasonal fluctuation in water use is evident. The dominant rainy season for Region A is in the winter, while Region B and Region C experience summer rainfall. The water use fluctuation is more pronounced for the winter rainfall region, in line with results from theoretical end-use models (Jacobs et al., 2004). In all regions the maximum garden irrigation occurs in the summer, meaning that the winter rainfall region with hot dry summers is expected to have relatively higher water use, compared to B and C with summer rainfall.
The GC water use per unit area is illustrated in Fig. 3. Region C had notably lower water use when compared to the other two regions. With reference to Table 1, the average GC home in Region C had a plot size of 481 m2, which was notably larger than plots in A (338 m2) and B (323 m2). The AADD of residential homes has been found to increase with plot size (CSIR, 2003; Jacobs and Haarhoff, 2004; Van Zyl et al., 2008). Table 2 summarises the AADD for GCs in all three regions.
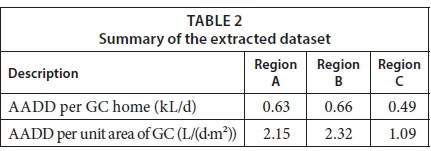
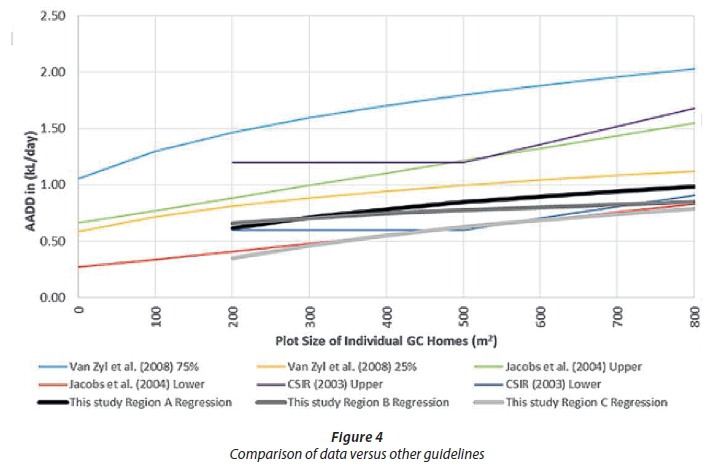
The AADD per GC home reported in Table 2 is relatively low compared to other published guidelines (CSIR, 2003; Jacobs and Haarhoff, 2004; Van Zyl et al., 2008), as illustrated in Fig. 4. Van Zyl et al. (2008) used logarithmic regression models to estimate the AADD of residential properties. In a similar fashion, logarithmic regression models were derived for the three data sets shown in Fig. 4.
The published guidelines (CSIR, 2003; Jacobs and Haarhoff, 2004; Van Zyl et al., 2008) are from reputable sources and have been referenced in various other studies pertaining to water use. It can be noted that the published guidelines have evolved in approach over the years; however, the principles of stand size as benchmark for average annual water use has remained a suitable water use estimation parameter. The guidelines (CSIR, 2003) address peak daily and peak hourly demands; however, for this research peak flow analysis was excluded because of the limitations of the available data.
The results shown in Fig. 4 have been limited on the x-axis to 800 m2, because 95% of all of the GC home plot sizes were smaller than 800 m2. Possible explanations for the lower water use of GC homes could be attributed to the water pricing strategies, relatively smaller household irrigation area, low average age of the GCs (potentially indicating the use of water-efficient appliances), and geographic location.
DISCUSSION
The water use of GC homes in all the regions was relatively low in comparison with other guidelines for residential plots. Further research is needed, based on long-term time-series data, to better understand why the water use of GCs in the study area was in the 25th percentile in relation to estimates provided in available guidelines. Communal maintenance services, including gardening, are one of the desirable features of a GC (Walks, 2014). Communal garden irrigation by the GC (often with non-potable sources) may lead to reduced private GC home irrigation and/or a reduced need for an irrigated garden, leading to reduced water use in the GC homes. Bekleyen et al. (2016) stated that neighbourhood enhancements lead to increased consumer awareness of the environment. GC home owners could be considered more conservation minded, leading to water conservation and relatively lower water consumption.
Large portions of the data analysed as part of this study fell below the 500 m2 plot size. In contrast, most of the plot size based guidelines for estimating AADD far exceeded 500 m2, with upper limits of 2 000 m2 (CSIR 2003), 4 000 (Van Zyl et al., 2008) and even 8 000 m2 (Makwiza and Jacobs, 2015). Results for plot sizes between 200 m2 and 500 m2 in all guidelines was either lacking, or limited. GCs, with relatively small yet high-valued properties, are a relatively new type of residential development with sufficient data for analysis only becoming available in the past decade. Most of the available guidelines were based on data preceding the growth spurt in GCs so guidelines that specifically address GCs should be investigated.
CONCLUSION
Water use of 2 888 GCs in 3 South African cities was analysed. The results confirmed that water use in GCs is notably different from previously published residential water use estimates for AADD. The average annual GC water use from the potable municipal supply was found to be notably lower than estimates based on available guidelines for average annual demand. The differences could be attributed to the availability of alternative water sources for irrigating communal gardens, and the unique, homogeneous design of homes and garden layout in GCs, as compared to suburban homes outside GCs. Also, GC water use varied notably between the two cities in the summer rainfall season, suggesting that further research is needed to explain the disparity. The proposed research should include GCs of a greater geographical range and water use of individual GC homes. Further studies to address outdoor water use modelling of properties located in GCs would allow for better planning of GCs.
REFERENCES
ATKINSON R and BLANDY S (2006) Gated Communities. Routledge Taylor and Francis Group, London and New York. 166 pp. [ Links ]
BAUMAN Z (2013) Liquid Modernity. Polity Press, Cambridge. 240 pp. [ Links ]
BLOKKER EJM, VREEBURG JHG and VAN DIJK JC (2010) Simulating residential water demand with a stochastic end-use model. J. Water Resour. Plan. Manag. 136 (1) 19-26. https://doi.org/10.1061/(ASCE)WR.1943-5452.0000002 [ Links ]
BEKLEYEN A (2016) Are gated communities indispensable for residents? Urbani Izziv 27 (1) 149-162. https://doi.org/10.5379/urbani-izziv-en-2016-27-01-005 CSIR (Council for Scientific and Industrial Research) (2003) Guidelines for human settlement planning and design. [ Links ] The Red Book (2nd edn.). A report compiled under the patronage of the Department of Housing, South Africa. [ Links ]
DEOREO WB, MAYER PW, MARTIEN L, HAYDEN M, FUNK A, KRAMER-DUFFIELD M and DAVIS R (2011) California single family water use efficiency study. A report compiled for the California Department of Water Resources. [ Links ]
DEADP (Western Cape Provincial Government Department of Environmental Affairs and Development Planning) (2005) Guidelines for golf courses, golf estates, polo fields and polo estates in the Western Cape. Western Cape Provincial Government, South Africa. URL: https://www.westerncape.gov.za/Text/2005/12/gcgepf&pe_guidelinesfindec05.pdf (Accessed 20 June 2017). [ Links ]
DU PLESSIS JL and JACOBS HE (2014) Model for estimating domestic outdoor water demand of properties in residential estates. Procedia Eng. 89 967-974. https://doi.org/10.1016/j.proeng.2014.11.213. [ Links ] GENIS S (2007) Producing elite localities: The rise of gated communities in Istanbul. Urban Stud. 44 (4) 771-798. https://doi.org/10.1080/00420980601185684. [ Links ]
JACOBS HE, GEUSTYN L, LOUBSER B and VAN DER MERWE B (2004) Estimating residential water demand in southern Africa. J. S. Afr. Inst. Civ. Eng. 46 (4) 2-13. [ Links ]
JACOBS H and HAARHOFF J (2004) Application of a residential end-use model for estimating cold and hot water demand, wastewater flow and salinity. Water SA 30 (3) 275-316. https://doi.org/10.4314/wsa.v30i3.5078 [ Links ]
LANDMAN K (2003) A national survey of gated communities in South Africa. Report to the Council for Scientific and Industrial Research. CSIR Publication BOU/I 257. CSIR, Pretoria. [ Links ]
LANDMAN K (2004) Gated communities in South Africa: comparison of four case studies in Gauteng. Report to the Council for Scientific and Industrial Research. CSIR Publication BOU/I 347. CSIR, Pretoria. [ Links ]
MAKWIZA C, FUAMBA M, HOUSSA F and JACOBS HE (2015) A conceptual theoretical framework to integrally assess the possible impacts of climate change on domestic irrigation water use. Water SA 41 (5) 586-593. https://doi.org/10.4314/wsa.v41i5.1. [ Links ]
RADETSKIY E, SPAHR R and SUNDERMAN M (2015) Gated community premiums and amenity differentials in residential subdivisions. J. Real Estate Res. 37 (3) 405-438. [ Links ]
SCHEEPERS HM and JACOBS HE (2014) Simulating residential indoor water demand by means of a probability based end-use model. Aqua 63 (6) 476-488. https://doi.org/10.2166/aqua.2014.100 [ Links ]
SPOCTER M (2011) Spatio-temporal aspects of gated residential security estates in non-metropolitan Western Cape. Urban Forum 22 169-181. [ Links ]
TEDONG P, GRANT J and WAN ABD AZIZ W (2015) governing enclosure: the role of governance in producing gated communities and guarded neighborhoods in Malaysia. Int. J. Urban Regional Res. 39 (1) 112-128. https://doi.org/10.1111/1468-2427.12204. [ Links ]
THUILLIER G (2005) Gated communities in the metropolitan area of Buenos Aires, Argentina: A challenge for town planning. Housing Stud. 20 (2) 255-271. https://doi.org/10.1080/026730303042000331763. [ Links ]
VAN ZYL HJ, ILEMOBADE AA and VAN ZYL JE (2008) An improved area-based guideline for domestic water demand estimation in South Africa. Water SA 34 (3) 381-391. [ Links ]
WOO Y and WEBSTER C (2014) Co-evolution of gated communities and local public goods. Urban Stud. 51 (12) 2539-2554. https://doi.org/10.1177/0042098013510565. [ Links ]
WALKS A (2014) Gated communities, neighbourhood selection and segregation: The residential preferences and demographics of gated community residents in Canada. Town Plan. Rev. 85 (1) 39-67. https://doi.org/10.3828/tpr.2014.5. [ Links ]
ZIMMER A (2010) New water uses in the Segura basin: Conflicts around gated communities in Murcia. Water Int. 35 (1) 34-48. https://doi.org/10.1080/02508060903533559 [ Links ]
Received 22 June 2017
Accepted in revised form 12 January 2018.
* To whom all correspondence should be addressed. +27218084059 ; fax: +2721808 4351; e-mail: hejacobs@sun.ac.za

