


Services on Demand
Article
 English (pdf)
 Article in xml format
 Article references
Indicators

Related links
-
 Cited by Google
 -
 Similars in Google
Share

 Permalink
Water SA
On-line version ISSN 1816-7950
Print version ISSN 0378-4738
Water SA vol.44 n.1 Pretoria Jan. 2018
http://dx.doi.org/10.4314/wsa.v44i1.12
http://dx.doi.org/10.4314/wsa.v44i1.12
Effect of sodium adsorption ratio and electric conductivity of the applied water on infiltration in a sandy-loam soil
Abdulwahed M AboukarimaI, III; Mohammed A Al-SulaimanII; Mohamed SA El MarazkyI, III, *
IAgricultural Engineering Research Institute (AEnRI), Agricultural Research Centre, P.O. Box 256, Giza, Egypt
IIShaqra University, Saudi Arabia, P.O. Box 300, Riyadh 11962, Saudi Arabia
IIIDepartment of Agricultural Engineering, College of Food and Agriculture Sciences King Saud University, Riyadh 11451, Saudi Arabia
ABSTRACT
Infiltration measurements using a double-ring infiltrometer were conducted on a sandy-loam soil located in Saudi Arabia. The measurements were performed for an undisturbed soil. The effect of sodium adsorption ratio (SAR) and electric conductivity (EC) of the applied water on infiltration rate was examined. The infiltration rate at the initial time was high, in the order 305 > 240 > 137 > 104 > 65 mm/h for SAR of 3.34, 3.52, 4.14, 4.18, and 7.60, respectively. The results showed that 180 min after the initial time of measurement in the sandy-loam soil, the final infiltration rates were in the range of 21.1-44.0 mm/h for the different qualities of water considered in this study, with an average value of 33.8 mm/h. Hence, the infiltration rate is sensitive to the SAR of the applied water. The final infiltration rate (IRf) and the final cumulative infiltration depth (Zf) after 180 min could be predicted using the following equations:
IRf (mm/h) = 49.399 + 6.691 × EC (dS/m) - 6.740 × SAR (-) R2 = 0.939
Zf (mm) = 148.198 + 20.074 × EC (dS/m) - 20.221 × SAR (-) R2 = 0.9387
Keywords: Infiltration, Kostiakov, electric conductivity, sodium adsorption ratio
INTRODUCTION
Infiltration rate is defined as the rate at which soil is able to absorb rainfall or irrigation water (Ahaneku, 2011). It is a fundamental variable in irrigation processes, as its influence on the movement of water over the soil is considerable (Aljoumani, 2012). Moreover, it is employed in planning water-conservation techniques (Mbagwu, 1993). The infiltration rate varies with the applied water quality (Warrence et al., 2002). The two most common water-quality factors influencing infiltration rate are the salinity of the water and its sodium content relative to calcium and magnesium content. The concentration of sodium relative to calcium and magnesium is the sodium adsorption ratio (SAR). It is a measure of the suitability of water for use in agricultural irrigation. In general, the higher the SAR, the less suitable the water is for irrigation. The infiltration rate generally decreases with either a decrease in salinity or increase in sodium content relative to calcium and magnesium. High sodium levels in irrigation water will lead to a decrease in the infiltration rate because of soil dispersion and structure breakdown (Shainberg and Letey, 1984). El-Morsy et al. (1991) found that the SAR of irrigation water significantly affects the water-transmission properties of the soil. They concluded that the electric conductivity of irrigation water (EC) significantly affects the infiltration rate of the soils. Borselli et al. (2001) investigated the effects of water quality on the infiltration rates of non-saline, non-sodic soils during simulated rain experiments. The results indicated that when tap water was used, the infiltration rates were significantly overestimated by more than 100%. The silty-clay soil was more affected by the water quality than the silt-loam soil, with respect to infiltration and runoff production. Emdad et al. (2004) studied the effect of EC and SAR on the infiltration rate under laboratory conditions. Water with 3 different levels of sodium (SAR = 0.9, 10, and 30) was employed as an alternative treatment to a clay-loam soil. The application of medium-to-high SAR of water was found to reduce the total depth of infiltration and final infiltration rate. Ahaneku (2011) employed a double-ring infiltrometer to determine the infiltration rate in a sandy-loam soil. The results showed that a maximum cumulative infiltration of 122 mm was observed for the sandy-loam soil after 4 h. A steady-state infiltration rate of 30 mm/h was observed for the sandy-loam soil after 3 h. Patel et al. (2011) measured the infiltration rate using a double-ring infiltrometer. Water with different SAR and salinity levels was used for the infiltration study. The results showed that the SAR affected the infiltration rate in the soil. Gharaibeh and Eltaif (2014) conducted field experiments on a rained clayey soil to investigate the impact of water quality on cumulative infiltration. Compared to fresh water, the treated wastewater significantly reduced the cumulative infiltration.
Most of the studies investigating the effect of water quality on infiltration have been conducted under laboratory conditions using disturbed or repacked soil cores and conditions, which do not accurately represent field conditions (Shainberg and Letey, 1984). Therefore, the main objective of this study was to evaluate the effect of SAR and electric conductivity of the applied water on infiltration in a sandy-loam soil.
MATERIALS AND METHODS
Experimental-site characteristics
The experimental site was located in the Huraimla government, Saudi Arabia. The particle sizes of the soil were determined using standard methods. The soil at the trial site has a uniform sandy-loam texture (67% sand, 7% clay, and 26% silt). The organic matter was 2.4%. Table 1 presents the chemical analysis of the trial site. The site was cultivated with date palm trees, and irrigation was employed by filling a soil circle around the trees with water at a specific time.
Prior to the infiltration run, 5 samples of soil were obtained from a depth of 21 cm using an auger. The initial moisture content of the soil and bulk density were determined using standard laboratory procedures. However, the average initial moisture content and bulk density of the soil were 13.56% (dry base) and 1.48 g/cm3, respectively. Water was obtained from different sources: wells and municipal water. These water sources represented 5 different site water qualities. The chemical properties of the five water sources, including SAR and electric conductivity are presented in Table 1. SAR was calculated using the following equation (Suarez et al., 2006):

where Na+, Ca++, and Mg++ are the concentrations expressed in milli-equivalents per litre (meq/L).
Experimental procedures
Five representative points around a date palm tree were selected. The tests were conducted in October 2014. Infiltration was measured after 4 weeks of the irrigation process. The double-ring infiltrometer was used in a manner similar to the procedure described by Diamond and Shanley (2003). Five types of water qualities were transported to the site in 2 barrels with a capacity of 100 L. Each water quality occupied 2 barrels. The height of the double-ring infiltrometer was 30 cm, and the inner and outer diameters of the galvanised iron rings were 30 cm and 60 cm, respectively. The rings were driven approximately 10-cm deep into the soil using a falling weight-type hammer by striking on a wooden plank placed on top of the ring uniformly and without undue disturbance to the soil surface. The water was poured gradually into the inner cylinder. The outer cylinder, which acted as a buffer, was also filled with water to the same level to minimise the lateral seepage from the inner cylinder. A graduated ruler was placed in the inner ring. The ruler was adjusted to the desired level to which water was poured. A stopwatch was used to record the time at which the water began to infiltrate. The soil intake rate was measured directly by observing the rate at which the water level declined with respect to time. The experiments were conducted for 180 min for sandy-loam soil as described by Uloma et al. (2014). This was done because the infiltration process of soil usually takes 120-360 min to reach a steady state, as reported by Lili et al. (2008). The inner ring was under observation to determine the infiltration rate. Three infiltration measurements were conducted using each type of water, and the average was considered. The randomisation technique was used to choose the measurement points.
Kostiakov's infiltration model
Although many infiltration models exist, some of the empirical models have been quite popular and are frequently used in various water-resource applications worldwide due to their simplicity, yielding reasonably satisfactory results in most applications (Uloma et al., 2014). One of the empirical models for infiltration is Kostiakov's infiltration model (Kostiakov, 1932), which is derived using the data observed under either field or laboratory conditions. In this model, in the equation at time t = 0, the infiltration rate is infinite and at time t = ∞, the rate tends to zero. The equation is as follows.

where t is the time elapsed in the experiment, Z is the cumulative infiltration, and α and κ are the empirical constants, which are site specific, depending on different parameters (Uloma et al., 2014). In most studies, the parameter α is considered to be below 1 (Al-Azawi, 1985; Moroke et al., 2009). To determine the parameters α and κ, logarithm is employed on both sides of Eq (2). The equation is now expressed as follows:

A plot of log Z against log t gives a straight line whose slope gives the value of α, while log κ gives the intercept. The value of κ was obtained from the anti-log κ; i.e.

The instantaneous infiltration rate is obtained by integrating Eq. 2 as follows.

RESULTS
Chemical properties of soil and water
Table 1 indicates that the electric conductivity value (ECsoil) of the soil is 5.6 dS/m, and the pH of the soil is 9. Regarding the chemical properties, sodium is the most predominant soluble cation with a value of 35.1 meq/L, followed by calcium, whereas chloride is the predominant anion followed by sulphate.
The electrical conductivity (EC) value of the water samples varied from 1.74 to 3.25 dS/m with an average value of 2.39 dS/m. The SAR value of the water samples varied from 3.34 to 7.60, with an average value of 4.68. From this point of view, considering the combination of ECw and SAR values, it seems that the water of the study area is suitable for irrigation, and can be classified in the 'no restriction' category as shown in Table 2.
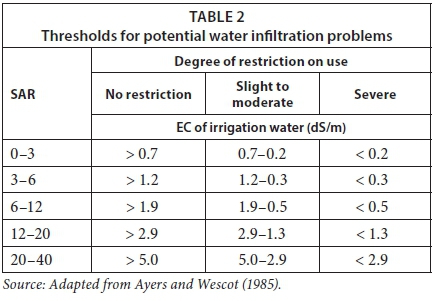
Figure 1 shows a positive correlation between EC and SAR of water used in the infiltration experiments with a coefficient of determination (R2) = 0.7708. The high variation in SAR could be the cause of the low value of R2. However, Alobaidy et al. (2010) demonstrated a positive correlation between EC and SAR with low coefficient of determination (R2) = 0.193. Also, Aggag (2016) reported a positive correlation between EC and SAR with a coefficient of correlation (R) = 0.60. Figure 2 shows the correlation between the SAR and chloride concentration in water used in the infiltration experiments (Cl); a positive correlation between Cl and SAR with a coefficient of determination (R2) = 0.5122 is observed. Again, the high variation in SAR could be the cause of the low value of R2. However, Aggag (2016) demonstrated a positive correlation between Cl and SAR with a coefficient of correlation (R) = 0.60 and in this study Cl concentration ranged from 7.8-23.4 mg/L (mean was 211.58 mg/L and standard deviation was 83.01 mg/L).


Infiltration-rate analysis
The results of this study showed that after 180 min of measurement in the sandy-loam soil, the final infiltration rates were in the range of 21.1-44.0 mm/h for the studied water quality with an average value of 33.8 mm/h (Fig. 3). The graphical plot of infiltration vs. time shows that the infiltration rate at the initial time was high, in the order: 305 > 240 > 137 > 104 > 65 mm/h for SAR of 3.34, 3.52, 4.14, 4.18, and 7.60, respectively. The initial rate was the highest (305 mm/h) for an SAR of 3.34; the initial rate (65 mm/h) was the lowest for an SAR of 7.60. Thus, the SAR affects the initial water intake of soil. The initial infiltration rate decreased by 79% when the SAR increased from 3.34 to 7.60. However, the slow infiltration rate of the irrigation with high SAR would lead to an increase in the irrigation time required to achieve the necessary considered water depth. The data obtained in this study show that the final infiltration rate after 180 min in the sandy-loam soil could be predicted by using the EC and SAR of the water using the following equation.


where IRf (mm/h) is the final infiltration rate after 180 min in the sandy loam soil, EC (dS/m) is the water electric conductivity (dS/m), and SAR is the sodium adsorption ratio calculated from the concentrations of sodium, calcium, and magnesium in irrigation water, in meq/L.
Cumulative-infiltration analysis
Figure 4 shows the average cumulative infiltration depth, Z, and the cumulative infiltration after 180 min from the initial time of measurement for the sandy-loam soil; the cumulative infiltration depths were in the range of 63.3-132.0 mm for the different types of water qualities with an average value of 101.4 mm. Moreover, for the data obtained in this study, the final cumulative infiltration depth after 180 min in the sandy-loam soil could be predicted using EC and SAR of the water in the following equation:

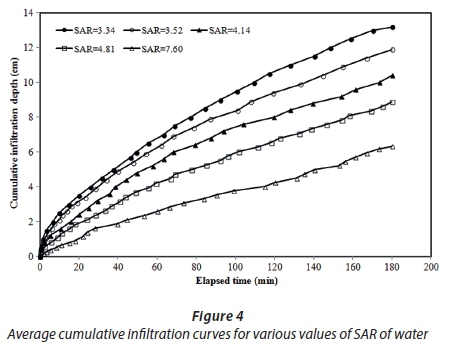
where Zf (mm) is the final cumulative infiltration depth after 180 min in a sandy-loam soil, EC (dS/m) is the water electric conductivity (dS/m), and SAR is the sodium adsorption ratio calculated from the concentrations of sodium, calcium, and magnesium in irrigation water, in meq/L.
Estimation of Kostiakov-model parameters
The average cumulative infiltration depth Z and cumulative infiltration time t were employed to estimate the Kostiakov model parameters (Eq. 2) for each water quality. Each model was first transformed into its linear equivalent, wherein Z and t are the dependent and independent variables, respectively. The coefficients of the linear functions are the model parameters to be estimated. The values of the parameters estimated were then incorporated into the respective model equations, and the capability of each model in simulating the cumulative infiltration depth for each SAR was analysed. Figure 5 depicts variations in cumulative infiltration parameters α and κ with respect to the SAR of the water. The coefficient of determination of the infiltration data was R2 > 0.90. It is clear that α decreased with the increase in the SAR, which was highest for SAR = 3.34, and lowest for SAR = 7.60, whereas the trend in the κ values was the opposite. Table 3 gives the summary of the Kostiakov's parameters (Eq. 2) obtained for the various values of SAR. The parameters obtained could be employed in estimating the amount of irrigation water that could be used over a period of time t for soils during irrigation design. They could also help to determine the time required for water to infiltrate the soils (Uloma et al., 2014).
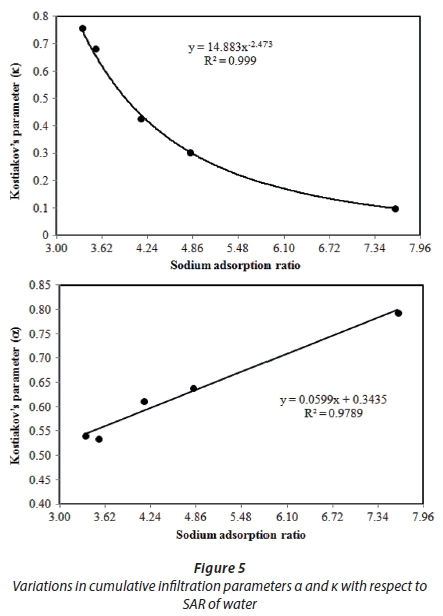

The average values of the time exponent (α) in the Kostiakov equation ranged between 0.5416 and 0.7934 depending on the water quality, which was in accordance with the theory of infiltration, wherein the value is positive and always less than unity (Ogbe et al., 2011). However, most observed values lie between 0.2 and 0.9 (Blair and Reddell, 1983). The values of these parameters do not possess any specific physical meaning; however, they reflect the effect of the physical properties of the soil influencing the infiltration rate as well as the antecedent soil moisture content and surface conditions (Zerihun and Sanchez, 2003). A fair correlation of the power relationship (R2 = 0.999) between (α) of the Kostiakov equation and SAR (Fig. 5) was observed. A similar correlation was also observed for the linear relationship (R2 = 0.999) between (κ) of the Kostiakov equation and SAR (Fig. 5). Using the data obtained in this study, the Kostiakov's parameters (Eq. 2) could be predicted by employing EC and SAR of the water as follows.
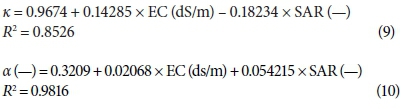
where κ and α are the Kostiakov's parameter (Eq. 2).
DISCUSSION
The cationic composition of the studied soil could be arranged in descending order as: Na > Ca > Mg > and K, while Cl dominates the anionic composition followed by SO4 and HCO3. The linear relation between EC and SAR for the applied water is in agreement with the results obtained by Alobaidy et al. (2010) and Moasheri et al. (2012). Honarbakhsh and Lafdani (2013) also obtained a positive correlation between SAR and Cl of a water with R2 = 0.6524.
The infiltration process depends on the water quality for a specific set of soil characteristics. However, the basic infiltration rate for a sandy-loam soil ranged from 20-30 mm/h (Makungo and Odiyo, 2011). In this study, the measured steady-state infiltration rates vary slightly compared to the basic infiltration rates. This is because local variations in the soil structure may have led to the variation in the infiltration rates (Makungo and Odiyo, 2011). Moreover, Rahman (2010) obtained an infiltration rate of 31.99 mm/h for a sandy-loam textured soil, and clarified that, due to increased soil sand content, water movement increases as a result of the relative increase in soil pores.
This study demonstrates that the infiltration rate depends on water quality for a specific soil texture. For instance, the increase in SAR encourages lower infiltration, whereas infiltration increases with a decrease in SAR. Shainberg and Letey (1984), who reported that infiltration decreases with either a decrease in salinity or an increase in sodium content relative to calcium and magnesium, verify this observation. However, the infiltration rate decreases with an increase in the sodium levels in the irrigation water because the soil disperses and the structure fails. This reduces the hydraulic conductivity, or the rate at which water moves through the soil.
The effects of high SAR on the irrigation-water infiltration rate depends on the electrical conductivity of the water (e.g. Hanson et al., 1999). For a given SAR, the lower the EC, the poorer are the infiltration properties, and the higher the EC, the better is the infiltration (Camberato, 2001). The infiltration rate generally increases when the water is saltier and decreases with higher SAR values. El-Morsy et al. (1991) showed that soils irrigated with water of high SAR are particularly susceptible to physical disruption leading to low infiltration rate. Moreover, Oster et al. (1992) explained that irrigation waters having an SAR between 3.1 and 6 are likely to cause infiltration problems if the electric conductivity of water is below 0.4 dS/m.
CONCLUSIONS
The results show that the infiltration rates at the site are directly related to the quality of water applied. The final infiltration rates after 180 min for the different types of water quality varied between 21.1 and 44.0 mm/h, with an average value of 33.8 mm/h. The parameters of the Kostiakov model (κ and α) employed to calculate the cumulative infiltration depth showed variation between the tested waters. The Kostiakov model is suitable to predict the infiltration rates in the sandy-loam soil for all types of selected waters.
ACKNOWLEDGEMENTS
The authors are grateful to King Abdulaziz City for Science and Technology (KACST) for funding the research project (Grant No. ARP-33-51).
REFERENCES
AGGAG AM (2016) Evaluation of water quality and heavy metal indices of some water resources at Kafr El-Dawar region, Egypt. Alexandria Sci. Exchange J. 37 337-348. [ Links ]
AHANEKU IE (2011) Infiltration characteristics of two major agricultural soils in north central Nigeria. Agric. Sci. Res. J. 17 166-171. [ Links ]
AL-AZAWI SA (1985) Experimental evaluation of infiltration models. J. Hydrol. (NZ). 24 77-88. [ Links ]
ALJOUMANI B (2012) Soil water management: Evaluation of infiltration in furrow irrigation systems, assessing water and salt content spatially and temporally in the Parc Agrari del Baix Llobregat area. PhD dissertation, Universitat Politècnica de Catalunya Campus Tecnològic de la Mediterranea. [ Links ]
ALOBAIDY MAA, AL-SAMERAIY MA, KADHEM AJ and ABDUL MAJEED A (2010) Evaluation of treated municipal wastewater quality for irrigation. J. Environ. Prot. 1216-225. https://doi.org/10.4236/jep.2010.13026 [ Links ]
AYERS RS and WESCOT DV (1985) Water quality for agriculture. FAO Irrigation & Drainage Paper No. 29. FAO, Rome. [ Links ]
BLAIR AW and REDDELL DL (1983) Evaluation of empirical infiltration equation for blocked furrow infiltrometer. In: Chicago, ASAE Winter Meeting. Paper No. 83-2521. [ Links ]
BORSELLI L, TORRI D, POESEN J and SANCHIS PS (2001) Effects of water quality on infiltration, runoff and interrill erosion processes during simulated rainfall. Earth Surf. Process. Landforms 3 329-342. https://doi.org/10.1002/1096-9837(200103)26:3<329::AID-ESP177>3.0.CO;2-Y [ Links ]
CAMBERATO J (2001) Irrigation Water Quality: update from the 2001 Carolinas Golf Course Superintendents Association, Clemson University Turfgrass Program. URL: http://www.scnla.com/Irrigation_Water_Quality.pdf (Accessed 30 April 2017). 1-13. [ Links ]
DIAMOND J and SHANLEY T (2003) Infiltration rate assessment of some major soils. Irish Geogr. 1 32-46. https://doi.org/10.1080/00750770309555810 [ Links ]
EL-MORSY EA, MALIK M and LETEY J (1991) Interaction between water quality and polymer treatment on infiltration rate and clay migration. Soil Technol. 4 221-231. https://doi.org/10.1016/0933-3630(91)90003-6 [ Links ]
EMDAD MR, RAINE SR, SMITH RJ and FARDAD H (2004) Effect of water quality on soil structure and infiltration under furrow irrigation. Irrig. Sci. 2 55-60. https://doi.org/10.1007/s00271-004-0093-y [ Links ]
GHARAIBEH MA and ELTAIF NI (2014) Impact of water quality, cultivation, and cropping systems on infiltration and physical properties of an arid clay soil. Soil Water Res. 9 127-134. [ Links ]
HONARBAKHSH A and LAFDANI EK (2013) Performance comparison of ANN and geo statistics methods for estimating spatial distribution of sodium adsorption ratio (SAR) in groundwater. Int. J. Agric. Crop Sci. 23 2837-2844. [ Links ]
KOSTIAKOV AN (1932) The dynamics of the coefficient of water percolation in soils and the necessity for studying it from a dynamic point of view for purpose of amelioration. Soc. Soil Sci. 14 17-21. [ Links ]
LILI M, BRALTS VF, YINGHUA P, HAN L and TINGWU L (2008) Methods for measuring soil infiltration: State of the art. Int. J. Agric. Biol. Eng. 1 22-30. [ Links ]
MAKUNGO R AND ODIYO JO (2011) Determination of steady state infiltration rates for different soil types in selected areas of Thulamela municipality, South Africa. URL: http://www.ru.ac.za/static/institutes/iwr/SANCIAHS/2011/the.pdffiles/R_Makungo_Paper.pdf. (Accessed 30 April 2017). [ Links ]
MBAGWU JSC (1993) Analysis of physical properties controlling steady-state infiltration rates on tropical savannah soils. Internal Report No. IC/93/289, International Centre for Theoretical Physics, Italy. [ Links ]
MOASHERI A, TABATABAI SM, SARANI N and ALAI Y (2012) Estimation spatial distribution of sodium adsorption ratio (SAR) in groundwater's using ANN and geostatistics methods, the case of Birjand Plain, Iran. International Conference on Chemical, Ecology and Environmental Sciences (ICEES'2012), 17-18 March 2012 Bangkok. 123-129. [ Links ]
MOROKE T, DIKINYA O and PATRICK C (2009) Comparative assessment of water infiltration of soils under different tillage systems in eastern Botswana. Phys. Chem. Earth A/B/C 4 316-323. https://doi.org/10.1016/j.pce.2008.08.002 [ Links ]
OGBE VB, JAYEOBA OJ and ODE SO (2011) Comparison of four soil infiltration models on a sandy soil in Lafia, Southern Guinea Savanna Zone of Nigeria. Prod. Agric. Technol. J. 2 116-126. [ Links ]
OSTER JD, SINGER MJ, FULTON A, RICHARDSON W and PRICHARD T (1992) Water penetration problems in California soils: prevention, diagnoses and solutions. Kearney Foundation of Soil Science, DANR, University of California. [ Links ]
PATEL BB, PATEL BB and DAVE RS (2011) Studies on infiltration of saline-alkali soils of several parts of Mehsana and Patan districts of North Gujarat. J. Appl. Technol. Environ. Sanit. 1 87-92. [ Links ]
RAHMAN GA (2010) A study of infiltration rate in South West region of Burkina Faso. Aus. J. Basic Appl. Sci. 6 1349-1357. [ Links ]
SHAINBERG I and LETEY J (1984) Response of soils to sodic and saline conditions. Hilgardia 2 1-57. https://doi.org/10.3733/hilg.v52n02p057 [ Links ]
SUAREZ DL, WOOD JD and LESCH SM (2006) Effect of SAR on water infiltration under a sequential rain-irrigation management system. Agric. Water Manag. 86 150-164. https://doi.org/10.1016/j.agwat.2006.07.010 [ Links ]
ULOMA AR, SAMUEL AC and KINGSLEY IK (2014) Estimation of Kostiakov's infiltration model parameters of some sandy loam soils of Ikwuano - Umuahia, Nigeria. Open Trans. Geosci. 1 34-38. https://doi.org/10.15764/GEOS.2014.01005 [ Links ]
WARRENCE NJ, BAUDER JW and PEARSON KE (2002) Basics of salinity and sodicity effects on soil physical properties. Department of Land Resources and Environmental Sciences. Montana State University, Bozeman. URL: http://waterquality.montana.edu/docs/methane/basics.pdf (Accessed 30 April 2017). [ Links ]
ZERIHUM D and SANCHEZ CA (2003) A draft procedure for development of management curves for basins irrigation on the coarse texture soil of the Yuma MESA. URL: www.ag.arizona.edu/aes/yac/researchdawit (Accessed 15 October 2011). [ Links ]
Received 2 May 2017
Accepted in revised form 12 January 2018
* To whom all correspondence should be addressed. e-mail: elmarazky58@gmail.com

