


Servicios Personalizados
Articulo
 Inglés (pdf)
 Articulo en XML
 Referencias del artículo
Indicadores

Links relacionados
-
 Citado por Google
 -
 Similares en Google
Compartir

 Permalink
Water SA
versión On-line ISSN 1816-7950
versión impresa ISSN 0378-4738
Water SA vol.44 no.1 Pretoria ene. 2018
http://dx.doi.org/10.4314/wsa.v44i1.09
http://dx.doi.org/10.4314/wsa.v44i1.09
Severe weather over the Highveld of South Africa during November 2016
Lee-ann SimpsonI, *; Liesl L DysonII
ISouth African Weather Service, 442 Rigel Avenue, Erasmusrand, Pretoria, 0181
IIDepartment of Geography Geoinformatics and Meteorology, University of Pretoria, Pretoria
ABSTRACT
November months are notorious for severe weather over the Highveld of South Africa. November 2016 was no exception and a large number of severe events occurred. Very heavy rainfall, large hail and tornadoes were reported. The aim of this paper is to compare the synoptic circulation of November 2016 with the long-term mean November circulation and to investigate some sounding derived parameters. Furthermore, a few of the severe weather events are described in detail. The surface temperatures and dewpoint temperatures were found to be higher than normal resulting in increased conditional instability over the Highveld. Low-level moisture originated over the warm Mozambique Channel and the 500 hPa temperature trough was located favourably over the Highveld; further east than normal. The combination of these factors and weak steering winds resulted in flash flooding on the 9th while favourable wind shear conditions caused the development of a tornado on 15 November. The favourable circulation patterns and moisture gave rise to an atmosphere in which severe weather was a possibility, and the awareness of such factors is used as one of many tools when considering the severe weather forecast. The consideration of the daily variables derived from sounding data were good precursors for the prediction of severe thunderstorm development over the Highveld during November 2016. It is recommended that an operational meteorologist incorporates upper air sounding data into the forecasting process and not to rely on numerical prediction models exclusively.
INTRODUCTION
November 2016 (henceforth Nov16) saw several severe weather events over the Highveld of South Africa. This was in sharp contrast to the very dry conditions which had prevailed over large parts of South Africa since 2015. The summer rainfall areas of South Africa were in the grip of a severe drought; in the 12 months from July 2015 to June 2016 only a fraction of South Africa received normal yearly rainfall (SAWS, 2017). The Northern Cape, North West and Free State provinces received less than 50% of their average rainfall. Over the Highveld during this period, rainfall was around 75% of the norm. The media was full of reports of water drives where ordinary people helped to collect water and distribute it to drought-stricken areas (News24, 2017). The very dry conditions continued into October 2016 with only isolated reports of good rainfall over the eastern half of the country. The large metropolitan areas in Gauteng all instated water restrictions, as early as September 2016 in the City of Johannesburg but followed soon after by the other metros (City of Johannesburg, 2017). By 7 November, the Vaal Dam had reached close to 25% capacity and water was released from the Sterkfontein Dam to replenish the water in the Vaal Dam (DWA, 2017a). The situation was exacerbated as heat waves occurred over the Highveld during late October 2016 with the mean October 2016 maximum temperatures being between 2-4°C warmer than the climate over the Highveld (SAWS, 2016a).
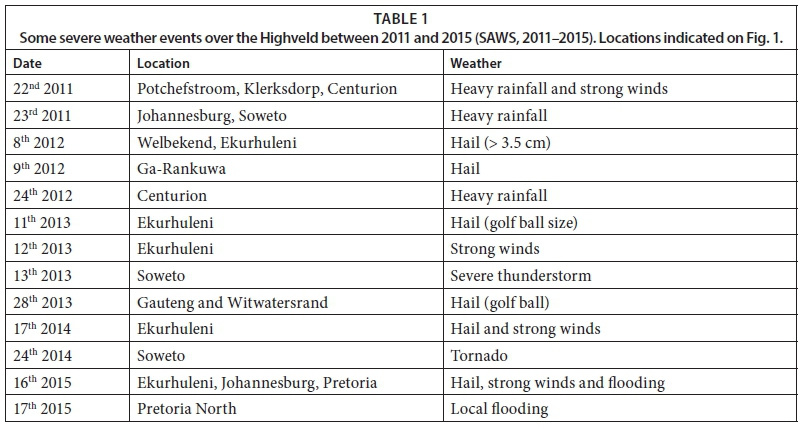
Severe weather events over the Highveld are not uncommon in November months. One of the worst documented hailstorms in Pretoria occurred on 1 November 1985 (Terblanche, 1985). More recently, in 2012 and 2013, large hail fell over Gauteng resulting in a dramatic increase in hail-related insurance claims (Piennaar and Dyson, 2015). Rae (2015) identified 4 supercells in November months over the Highveld between 2007 and 2013. A supercell is characterised by a deep mesocyclone and is an important small-scale weather system (from 2-20 km) as it is often associated with disastrous weather (Moller et al., 1994). Climate summaries of the South African Weather Service (SAWS) for November months make interesting reading and Table 1 lists a few severe events from 2011 to 2015 over the Highveld. Even in 2015, when rainfall over the Highveld was below normal, severe weather occurred in the form of localised heavy rainfall and hail.
Dyson (2009) indicated that on average there are 3.5 days per November with at least 1 station over Gauteng measuring rainfall greater than 50 mm in 24 h. In January months there are, on average, double the number of days with rainfall of more than 50 mm. There have been 135 days in November between 1977 and 2013 when rainfall exceeded 50 mm in a 24 h period at a station over Gauteng, and in 2001 there was a record number of 10 such days. The highest daily November rainfall over Gauteng at a station also occurred in this month, when 200 mm fell over the extreme southern parts of the province on 26 November. The average monthly November rainfall over the Highveld varies between 80 and 100 mm but increases to around 150 mm on the eastern escarpment.
The aim of this paper is to discuss the severe weather events of Nov16 over the Highveld of South Africa and to demonstrate the circulation anomalies during this month.
METHODOLOGY
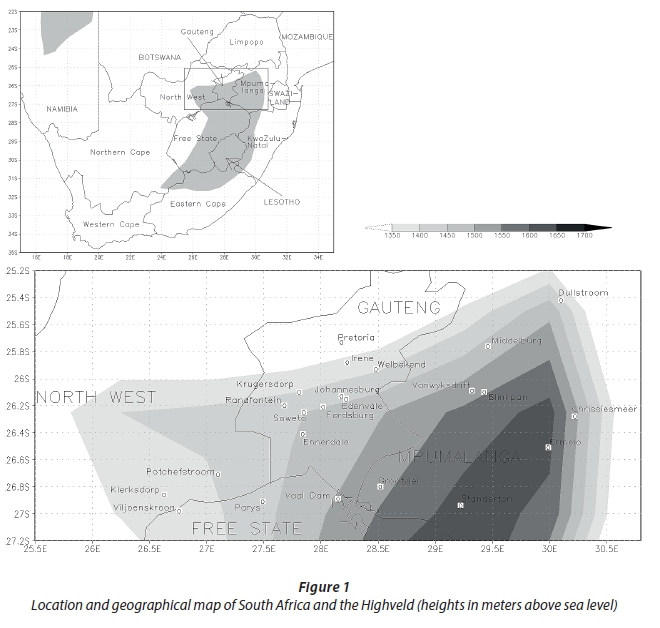
In this paper the Highveld is defined as the elevated area over eastern South Africa enclosed by the 1 350 m isohyet (Fig. 1) but confined to the North West, Gauteng and Mpumalanga provinces, as well as the extreme northern parts of the Free State.
The monthly synoptic maps were created with National Centers for Environmental Prediction (NCEP) reanalysis data (Kalnay et al., 1996) and the 6 pressure levels available from 850 to 300 hPa were used for the analysis. NCEP data have 4 time-steps available per day and the long-term average maps were constructed by using all of the time steps. The sounding-derived variables were produced by using data from the radiosonde ascents done over Gauteng at the SAWS Irene Weather Office (Fig. 2). The average values were calculated for November months from 1976 to 2014. The quality control processes as well as the rationale for the different sounding parameters are explained in detail by Dyson et al. (2015).
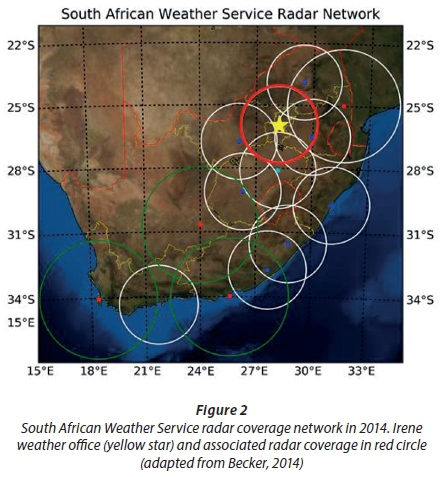
Daily total rainfall data and monthly means for stations over the Highveld, as well radar data from the Irene radar, were provided by SAWS. The Irene radar is an S-band radar (Becker, 2014) that measures reflectivity in decibels (dBZ), and the imagery used is taken from a plan view perspective using the 200 km volume data. The Irene radar was out of order on 9 November 2016 therefore the radar data will only be used in the case study discussion for 15 November 2016.
Satellite data were obtained from Eumetsat (2017a) and visualised through Software for the Utilization of Meteosat Outlook activities (SUMO). Single-channel imagery, such as the high-resolution visible (HRV) and infrared (IR) channel 10.8 µm were investigated including Red Green blue (RGB) combination imagery such as the Day Microphysical (DM), Severe Storms (SS) and Overshooting Tops (OT). The DM RGB comprises of channels 2:4r:9. The SS RGB comprises of channels 5-6:4-9:3-1, and can be used to determine whether a storm is growing rapidly. Bright yellow areas appearing at the cloud top within an orange area are a sign of an active and strong updraft with small ice particles (Eumetsat, 2017b). The OT RGB comprises of channels 5-9:8-9:5i and can be used to determine the presence of overshooting tops, which display as small, isolated, bright white areas appearing during thunderstorm formation (De Coning, 2014).
RESULTS
Weather and rainfall during November 2016
Even though November months over the Highveld are known for severe weather, Nov16 had an anomalously high number of events (Table 2). Information about the events was obtained from SAWS Climate Summary publications, as well as social media sources, but was confirmed by investigating alternative data such as radar, satellite images and synoptic maps. Photo evidence gathered from social media outlets was also a contributing factor to including the event. Tornados were reported on 5 days and occurred over the elevated areas of the Witwatersrand and escarpment of Mpumalanga. Other hazards include strong winds, hail and heavy rainfall. The tornado at Grootvlei on 15 November will be discussed in detail later.
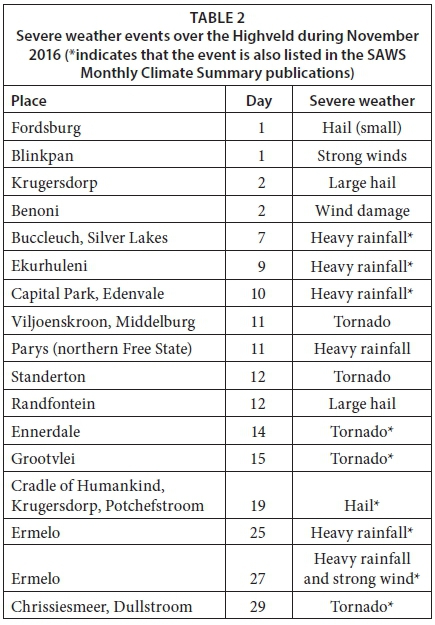
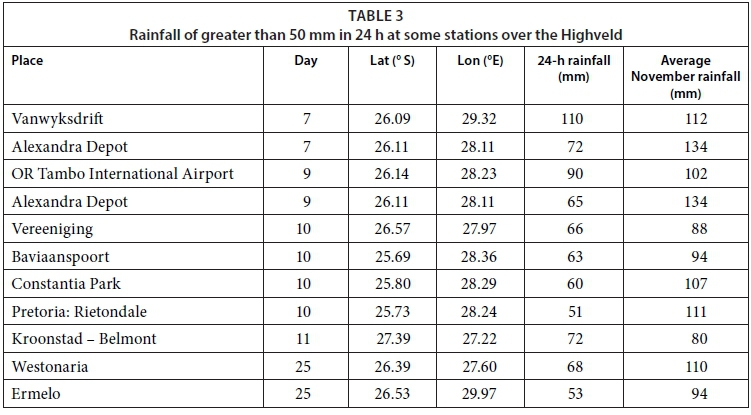
Table 3 shows some of the stations over the Highveld where more than 50 mm occurred in 24 h in Nov16. The highest rainfall totals were reported early in the month. At Vanwyksdrift on the 7th, the long-term monthly average rainfall for November (112 mm) was almost matched with the measurement of 110 mm within 24 h. The next closest occurrence of a daily event almost matching its long-term monthly average was at OR Tambo International Airport, which received 90 mm on the 9th. This was the third-highest rainfall reported at the airport since 1978 and is indicative of the severity of the event, as reports of extensive damage and loss of infrastructure, and the tragic loss of life of a young child dominated the news (News24, 2016). It is interesting to note the isolated nature of the heavy rainfall as only 8 mm was reported on the same day at the Johannesburg Botanical Garden, which is approximately 24 km west of OR Tambo International airport. This weather event will be discussed in more detail later. On the 25th, Ermelo Weather Office recorded 53 mm, with 43 mm recorded on the 27th. The monthly Nov16 rainfall at Ermelo was 259 mm which is close to 3 times the November average.
Synoptic circulation and sounding parameters during November 2016
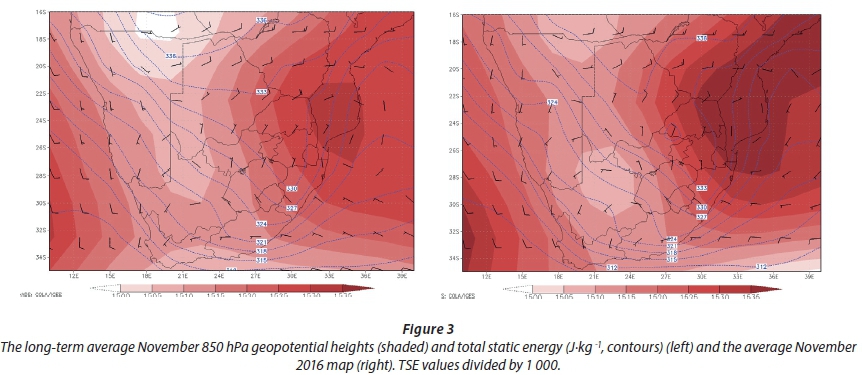
Synoptic maps of Nov16 are compared to the long-term mean (1979-2014) November circulation. Considering the circulation patterns at 850 hPa, a trough over the western interior and a high over Mozambique are characteristically found during November (Fig. 3). During Nov16 the circulation does not vary much from the long-term mean but a closed low is present over the central interior and the high over Mozambique is 5-10 gpm stronger than the long-term November mean. This high also stretches further north into the southern parts of the Mozambique Channel resulting in slightly stronger moisture bearing north-easterly winds into the Highveld.
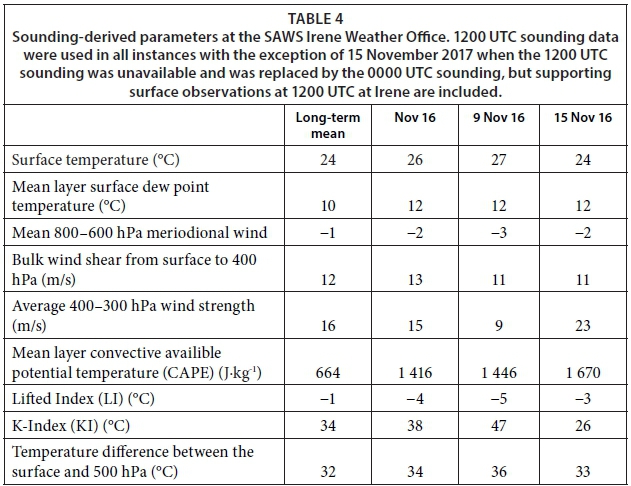
This north-easterly flow is also reflected in the sounding parameters (Table 4) where the average 800-600 hPa northerly component (negative values) of the meridional wind is stronger than normal. The sea surface temperatures in the central Mozambique Channel were close to 29°C in Nov16 and 0.5-1.5°C warmer than the long-term mean (NOAA, 2017). The blue contours in Fig. 3 show values for Total Static Energy (TSE), which is calculated using Eq. 1. TSE may be used to indicate the properties of an air mass (Dyson and van Heerden, 2002) and the higher values over the Highveld in Nov16 show that the combination of moisture, geopotential and temperature resulted in the airmass being more conducive for the development of thundershowers than the long-term mean would suggest.

where: L = latent heat of condensation, q = mixing ratio, g = gravitational constant, z = geopotential height, Cp= specific heat of dry air, T = temperature.
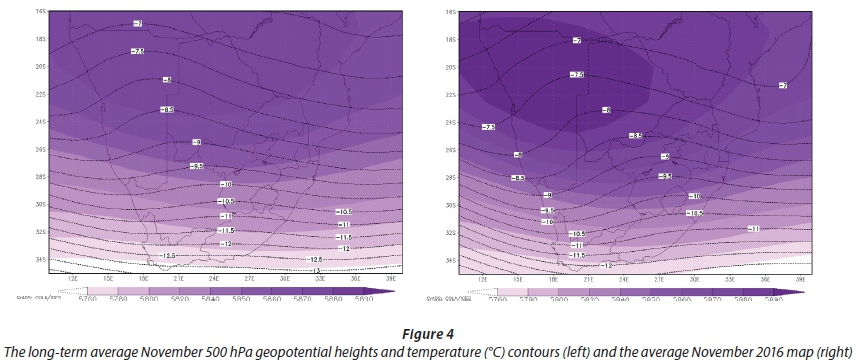
In Nov16 at 500 hPa the subtropical high was stronger than normal but with the maximum values displaced towards the west over Namibia (Fig. 4). In general, Nov16 geopotential heights at 500 hPa were higher over the Highveld than the long-term mean and, in correlation, the temperatures were also somewhat higher. Nevertheless, the 500 hPa temperature trough was situated further east compared to the long-term mean and located over the Highveld (contours in Fig. 4).
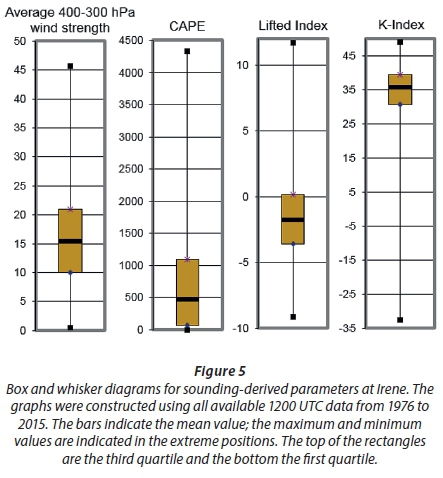
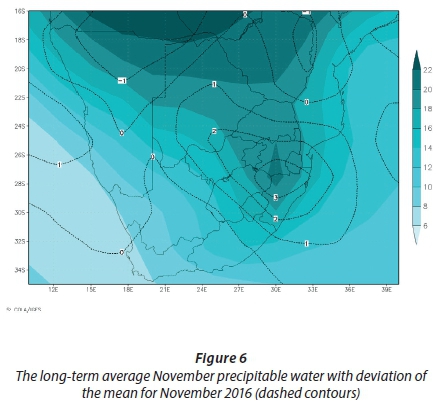
The trough in the 500 hPa temperature field is indicative of advection of cooler air to its east thereby increasing mid-tropospheric instability. The location of the temperature trough corresponds to the results of Pienaar and Dyson (2015) when investigating the atmospheric circulation during November 2012 and 2013, when large hail occurred over the Highveld. In the sounding data the larger values of temperature lapse rate between the surface and 500 hPa show that even though the temperatures at 500 hPa was slightly warmer than the norm the conditional instability in Nov16 was higher. Other variables which deal with instability were also very favourable during Nov16. The Lifted Index (LI) (Costa et al., 2011) was nearly 3°C and the K-index (KI) (Henry, 2000) 5°C more favourable than the long-term mean. The average Nov16 CAPE (Doswell and Rasmussen, 1994) values were more than double that of the long-term mean for November. Comparing Fig. 5 with Table 4 shows just how favourable the instability parameters were in 2016. The KI and CAPE values for Nov16 were all more favourable than the long-term mean upper quartile, and for the LI than the lower quartile. The increased instability is largely influenced by the above-normal surface temperature and dew-point temperature (Table 4). The moisture throughout the troposphere was above normal with precipitable water values during Nov16 that were 2-3 mm higher than the long-term mean (Fig. 5).
The increased instability is largely influenced by the above-normal surface temperature and dew-point temperatures (Table 4). The moisture throughout the troposphere was above normal, with precipitable water values during Nov16 that were 2-3 mm higher than the long-term mean (Fig. 6).
CAPE and wind-shear values are often used together to identify severe storm environments (Craven and Brooks, 2004; Dupilka and Reuter, 2006). The average Nov16 value of wind shear between the surface and 400 hPa is only slightly larger than the long-term mean November value. However, Dyson et al. (2015) indicated that wind-shear values peak in October and November months at Irene. The results in Table 4 indicate that the relationship between CAPE and wind shear in Nov16 was optimal for the development of severe storms.
Significant weather events during November 2016
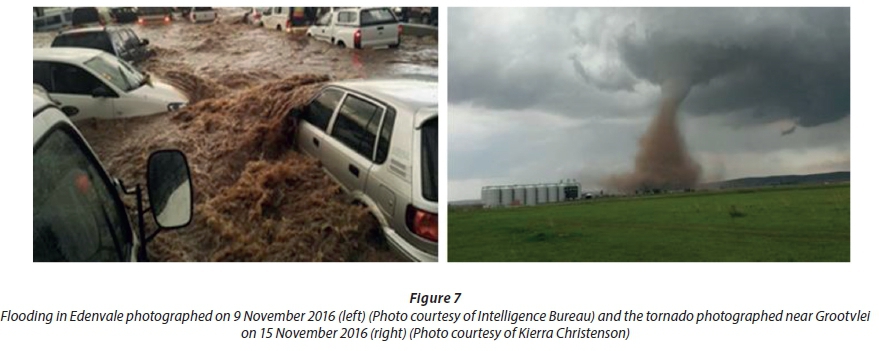
After South Africa having experienced an exceptionally dry period from 2014 to 2016, the frequency of heavy rainfall and severe weather events in Nov16 was not only a welcome break from this dry period but some events caught the attention of the public and media alike. Two such events were the heavy rainfall and resultant flash flooding of 9 November in Edenvale, where multiple media outlets reported that hundreds of motorists found themselves trapped in a deluge of water on one of the countries busiest highways during peak-hour traffic (News24, 2016). There were subsequent media reports of cars and people being washed away in the flood waters, (Fig. 7) including an infant girl who was tragically ripped from her father's arms and drowned as a result. The other significant event was the tornado near Grootvlei on 15 November, which tracked along a path over open ground, and for which very little damage to infrastructure was reported in the media after the event. This event was well documented on social media due to the impressive funnel cloud which tracked close to a main highway (Fig. 7).
Flooding in Edenvale, Gauteng, on 9 November 2016
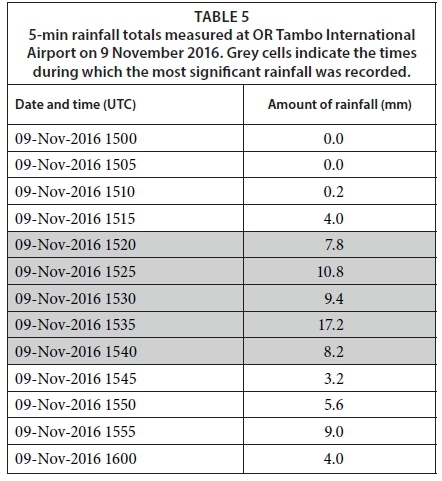
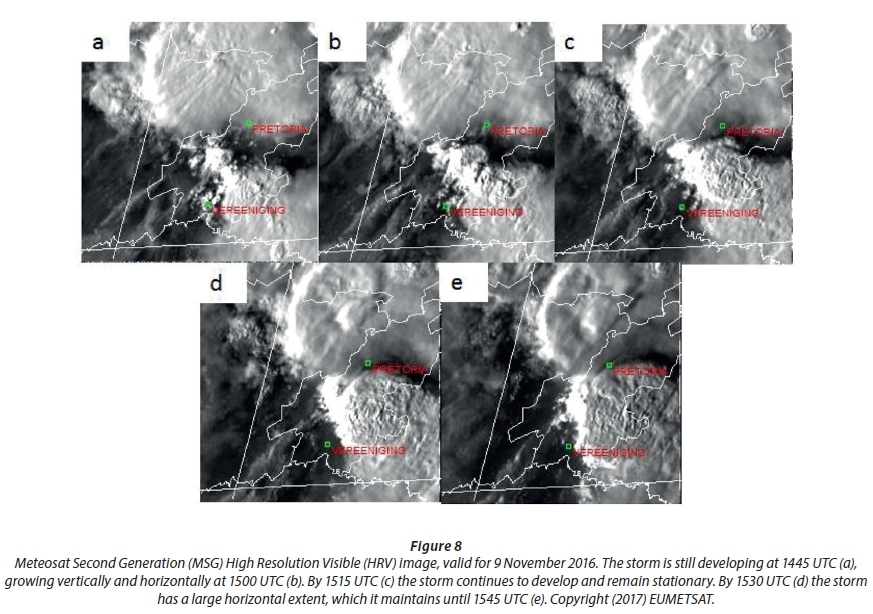
Heavy rainfall is defined by SAWS (2013) as > 50 mm of rainfall in 24 h. Flash flooding or localised urban flooding which results from a thunderstorm would classify that thunderstorm as being severe. In the afternoon and early evening hours of 9 November 2016, motorists and residents around the Edenvale area (geographical positions indicated on Fig. 1) in the Ekurhuleni Metropolitan Municipality were subjected to the effects of a near-stationary thunderstorm which developed over the area and resulted in 90 mm of rain falling over a 60-min period at OR Tambo International airport. The copious rainfall resulted in a deluge of water inundating the area, as a thunderstorm developed and remained nearly stationary through its maturity and dissipation. This resulted in unrelenting precipitation (Table 5) between approximately 1500 UTC and 1600 UTC, which is the peak rush hour on the roads.
The HRV images (used to identify high-definition cloud features) show that development started at 1430 UTC over the Edenvale area. These cumulus clouds rapidly grew in vertical and horizontal extent between 1430 and 1500 UTC, with the most notable horizontal and vertical growth between 1500 and 1515 UTC (Fig. 8b and c).
The DM RGB (not shown) is used to distinguish between cloud particle phases (ice or water), and this RGB showed a dominance of small ice particles at the top of the clouds between 1500 and 1515 UTC, which is indicative of a growing storm with an active updraft, carrying new ice to the top of the cloud. The depth of the developing storm is also reflected in the CTT from an infra-red image (measuring thermal properties of clouds), as by 1530 UTC the CTT was measured as approximately −80°C (Fig. 9).
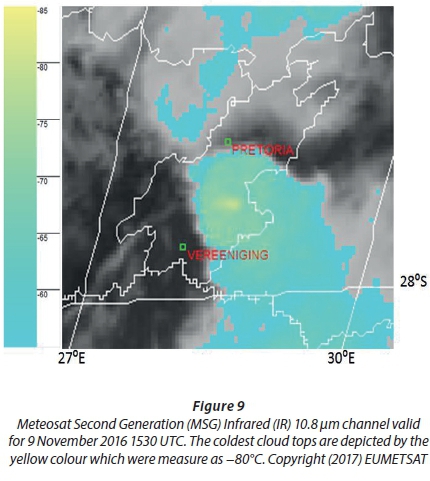
Table 5 shows the 5-min rainfall at OR Tambo International Airport (otherwise known as Johannesburg International Weather Office) between 1500 and 1600 UTC. It is notable that between 1520 and 1540 UTC, a total of 53.4 mm was recorded, with 17.2 mm falling in just 5 min (between 1535 and 1540 UTC). The timing of this increased rainfall coincides well with the growth of the storm as seen on the satellite image, the rapid decrease in CTT and the identification of an overshooting top on the thunderstorm.
The sounding parameters for Irene were very favourable for convective heavy rainfall on the 9th. Notably the KI, which was developed to identify the possibility of heavy rainfall (Henry, 2000), was close to 50°C and close to the maximum KI ever recorded at Irene (Fig. 5). The Lifted Index was −5°C and the CAPE 1 446 J·kg-1. The LI (CAPE) values on the 9th were more favourable than the lower (higher) quartiles of the long-term mean values in November months at Irene. Note that the average 300-400 hPa wind speed was only 9 ms-1 and significantly less than the long-term November average (Fig. 5). These relatively weak winds explain the semi-stationary nature of the storms which developed on this day.
Case summary
The combination of a rapidly-developing, slow-moving thunderstorm with a strong updraft and elevated amounts of instability resulted in very heavy rainfall at OR Tambo International Airport on 9 November. On this day the upper air sounding revealed that the average speed of the steering winds was well below average, the instability indices were above average in the presence of favourable wind shear. These combined conditions would have been instrumental in the development on that day of a thunderstorm that was potentially severe in nature. The addition of slow storm speed resulted in the thunderstorm hardly moving, while copious amounts of rain fell over a limited area. The inability for the large amount water on the ground to drain quickly enough due to urban infrastructure, consequently resulted in flash flooding occurring.
Tornado observed near Grootvlei in Mpumalanga on 15 November 2016
A tornado is defined by Goliger et al. (1997) as a violently rotating column of air with small diameter, extending from a thunderstorm to the ground. Tornadoes are not a common occurrence over South Africa (Rae, 2015), although Gauteng is one of the most likely provinces to experience tornadic activity (Goliger and Retief, 2007).
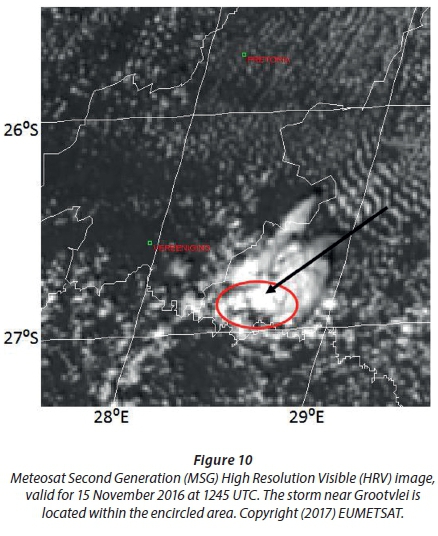
On 15 November 2016, at approximately 1315 UTC, a tornado was observed in an open field, near the settlement of Grootvlei (geographical position indicated on Fig. 1) in the south-western parts of the Mpumalanga Province. The HRV imagery shows that storm started to develop at around 1200 UTC and by 1245 UTC an anvil was clearly visible, extending from the convective cloud, confirming that the cumulonimbus cloud had reached its mature phase (Fig. 10). The anvil can be seen as the thinner cloud (i.e., not as brightly white) stretching away from the storm towards the northeast. The IR10.8 µm satellite imagery at the corresponding time reveals that CTT's were in the region of −63°C (not shown).
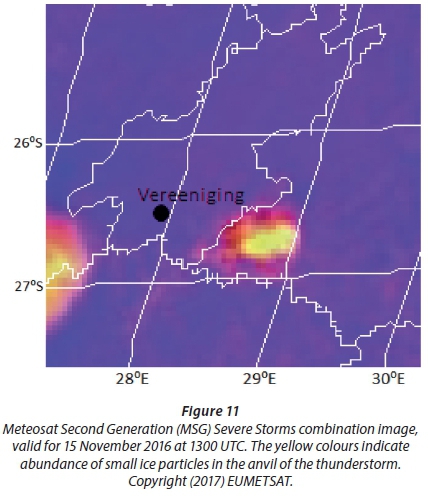
The SS RGB (used to distinguish the size of ice particles) shows evidence to suggest the rapid ascent of small ice particles (bright yellow colour) to the top of the thunderstorm, which is indicative of a strong and active updraft (Fig. 11).
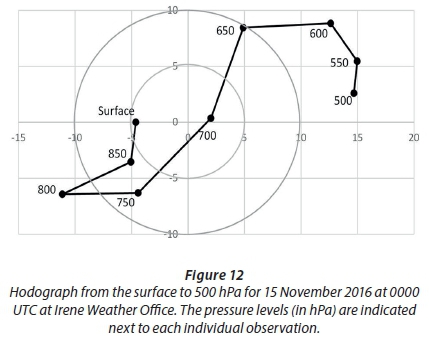
The upper air ascents analysed for this research are deployed from the Irene Weather Office, where the Irene radar is located (Fig. 2). The hodograph (Fig. 12), constructed from the Irene upper air ascent at 0000 UTC on 15 November 2016, shows how the wind backs (turns counter-clockwise) with decreasing pressure. This hodograph depicts significant speed and directional wind shear at Irene. The winds changed from easterly to north-easterly at the surface to south-westerly winds at pressures lower than 700 hPa. From Table 4 it can be seen that the speed shear between the surface and 400 hPa was 11 m·s-1. This occurred in an environment which was convectively very unstable as CAPE values were 1 670 J·kg-1. This value is very high for a November month and more than 1 000 J·kg-1 higher than the long-term November mean (Fig. 5). These conditions were ideal for the development of severe thunderstorms and even supercells (Rae, 2015) although there is no evidence in satellite imagery or radar data that a supercell developed on this day. The average 300-400 hPa winds were 23 m·s-1, which is much stronger than the long-term mean (Fig. 5) and more than twice as strong as on 9 November 2016.
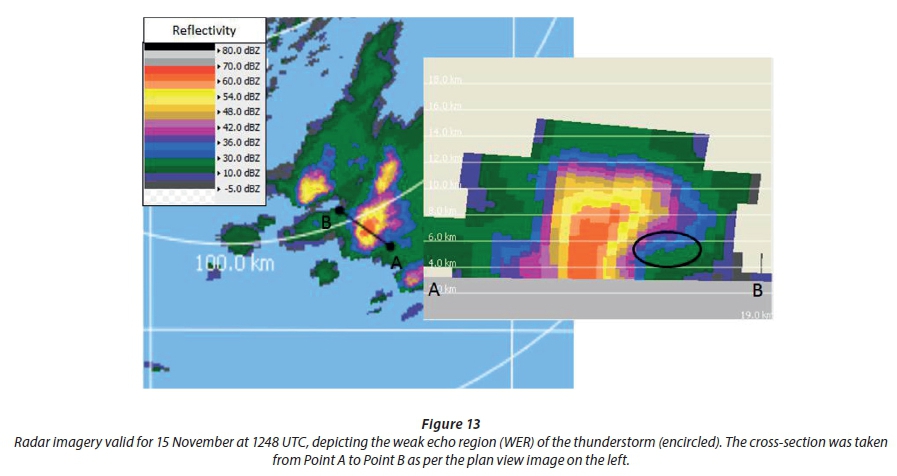
The vertical cross-section of the thunderstorm in the radar data as detected by the SAWS Irene radar (Fig. 2) at 1248 UTC reveals a weak echo region (WER) on the north-western side of the storm (Fig. 13). A WER is an area of weak radar echo which is bounded on one side and above by strong echo and occurs above the low-level inflow of the thunderstorm, produced by a strong updraft (AMS, 2017).
By 1300 UTC an overshooting top is visible on the radar image, directly above the area of the updraft (Fig. 14). This feature on radar images corresponds to the bright yellow area seen over the south-western sector of the storm in Fig. 11. Subsequent radar imagery, up to and including 1312 UTC, all show that the highest reflectivity has migrated to the lower reaches of the storm, as the downdraft dominates within the storm.
Consulting the radar velocity field, which is a radar measurement of a moving target, which will shift the frequency of the radar signal depending on its speed (Rinehart, 2010), at 1248 UTC there is an indication of rotation within the storm near to Grootvlei, which can be seen in Fig. 15 below. The presence of rotation within the cloud can be indicative of mesocyclone development.

Case study summary
By only considering satellite imagery for 15 November, it was not evident that the storm in question was at all severe or even significant. The consideration of sounding data taken at 0000 UTC provided information about the state of the atmosphere, which was very favourable for severe thunderstorm development over the Highveld on the day. The large amount of instability in the presence of favourable wind shear resulted in the formation of a severe thunderstorm with evidence of rotation within the storm, as seen on radar imagery. The nature of the low-level inflow also resulted in a WER and overshooting top being detected by the radar. These signatures are typical of severe thunderstorms and were needed to diagnose the severity of the thunderstorm. This case again demonstrates the importance of vertical observations of the atmosphere (using radar and radiosondes) in detecting severe and high-impact thunderstorms. It is shown yet again that satellite data alone is not always sufficient. In cases such as this, the reporting of a tornado by members of the public was invaluable in verifying the presence of severe thunderstorms on the day.
CONCLUSIONS AND RECOMMENDATIONS
Although November is a month where severe weather is recorded and anticipated over the Highveld and north-eastern parts of South Africa, Nov16 proved to be a month where the degree of severity, in terms of rainfall amounts exceeding normal, and the occurrence of tornadoes, seemed higher than one would expect. The TSE values in Nov16 were higher than normal over the Highveld resulting in the air mass being more conducive for the development of thundershowers than the long-term mean. Furthermore the 500 hPa temperature trough was located over the Highveld resulting in a more unstable atmosphere. The general circulation features associated with severe storms over the Highveld should be explored further in order to identify a general trend.
The frequency of the tornadoes in Nov16 can partly be attributed to the relationship between the CAPE and wind shear being optimal for the development of thunderstorms which could spawn a tornado.
The case of 9 November was evidence of the impact that weak steering winds can have on the amount of rainfall affecting an area. The thunderstorm over Edenvale matured and dissipated over a very limited area, releasing in 90 mm of rainfall in 60-min. The inability of this amount of water to drain away caused the highways and roads in the area to flood rapidly, giving motorists, residents and pedestrians little option to escape. On 15 November, the satellite imagery did not indicate the severity of the storm but there were clear signatures on the radar of the severity of the storm. Eye-witness reports confirmed the presence of a tornado. When the sounding data for 0000 UTC is considered, including the variables and subsequent derived products, all data points towards a very unstable atmosphere with a favourable wind shear environment for severe storms to develop. On close inspection of the radar imagery, the presence of a WER, overshooting top and evidence of possible rotation were further verification that a severe thunderstorm had in fact developed.
In both case-study instances, the mean atmospheric conditions gave rise to a pre-existing tendency for the development of severe thunderstorms. Following that, the sounding data for each case study gave overwhelming evidence of the potential for severe weather on both days, which was verified by the occurrence of the flash flooding and tornadic events. The list of severe weather events during Nov16 is extensive, and a similar approach to determining the state of the general circulation patterns, temperatures and moisture is essential to be able to determine the potential for severe weather. In particular, the inclusion of upper-air sounding data proves invaluable when determining whether the atmosphere could support severe storm development and it is recommended that operational forecasters include this data in their daily activities.
During November 2016 the capacity of the Vaal Dam rose by nearly 10% from 26.6% to 36.3% (DWA, 2017b). Some of this water was pumped from the Sterkfontein Dam but the anomalously high rainfall which occurred over the Highveld during this period helped to replenish the water supply and elevate the pressure on the Vaal Dam water system.
ACKNOWLEDGEMENTS
We would like to acknowledge the use of radar data from the Irene radar and historical rainfall figures courtesy of the South African Weather Service. Ms Christina Thaele shared her insights on radar interpretation, which is much appreciated. The use of MSG satellite imagery was courtesy of Eumetsat.
REFERENCES
AMS (American Meteorological Society) (2017) Glossary of meteorology. URL: http://glossary.ametsoc.org/wiki/Main_Page (Accessed 5 April 2017). [ Links ]
BECKER EH (2014) Application of a quantitative precipitation estimation algorithm for the S-Band radar at Irene, South Africa. MSc thesis, University of KwaZulu-Natal. [ Links ]
CITY OF JOHANNESBURG (2017) Water restrictions for Johannesburg. URL: https://tinyurl.com/zdzh73b (Accessed 27 February 2017). [ Links ]
COSTA S, MEZZASALMA P, LEVIZZANI V, ALBERONI PP and NANNI S (2001) Deep convection over Northern Italy: synoptic and thermodynamic analysis. Atmos. Res. 56 73-88. https://doi.org/10.1016/S0169-8095(00)00091-0 [ Links ]
CRAVEN JP and BROOKS HE (2004) Baseline climatology of sounding derived parameters associated with deep moist convection. Natl Weather Dig. 28 13-24. [ Links ]
DE CONING E (2014) Personal communication, 2 July 2014. Dr Estelle de Coning, World Meteorological Organization, 7bis, Avenue de la Paix, CP No. 2300, Geneva 2, Switzerland CH-1211. [ Links ]
DWS (Department of Water and Sanitation) (2017a) DWS to release water from Sterkfontein into the Vaal Dam to counter depleting levels. URL: https://tinyurl.com/z68fhxn (Accessed 27 February 2017). [ Links ]
DWS (Department of Water and Sanitation) (2017b) DWS encourages water users to continue saving water. URL: https://tinyurl.com/y7lge3ll (Accessed 27 February 2017). [ Links ]
DOSWELL CA III and RASMUSSEN EN (1994) The effect of neglecting the virtual temperature correction on CAPE calculations. Weather Forecast. 9 625-629. https://doi.org/10.1175/1520-0434(1994)009<0625:TEONTV>2.0.CO;2 [ Links ]
DUPILKA ML and REUTER GW (2006) Forecasting tornadic thunderstorm potential in Alberta using environmental sounding data. Part I: Wind shear and buoyancy. Weather Forecast. 21 325-335. https://doi.org/10.1175/WAF921.1 [ Links ]
DYSON LL (2009) Heavy daily-rainfall characteristics over the Gauteng Province. Water SA 35627-638. https://doi.org/10.4314/wsa.v35i5.49188 [ Links ]
DYSON LL and VAN HEERDEN J (2002) A model for the identification of tropical weather systems. Water SA 28 (3) 249-258. https://doi.org/10.4314/wsa.v28i3.4892 [ Links ]
DYSON LL, VAN HEERDEN J and SUMNER PD (2015) A baseline climatology of sounding‐derived parameters associated with heavy rainfall over Gauteng, South Africa. Int. J. Climatol. 35 (1) 114-127. https://doi.org/10.1002/joc.3967 [ Links ]
EUMETSAT (2017a) Meteosat Second Generation Satellite imagery. URL: www.eumetsat.int (Accessed 4 April 2017). [ Links ]
EUMETSAT (2017b) RGB composites with channels 01-11 and their interpretation. URL: http://oiswww.eumetsat.org/WEBOPS/msg_interpretation/msg_channels.php (Accessed 4 April 2017). [ Links ]
GOLIGER A, MILFORD R, ADAM F and EDWARDS M (1997) Inkanyamba - Tornadoes in South Africa. CSIR & South African Weather Bureau, Pretoria. 77 pp. [ Links ]
GOLIGER A and RETIEF JV (2007) Severe wind phenomena in South Africa and the related damage. J. Wind Eng. Ind. Aerodyn. 95 1065-1078. https://doi.org/10.1016/j.jweia.2007.01.029 [ Links ]
HENRY NL (2000) A static stability index for low-topped convection. Weather Forecast. 15 246-254. https://doi.org/10.1175/1520-0434(2000)015<0246:ASSIFL>2.0.CO;2 [ Links ]
KALNAY E, KANAMITSU M, KISTLER R, COLLINS W, DEAVEN D, GANDIN L, IREDELL M, SAHA S, WHITE G, WOOLLEN J and co-authors (1996) The NCEP/NCAR 40-year reanalysis project. Bull. Am. Meteorol. Soc. 77 437-470. https://doi.org/10.1175/1520-0477(1996)077<0437:TNYRP>2.0.CO;2 [ Links ]
MOLLER AR, DOSWELL III CA, FOSTER MP and WOODALL GR (1994) The operational recognition of supercell thunderstorm environments and storm structures. Weather Forecast. 9 (3) 327-347. https://doi.org/10.1175/1520-0434(1994)009<0327:TOROST>2.0.CO;2 [ Links ]
NOAA (National Oceanic and Atmospheric Administration) (2017) Sea surface temperature anomaly image animation (full) over the past six months. URL: http://www.ospo.noaa.gov/Products/ocean/sst/anomaly/anim_full.html (Accessed 3 April 2017). [ Links ]
News24 (2016) Toddler's body found in Jukskei River. URL: https://www.news24.com/SouthAfrica/News/toddlers-body-found-in-jukskei-river-20161122 (Accessed 4 April 2017). [ Links ]
News24 (2017) Drought-stricken areas runneth over thanks to massive water drive. URL: https://tinyurl.com/jr9whon (Accessed 27 February 2017). [ Links ]
PIENAAR N and DYSON LL (2015) Atmospheric anomalies during the 2012/13 extreme hail seasons over Gauteng. Proceedings of the 31st Annual conference of South African Society for Atmospheric Sciences, 21-22 September 2015, Hennops River Valley, South Africa. [ Links ]
RAE KJ (2015) A modified Supercell Composite Parameter for supercell thunderstorms over the Gauteng Province, South Africa. MSc thesis, University of Pretoria. [ Links ]
RINEHART RE (2010) Radar for Meteorologists. Rinehart Publications, Nevada. 482 pp. [ Links ]
SAWS (South African Weather Service) (2013) Standard Work Instructions (SWI): Weather Related Alerts. ISO9001 Document reference: FCAST-SWI-Weather Related Alerts -002.0. SAWS, Pretoria. [ Links ]
SAWS (South African Weather Service) (2016a) Climate Summary of South Africa 27 (10) Oct 2016. SAWS (South African Weather Service) (2016b) Climate Summary of South Africa 27 (11) Nov 2016.
SAWS (South African Weather Service) (2017) Historical rainfall maps. URL: http://www.weathersa.co.za/climate/historical-rain-maps. (Accessed 27 February 2017). [ Links ]
TERBLANCHE DE (1985) Die hailstorm van 1 November 1985. South African Weather Bureau monthly newsletter. November 1985. 1-6. [ Links ]
Received 10 April 2017
Accepted in revised form 13 December 2017
* To whom all correspondence should be addressed. e-mail: lee-ann.simpson@weathersa.co.za

